Sylvania, AL
Sylvania Map
Sylvania Overview
1,971
TOTAL POPULATION
831
MALE POPULATION
1,140
FEMALE POPULATION
72.89
MALES / 100 FEMALES
137.18
FEMALES / 100 MALES
36.7
MEDIAN AGE
3.4
AVG FAMILY SIZE
2.8
AVG HOUSEHOLD SIZE
$27,029
PER CAPITA INCOME
$59,750
AVG FAMILY INCOME
$50,993
AVG HOUSEHOLD INCOME
35.9%
WAGE / INCOME GAP [ % ]
64.1¢/ $1
WAGE / INCOME GAP [ $ ]
0.47
INEQUALITY / GINI INDEX
1,000
LABOR FORCE [ PEOPLE ]
66.2%
PERCENT IN LABOR FORCE
3.4%
UNEMPLOYMENT RATE
Sylvania Zip Codes
Sylvania Area Codes
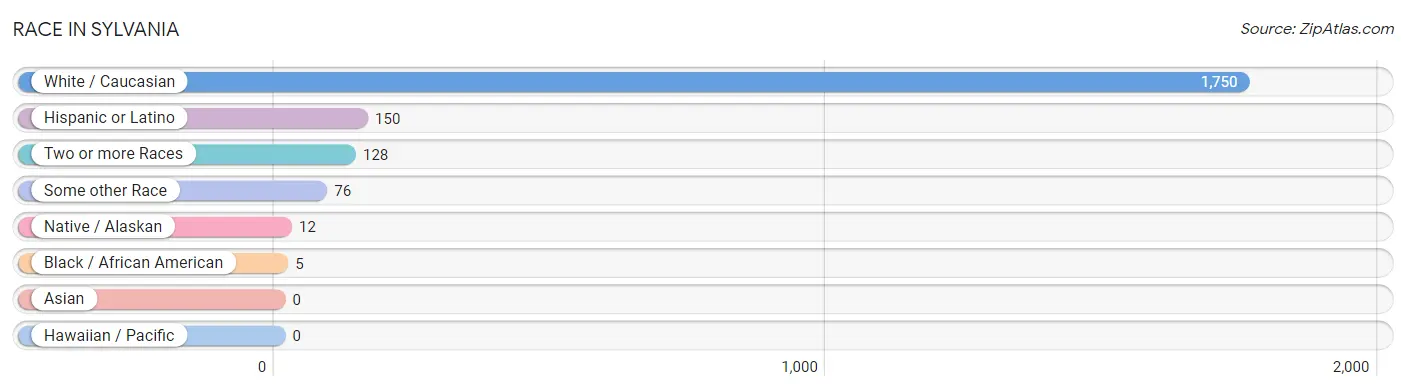
Race in Sylvania
The most populous races in Sylvania are White / Caucasian (1,750 | 88.8%), Hispanic or Latino (150 | 7.6%), and Two or more Races (128 | 6.5%).
| Race | # Population | % Population |
| Asian | 0 | 0.0% |
| Black / African American | 5 | 0.3% |
| Hawaiian / Pacific | 0 | 0.0% |
| Hispanic or Latino | 150 | 7.6% |
| Native / Alaskan | 12 | 0.6% |
| White / Caucasian | 1,750 | 88.8% |
| Two or more Races | 128 | 6.5% |
| Some other Race | 76 | 3.9% |
| Total | 1,971 | 100.0% |
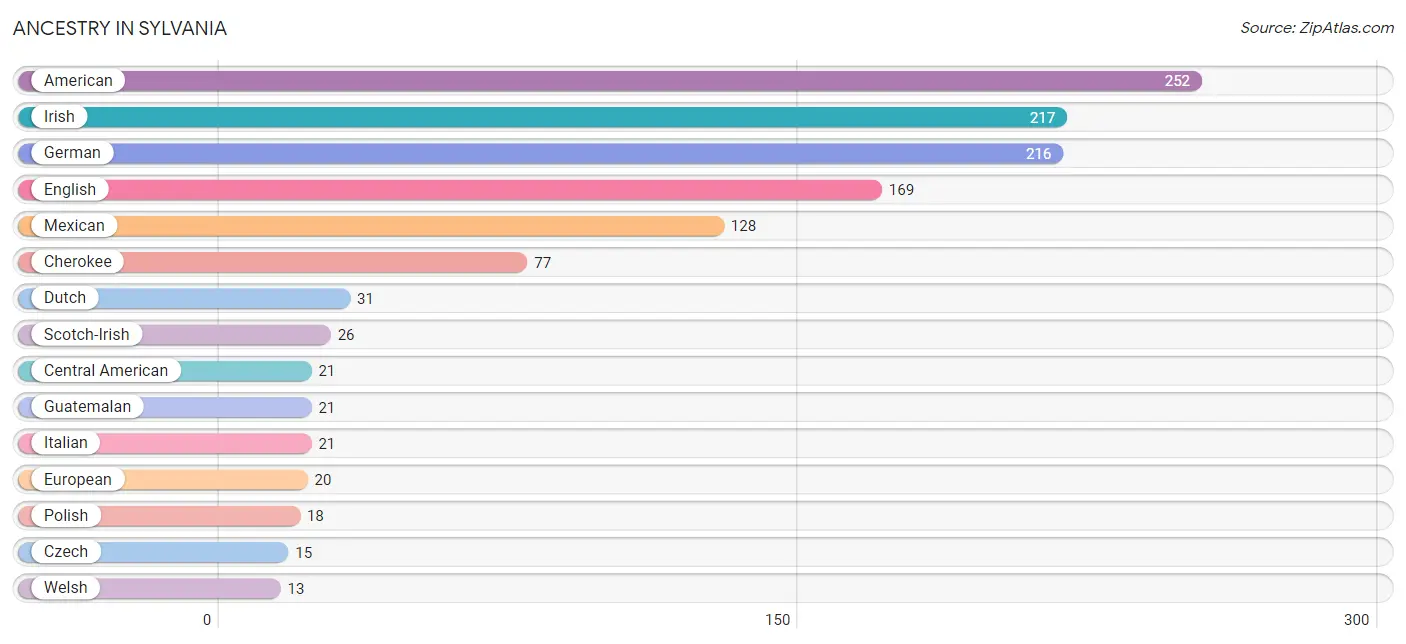
Ancestry in Sylvania
The most populous ancestries reported in Sylvania are American (252 | 12.8%), Irish (217 | 11.0%), German (216 | 11.0%), English (169 | 8.6%), and Mexican (128 | 6.5%), together accounting for 49.8% of all Sylvania residents.
| Ancestry | # Population | % Population |
| American | 252 | 12.8% |
| Central American | 21 | 1.1% |
| Central American Indian | 4 | 0.2% |
| Cherokee | 77 | 3.9% |
| Czech | 15 | 0.8% |
| Dutch | 31 | 1.6% |
| English | 169 | 8.6% |
| European | 20 | 1.0% |
| French | 12 | 0.6% |
| German | 216 | 11.0% |
| Greek | 6 | 0.3% |
| Guatemalan | 21 | 1.1% |
| Irish | 217 | 11.0% |
| Italian | 21 | 1.1% |
| Jamaican | 4 | 0.2% |
| Mexican | 128 | 6.5% |
| Norwegian | 11 | 0.6% |
| Polish | 18 | 0.9% |
| Scotch-Irish | 26 | 1.3% |
| Scottish | 12 | 0.6% |
| Swedish | 4 | 0.2% |
| Swiss | 5 | 0.3% |
| Welsh | 13 | 0.7% | View All 23 Rows |
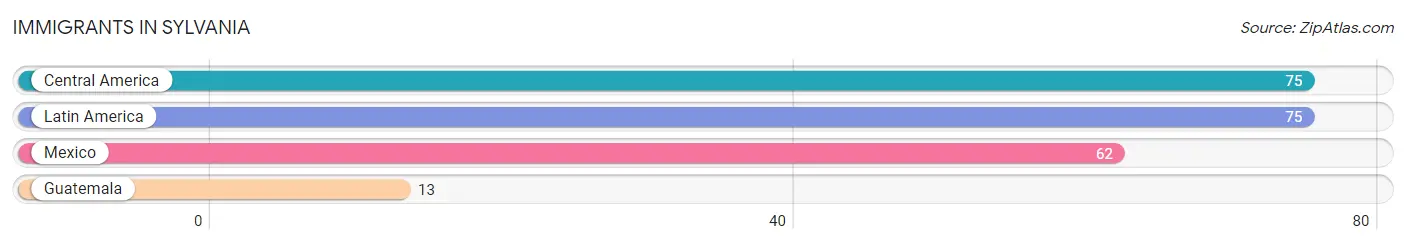
Immigrants in Sylvania
The most numerous immigrant groups reported in Sylvania came from Central America (75 | 3.8%), Latin America (75 | 3.8%), Mexico (62 | 3.2%), and Guatemala (13 | 0.7%), together accounting for 11.4% of all Sylvania residents.
| Immigration Origin | # Population | % Population |
| Central America | 75 | 3.8% |
| Guatemala | 13 | 0.7% |
| Latin America | 75 | 3.8% |
| Mexico | 62 | 3.2% | View All 4 Rows |
Sex and Age in Sylvania
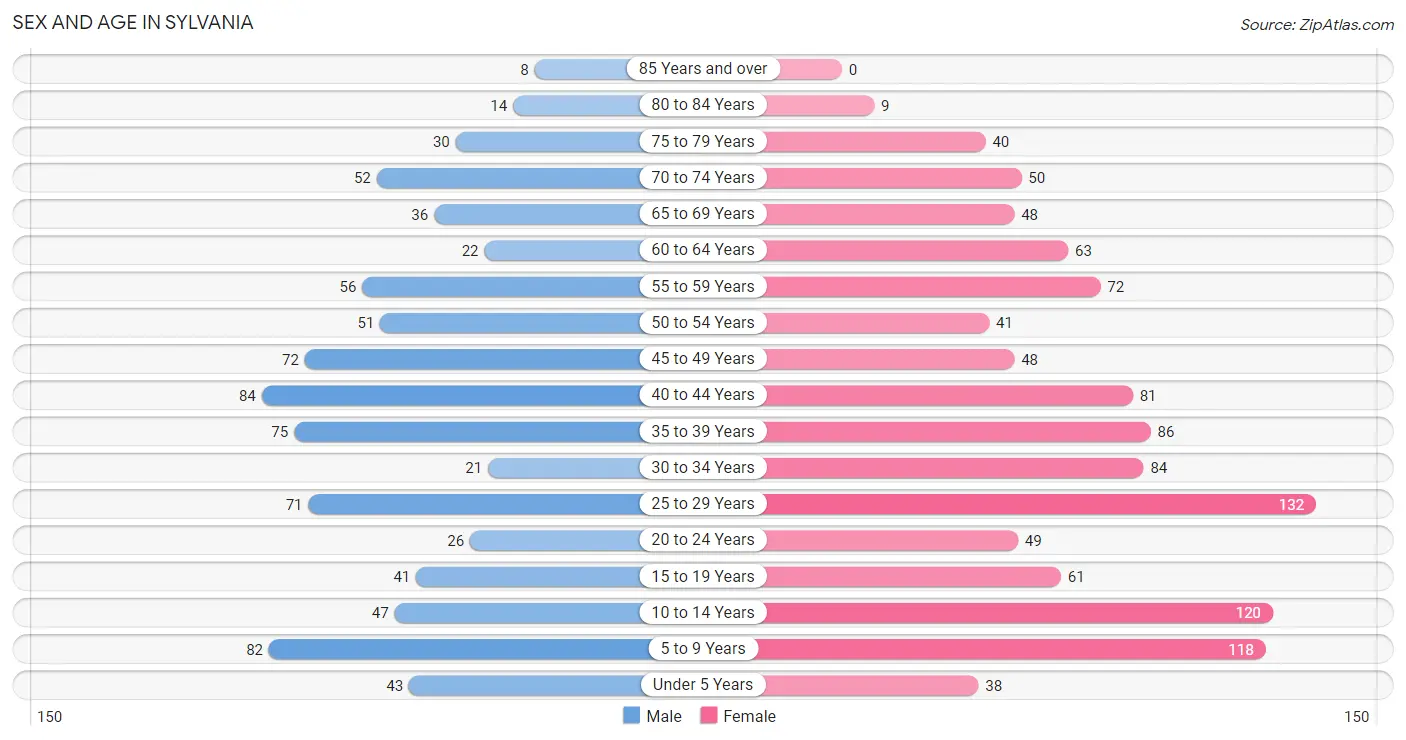
Sex and Age in Sylvania
The most populous age groups in Sylvania are 40 to 44 Years (84 | 10.1%) for men and 25 to 29 Years (132 | 11.6%) for women.
| Age Bracket | Male | Female |
| Under 5 Years | 43 (5.2%) | 38 (3.3%) |
| 5 to 9 Years | 82 (9.9%) | 118 (10.3%) |
| 10 to 14 Years | 47 (5.7%) | 120 (10.5%) |
| 15 to 19 Years | 41 (4.9%) | 61 (5.3%) |
| 20 to 24 Years | 26 (3.1%) | 49 (4.3%) |
| 25 to 29 Years | 71 (8.5%) | 132 (11.6%) |
| 30 to 34 Years | 21 (2.5%) | 84 (7.4%) |
| 35 to 39 Years | 75 (9.0%) | 86 (7.5%) |
| 40 to 44 Years | 84 (10.1%) | 81 (7.1%) |
| 45 to 49 Years | 72 (8.7%) | 48 (4.2%) |
| 50 to 54 Years | 51 (6.1%) | 41 (3.6%) |
| 55 to 59 Years | 56 (6.7%) | 72 (6.3%) |
| 60 to 64 Years | 22 (2.6%) | 63 (5.5%) |
| 65 to 69 Years | 36 (4.3%) | 48 (4.2%) |
| 70 to 74 Years | 52 (6.3%) | 50 (4.4%) |
| 75 to 79 Years | 30 (3.6%) | 40 (3.5%) |
| 80 to 84 Years | 14 (1.7%) | 9 (0.8%) |
| 85 Years and over | 8 (1.0%) | 0 (0.0%) |
| Total | 831 (100.0%) | 1,140 (100.0%) |
Families and Households in Sylvania
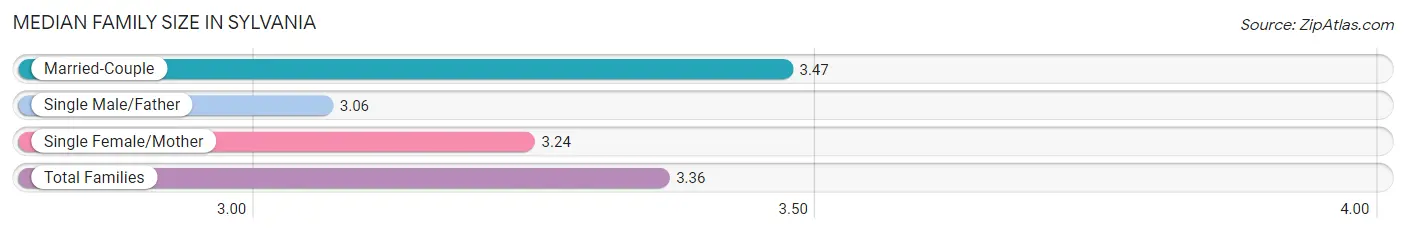
Median Family Size in Sylvania
The median family size in Sylvania is 3.36 persons per family, with married-couple families (309 | 59.5%) accounting for the largest median family size of 3.47 persons per family. On the other hand, single male/father families (53 | 10.2%) represent the smallest median family size with 3.06 persons per family.
| Family Type | # Families | Family Size |
| Married-Couple | 309 (59.5%) | 3.47 |
| Single Male/Father | 53 (10.2%) | 3.06 |
| Single Female/Mother | 157 (30.2%) | 3.24 |
| Total Families | 519 (100.0%) | 3.36 |
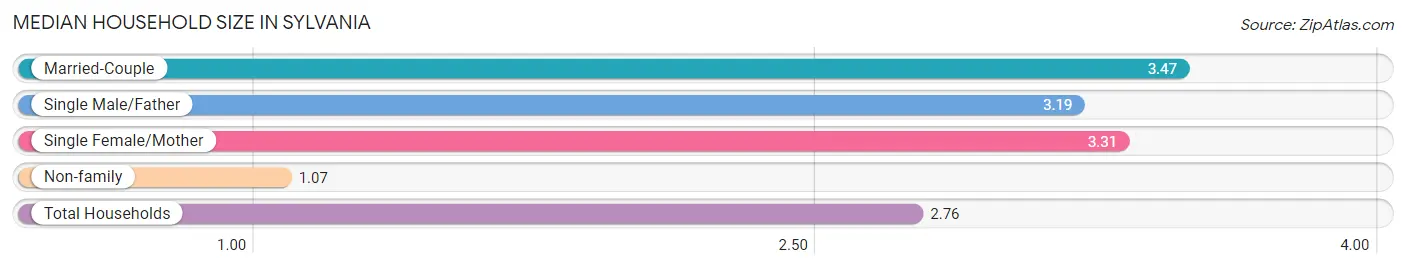
Median Household Size in Sylvania
The median household size in Sylvania is 2.76 persons per household, with married-couple households (309 | 43.2%) accounting for the largest median household size of 3.47 persons per household. non-family households (196 | 27.4%) represent the smallest median household size with 1.07 persons per household.
| Household Type | # Households | Household Size |
| Married-Couple | 309 (43.2%) | 3.47 |
| Single Male/Father | 53 (7.4%) | 3.19 |
| Single Female/Mother | 157 (22.0%) | 3.31 |
| Non-family | 196 (27.4%) | 1.07 |
| Total Households | 715 (100.0%) | 2.76 |
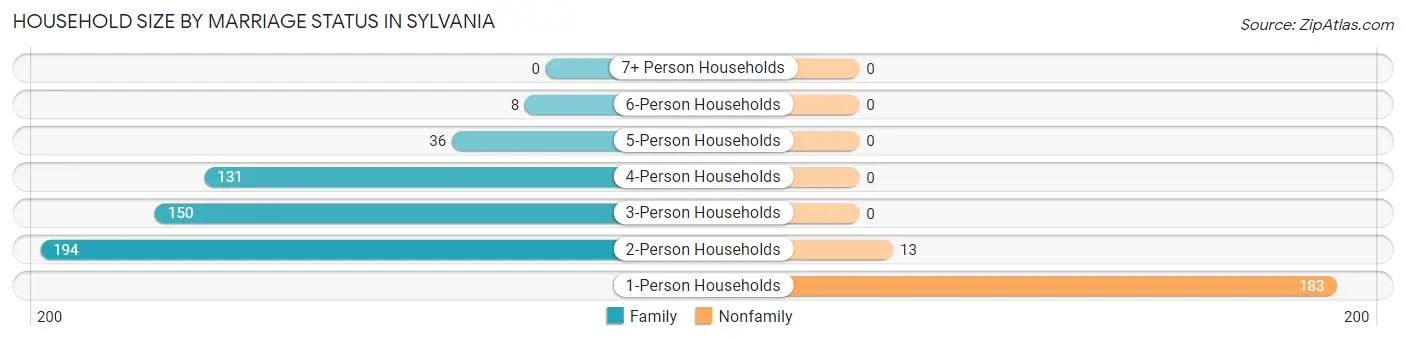
Household Size by Marriage Status in Sylvania
Out of a total of 715 households in Sylvania, 519 (72.6%) are family households, while 196 (27.4%) are nonfamily households. The most numerous type of family households are 2-person households, comprising 194, and the most common type of nonfamily households are 1-person households, comprising 183.
| Household Size | Family Households | Nonfamily Households |
| 1-Person Households | - | 183 (25.6%) |
| 2-Person Households | 194 (27.1%) | 13 (1.8%) |
| 3-Person Households | 150 (21.0%) | 0 (0.0%) |
| 4-Person Households | 131 (18.3%) | 0 (0.0%) |
| 5-Person Households | 36 (5.0%) | 0 (0.0%) |
| 6-Person Households | 8 (1.1%) | 0 (0.0%) |
| 7+ Person Households | 0 (0.0%) | 0 (0.0%) |
| Total | 519 (72.6%) | 196 (27.4%) |
Female Fertility in Sylvania
Fertility by Age in Sylvania
Average fertility rate in Sylvania is 22.0 births per 1,000 women. Women in the age bracket of 15 to 19 years have the highest fertility rate with 66.0 births per 1,000 women. Women in the age bracket of 20 to 34 years acount for 66.7% of all women with births.
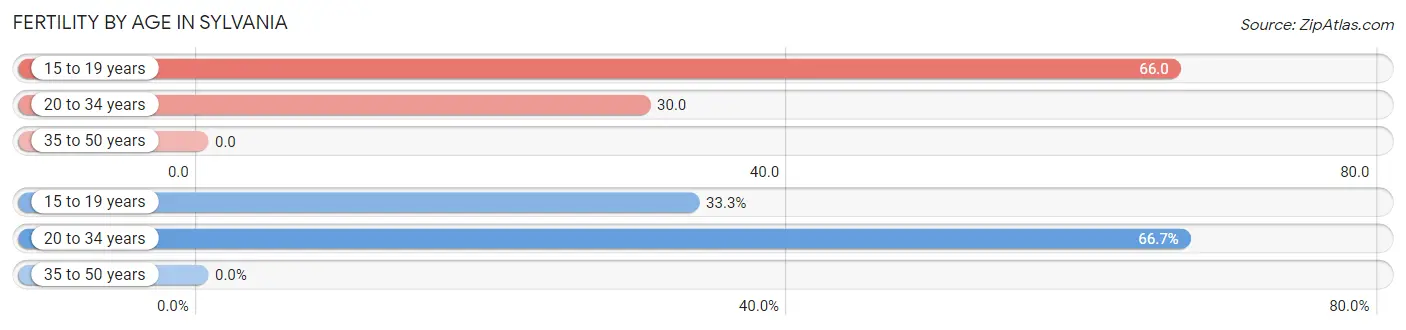
| Age Bracket | Women with Births | Births / 1,000 Women |
| 15 to 19 years | 4 (33.3%) | 66.0 |
| 20 to 34 years | 8 (66.7%) | 30.0 |
| 35 to 50 years | 0 (0.0%) | 0.0 |
| Total | 12 (100.0%) | 22.0 |
Fertility by Age by Marriage Status in Sylvania
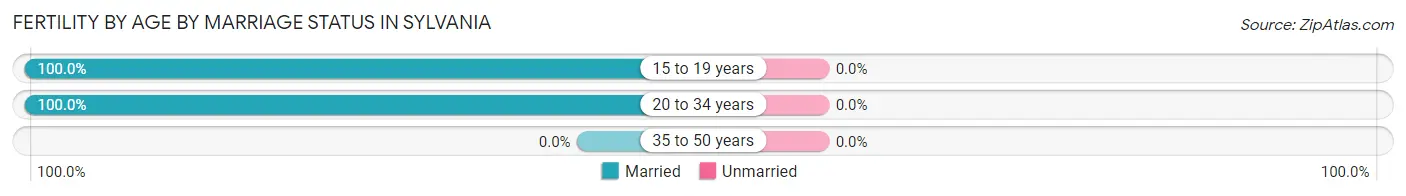
| Age Bracket | Married | Unmarried |
| 15 to 19 years | 4 (100.0%) | 0 (0.0%) |
| 20 to 34 years | 8 (100.0%) | 0 (0.0%) |
| 35 to 50 years | 0 (0.0%) | 0 (0.0%) |
| Total | 12 (100.0%) | 0 (0.0%) |
Fertility by Education in Sylvania
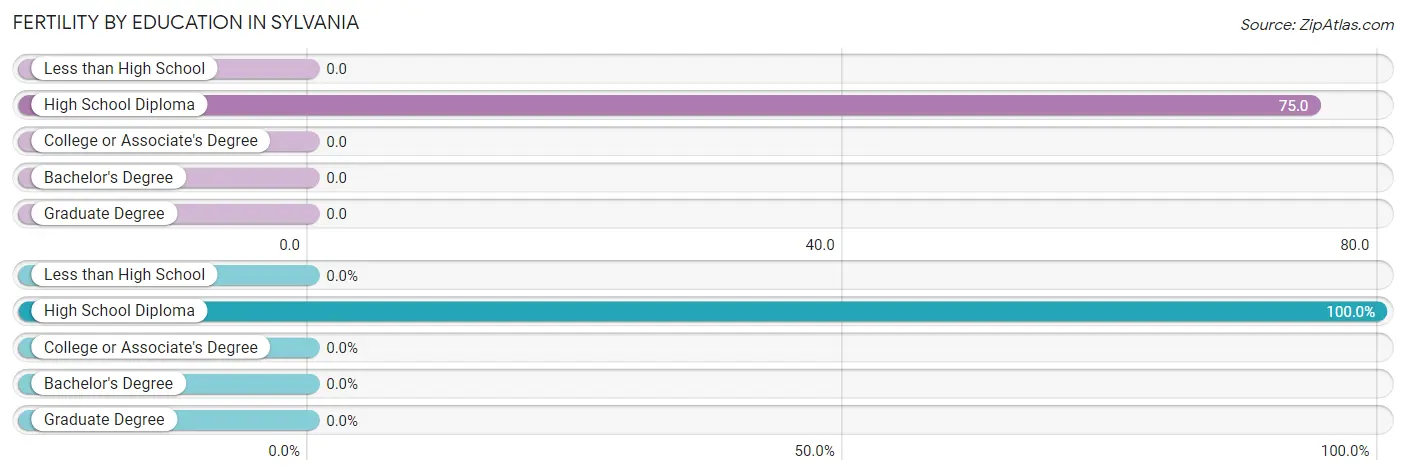
| Educational Attainment | Women with Births | Births / 1,000 Women |
| Less than High School | 0 (0.0%) | 0.0 |
| High School Diploma | 12 (100.0%) | 75.0 |
| College or Associate's Degree | 0 (0.0%) | 0.0 |
| Bachelor's Degree | 0 (0.0%) | 0.0 |
| Graduate Degree | 0 (0.0%) | 0.0 |
| Total | 12 (100.0%) | 22.0 |
Fertility by Education by Marriage Status in Sylvania
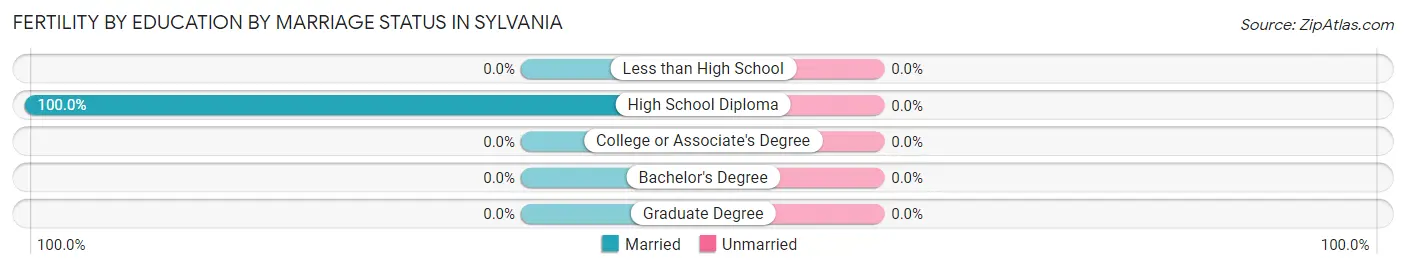
| Educational Attainment | Married | Unmarried |
| Less than High School | 0 (0.0%) | 0 (0.0%) |
| High School Diploma | 12 (100.0%) | 0 (0.0%) |
| College or Associate's Degree | 0 (0.0%) | 0 (0.0%) |
| Bachelor's Degree | 0 (0.0%) | 0 (0.0%) |
| Graduate Degree | 0 (0.0%) | 0 (0.0%) |
| Total | 12 (100.0%) | 0 (0.0%) |
Income in Sylvania
Income Overview in Sylvania
Per Capita Income in Sylvania is $27,029, while median incomes of families and households are $59,750 and $50,993 respectively.
| Characteristic | Number | Measure |
| Per Capita Income | 1,971 | $27,029 |
| Median Family Income | 519 | $59,750 |
| Mean Family Income | 519 | $81,648 |
| Median Household Income | 715 | $50,993 |
| Mean Household Income | 715 | $67,521 |
| Income Deficit | 519 | $0 |
| Wage / Income Gap (%) | 1,971 | 35.92% |
| Wage / Income Gap ($) | 1,971 | 64.08¢ per $1 |
| Gini / Inequality Index | 1,971 | 0.47 |
Earnings by Sex in Sylvania
Average Earnings in Sylvania are $29,602, $38,818 for men and $24,873 for women, a difference of 35.9%.
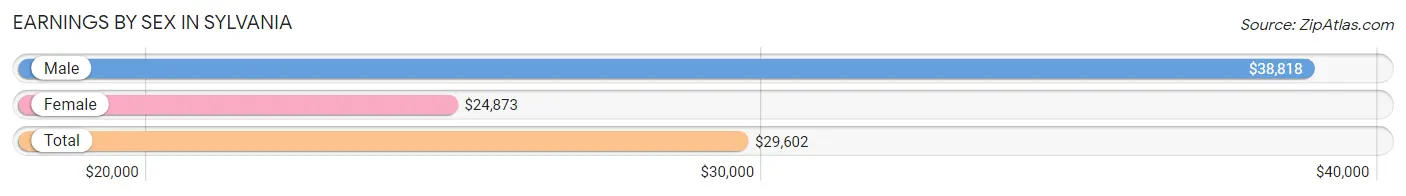
| Sex | Number | Average Earnings |
| Male | 428 (43.2%) | $38,818 |
| Female | 562 (56.8%) | $24,873 |
| Total | 990 (100.0%) | $29,602 |
Earnings by Sex by Income Bracket in Sylvania
The most common earnings brackets in Sylvania are $35,000 to $39,999 for men (73 | 17.1%) and $25,000 to $29,999 for women (106 | 18.9%).
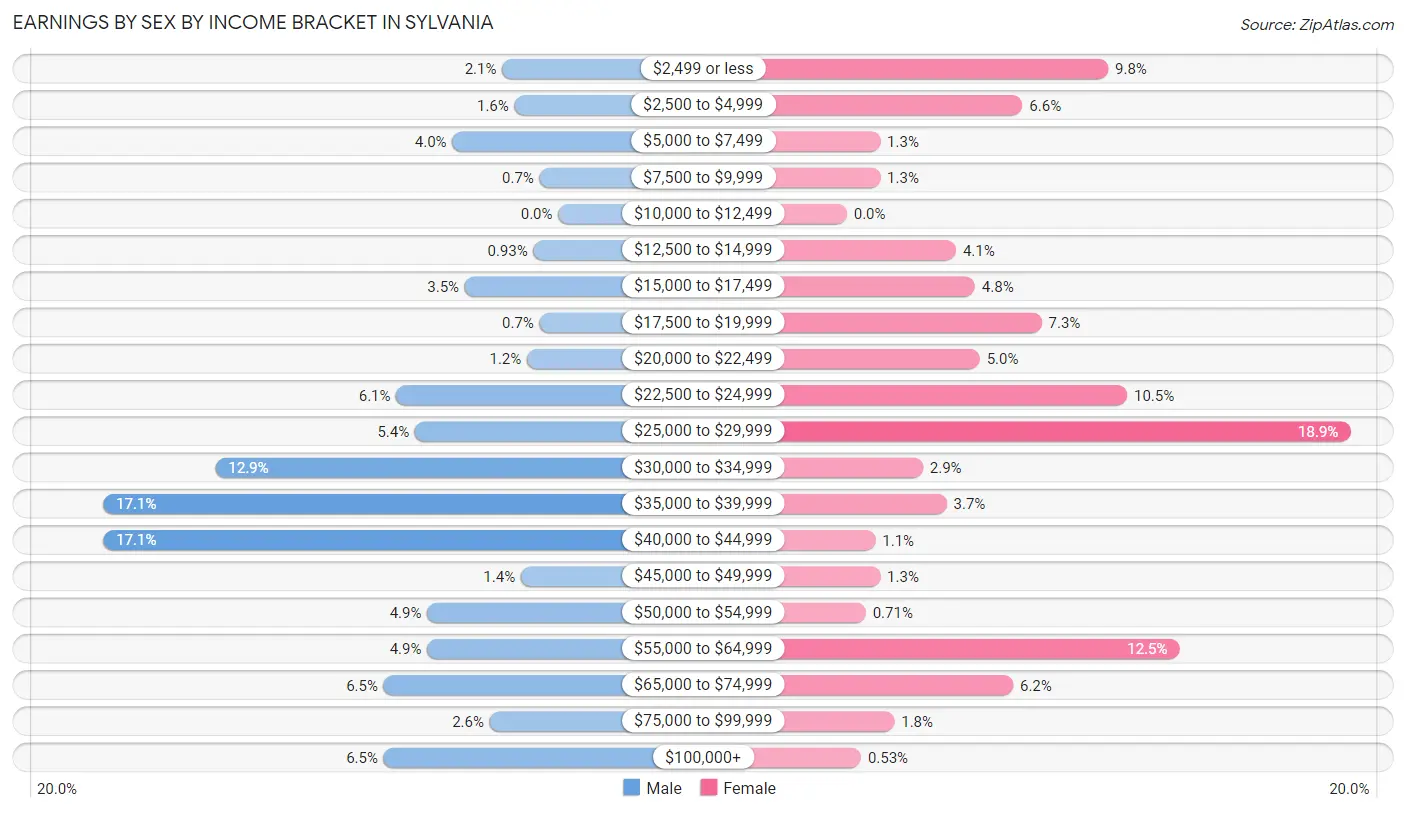
| Income | Male | Female |
| $2,499 or less | 9 (2.1%) | 55 (9.8%) |
| $2,500 to $4,999 | 7 (1.6%) | 37 (6.6%) |
| $5,000 to $7,499 | 17 (4.0%) | 7 (1.3%) |
| $7,500 to $9,999 | 3 (0.7%) | 7 (1.3%) |
| $10,000 to $12,499 | 0 (0.0%) | 0 (0.0%) |
| $12,500 to $14,999 | 4 (0.9%) | 23 (4.1%) |
| $15,000 to $17,499 | 15 (3.5%) | 27 (4.8%) |
| $17,500 to $19,999 | 3 (0.7%) | 41 (7.3%) |
| $20,000 to $22,499 | 5 (1.2%) | 28 (5.0%) |
| $22,500 to $24,999 | 26 (6.1%) | 59 (10.5%) |
| $25,000 to $29,999 | 23 (5.4%) | 106 (18.9%) |
| $30,000 to $34,999 | 55 (12.9%) | 16 (2.9%) |
| $35,000 to $39,999 | 73 (17.1%) | 21 (3.7%) |
| $40,000 to $44,999 | 73 (17.1%) | 6 (1.1%) |
| $45,000 to $49,999 | 6 (1.4%) | 7 (1.3%) |
| $50,000 to $54,999 | 21 (4.9%) | 4 (0.7%) |
| $55,000 to $64,999 | 21 (4.9%) | 70 (12.5%) |
| $65,000 to $74,999 | 28 (6.5%) | 35 (6.2%) |
| $75,000 to $99,999 | 11 (2.6%) | 10 (1.8%) |
| $100,000+ | 28 (6.5%) | 3 (0.5%) |
| Total | 428 (100.0%) | 562 (100.0%) |
Earnings by Sex by Educational Attainment in Sylvania
Average earnings in Sylvania are $39,661 for men and $26,042 for women, a difference of 34.3%. Men with an educational attainment of high school diploma enjoy the highest average annual earnings of $41,076, while those with college or associate's degree education earn the least with $27,222. Women with an educational attainment of graduate degree earn the most with the average annual earnings of $54,375, while those with less than high school education have the smallest earnings of $2,499.
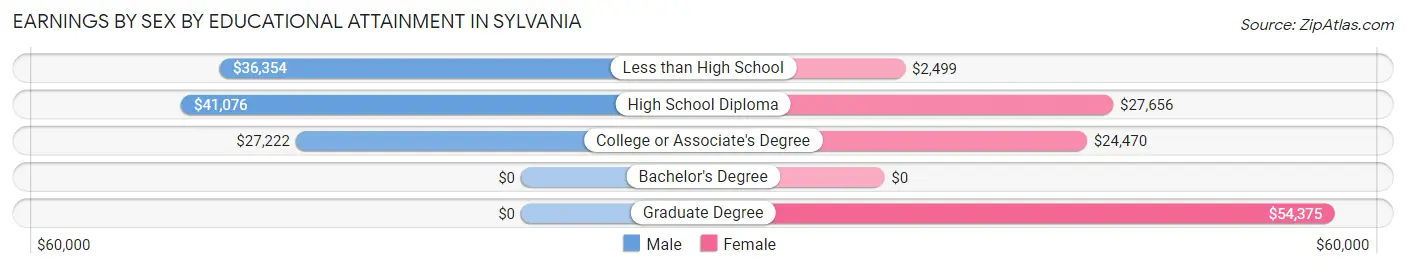
| Educational Attainment | Male Income | Female Income |
| Less than High School | $36,354 | $2,499 |
| High School Diploma | $41,076 | $27,656 |
| College or Associate's Degree | $27,222 | $24,470 |
| Bachelor's Degree | - | - |
| Graduate Degree | - | - |
| Total | $39,661 | $26,042 |
Family Income in Sylvania
Family Income Brackets in Sylvania
According to the Sylvania family income data, there are 126 families falling into the $50,000 to $74,999 income range, which is the most common income bracket and makes up 24.3% of all families. Conversely, the $150,000 to $199,999 income bracket is the least frequent group with only 5 families (1.0%) belonging to this category.
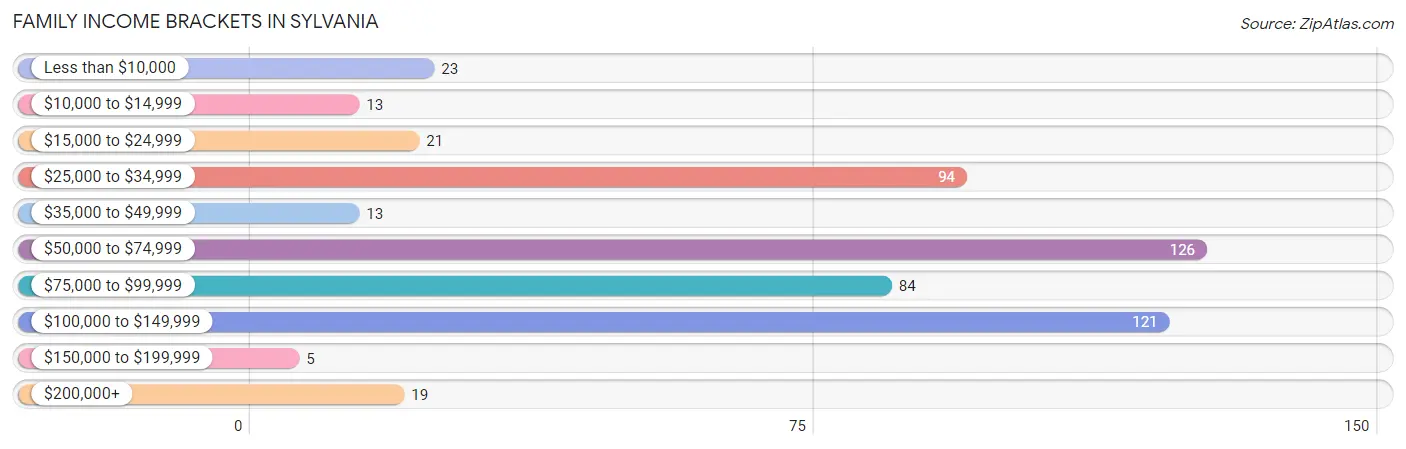
| Income Bracket | # Families | % Families |
| Less than $10,000 | 23 | 4.4% |
| $10,000 to $14,999 | 13 | 2.5% |
| $15,000 to $24,999 | 21 | 4.0% |
| $25,000 to $34,999 | 94 | 18.1% |
| $35,000 to $49,999 | 13 | 2.5% |
| $50,000 to $74,999 | 126 | 24.3% |
| $75,000 to $99,999 | 84 | 16.2% |
| $100,000 to $149,999 | 121 | 23.3% |
| $150,000 to $199,999 | 5 | 1.0% |
| $200,000+ | 19 | 3.7% |
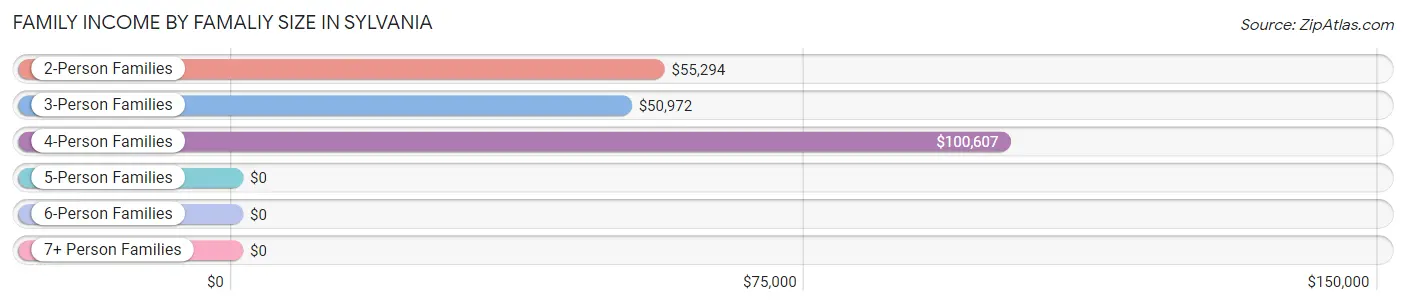
Family Income by Famaliy Size in Sylvania
4-person families (115 | 22.2%) account for the highest median family income in Sylvania with $100,607 per family, while 2-person families (194 | 37.4%) have the highest median income of $27,647 per family member.
| Income Bracket | # Families | Median Income |
| 2-Person Families | 194 (37.4%) | $55,294 |
| 3-Person Families | 166 (32.0%) | $50,972 |
| 4-Person Families | 115 (22.2%) | $100,607 |
| 5-Person Families | 36 (6.9%) | $0 |
| 6-Person Families | 8 (1.5%) | $0 |
| 7+ Person Families | 0 (0.0%) | $0 |
| Total | 519 (100.0%) | $59,750 |
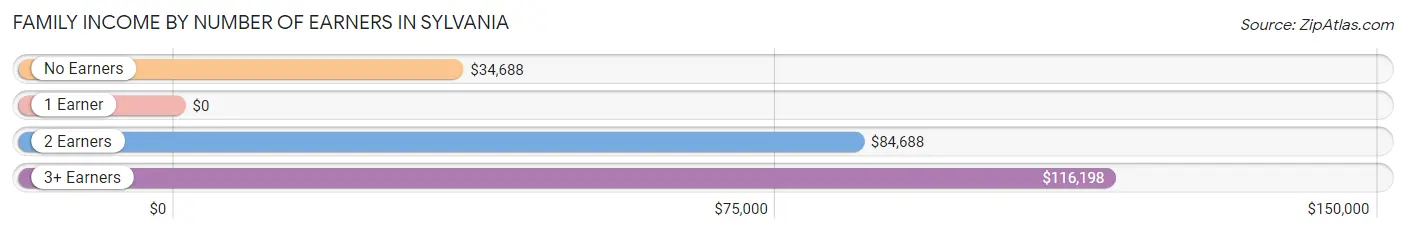
Family Income by Number of Earners in Sylvania
| Number of Earners | # Families | Median Income |
| No Earners | 49 (9.4%) | $34,688 |
| 1 Earner | 225 (43.3%) | $0 |
| 2 Earners | 180 (34.7%) | $84,688 |
| 3+ Earners | 65 (12.5%) | $116,198 |
| Total | 519 (100.0%) | $59,750 |
Household Income in Sylvania
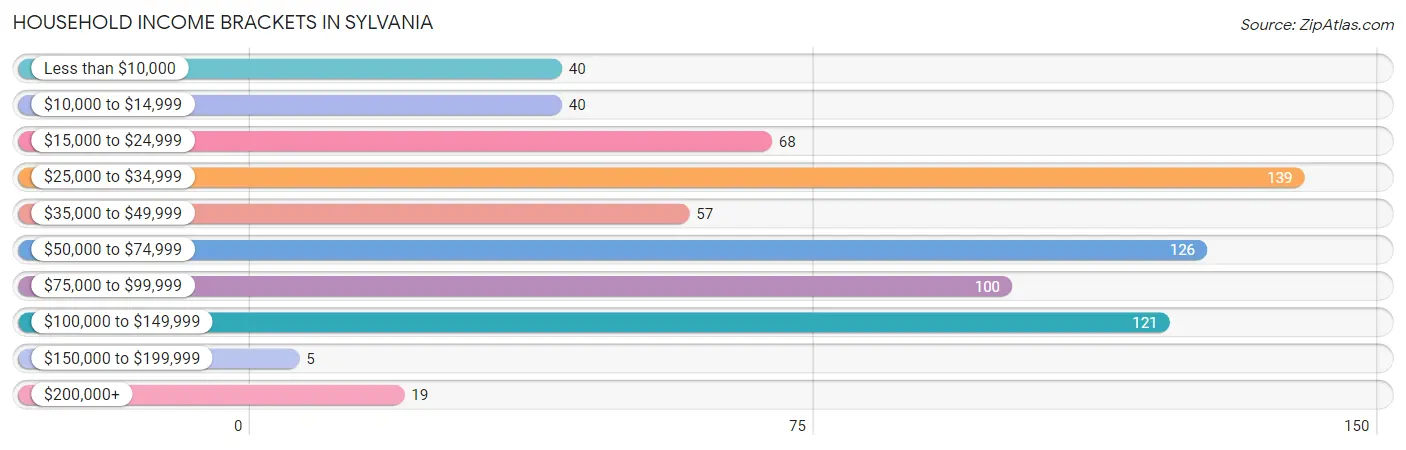
Household Income Brackets in Sylvania
With 139 households falling in the category, the $25,000 to $34,999 income range is the most frequent in Sylvania, accounting for 19.4% of all households. In contrast, only 5 households (0.7%) fall into the $150,000 to $199,999 income bracket, making it the least populous group.
| Income Bracket | # Households | % Households |
| Less than $10,000 | 40 | 5.6% |
| $10,000 to $14,999 | 40 | 5.6% |
| $15,000 to $24,999 | 68 | 9.5% |
| $25,000 to $34,999 | 139 | 19.4% |
| $35,000 to $49,999 | 57 | 8.0% |
| $50,000 to $74,999 | 126 | 17.6% |
| $75,000 to $99,999 | 100 | 14.0% |
| $100,000 to $149,999 | 121 | 16.9% |
| $150,000 to $199,999 | 5 | 0.7% |
| $200,000+ | 19 | 2.7% |
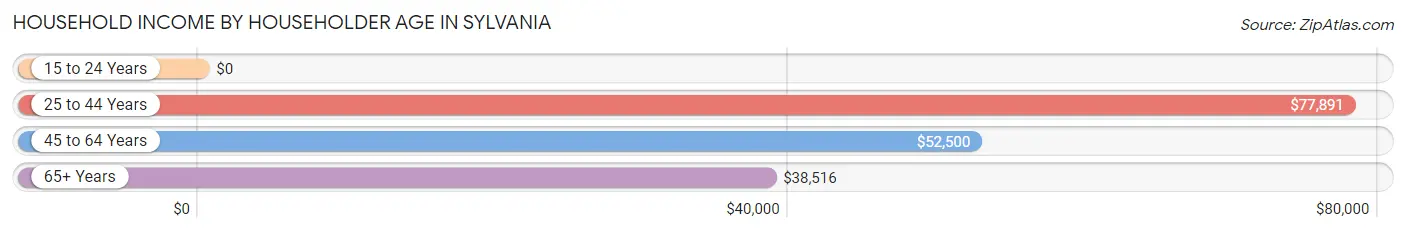
Household Income by Householder Age in Sylvania
The median household income in Sylvania is $50,993, with the highest median household income of $77,891 found in the 25 to 44 years age bracket for the primary householder. A total of 279 households (39.0%) fall into this category. Meanwhile, the 15 to 24 years age bracket for the primary householder has the lowest median household income of $0, with 27 households (3.8%) in this group.
| Income Bracket | # Households | Median Income |
| 15 to 24 Years | 27 (3.8%) | $0 |
| 25 to 44 Years | 279 (39.0%) | $77,891 |
| 45 to 64 Years | 214 (29.9%) | $52,500 |
| 65+ Years | 195 (27.3%) | $38,516 |
| Total | 715 (100.0%) | $50,993 |
Poverty in Sylvania
Income Below Poverty by Sex and Age in Sylvania
With 11.2% poverty level for males and 14.1% for females among the residents of Sylvania, under 5 year old males and under 5 year old females are the most vulnerable to poverty, with 14 males (32.6%) and 27 females (71.1%) in their respective age groups living below the poverty level.
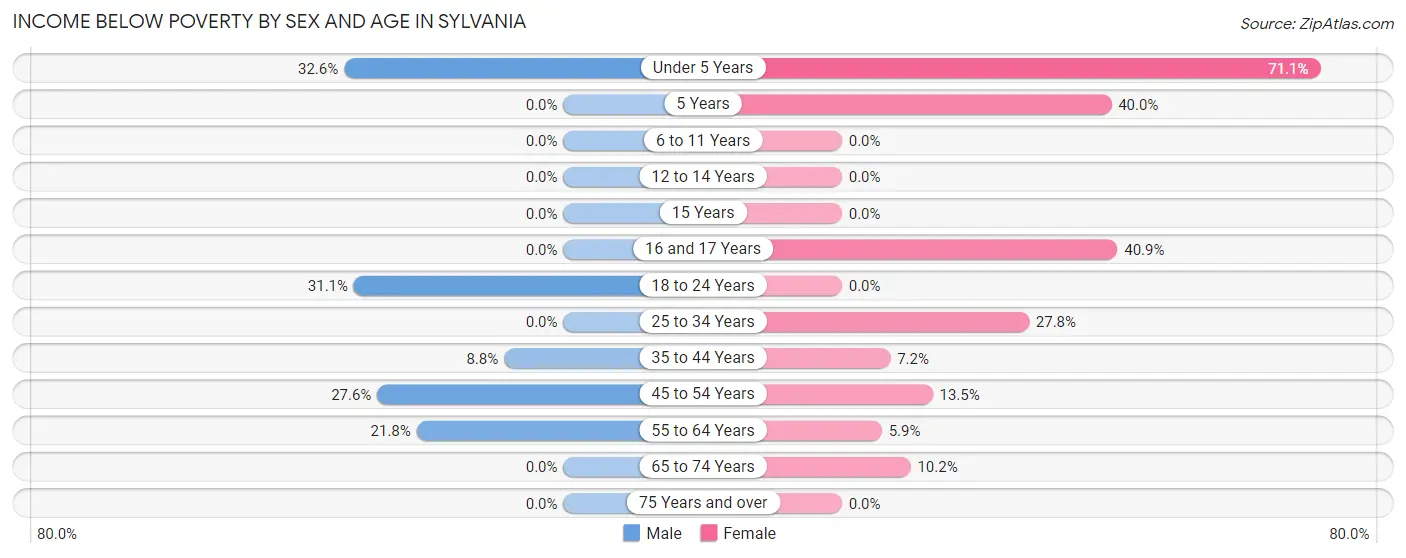
| Age Bracket | Male | Female |
| Under 5 Years | 14 (32.6%) | 27 (71.1%) |
| 5 Years | 0 (0.0%) | 14 (40.0%) |
| 6 to 11 Years | 0 (0.0%) | 0 (0.0%) |
| 12 to 14 Years | 0 (0.0%) | 0 (0.0%) |
| 15 Years | 0 (0.0%) | 0 (0.0%) |
| 16 and 17 Years | 0 (0.0%) | 18 (40.9%) |
| 18 to 24 Years | 14 (31.1%) | 0 (0.0%) |
| 25 to 34 Years | 0 (0.0%) | 60 (27.8%) |
| 35 to 44 Years | 14 (8.8%) | 12 (7.2%) |
| 45 to 54 Years | 34 (27.6%) | 12 (13.5%) |
| 55 to 64 Years | 17 (21.8%) | 8 (5.9%) |
| 65 to 74 Years | 0 (0.0%) | 10 (10.2%) |
| 75 Years and over | 0 (0.0%) | 0 (0.0%) |
| Total | 93 (11.2%) | 161 (14.1%) |
Income Above Poverty by Sex and Age in Sylvania
According to the poverty statistics in Sylvania, males aged 5 years and females aged 6 to 11 years are the age groups that are most secure financially, with 100.0% of males and 100.0% of females in these age groups living above the poverty line.
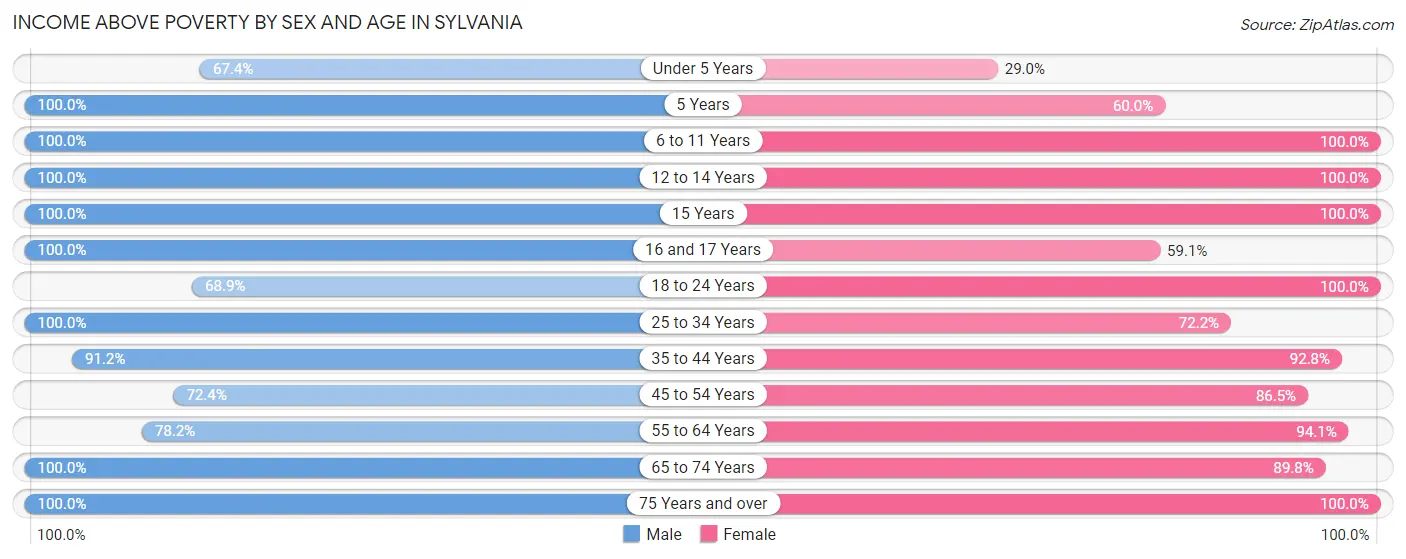
| Age Bracket | Male | Female |
| Under 5 Years | 29 (67.4%) | 11 (28.9%) |
| 5 Years | 35 (100.0%) | 21 (60.0%) |
| 6 to 11 Years | 49 (100.0%) | 170 (100.0%) |
| 12 to 14 Years | 45 (100.0%) | 33 (100.0%) |
| 15 Years | 8 (100.0%) | 5 (100.0%) |
| 16 and 17 Years | 14 (100.0%) | 26 (59.1%) |
| 18 to 24 Years | 31 (68.9%) | 61 (100.0%) |
| 25 to 34 Years | 92 (100.0%) | 156 (72.2%) |
| 35 to 44 Years | 145 (91.2%) | 155 (92.8%) |
| 45 to 54 Years | 89 (72.4%) | 77 (86.5%) |
| 55 to 64 Years | 61 (78.2%) | 127 (94.1%) |
| 65 to 74 Years | 88 (100.0%) | 88 (89.8%) |
| 75 Years and over | 52 (100.0%) | 49 (100.0%) |
| Total | 738 (88.8%) | 979 (85.9%) |
Income Below Poverty Among Married-Couple Families in Sylvania
The poverty statistics for married-couple families in Sylvania show that 3.6% or 11 of the total 309 families live below the poverty line. Families with 1 or 2 children have the highest poverty rate of 4.0%, comprising of 6 families. On the other hand, families with 3 or 4 children have the lowest poverty rate of 0.0%, which includes 0 families.
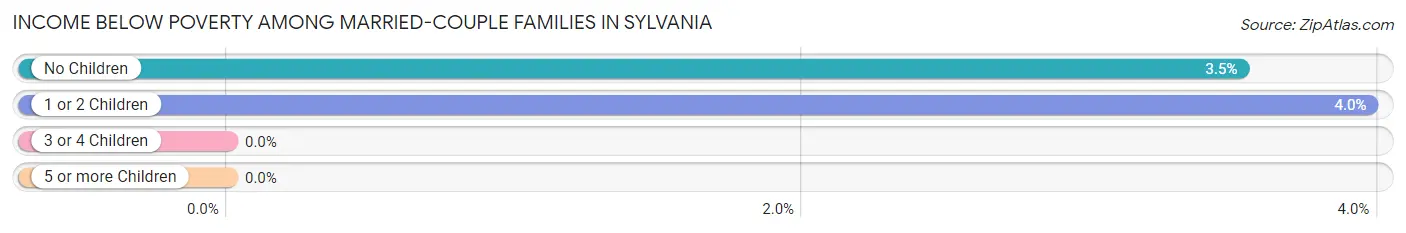
| Children | Above Poverty | Below Poverty |
| No Children | 137 (96.5%) | 5 (3.5%) |
| 1 or 2 Children | 145 (96.0%) | 6 (4.0%) |
| 3 or 4 Children | 16 (100.0%) | 0 (0.0%) |
| 5 or more Children | 0 (0.0%) | 0 (0.0%) |
| Total | 298 (96.4%) | 11 (3.6%) |
Income Below Poverty Among Single-Parent Households in Sylvania
According to the poverty data in Sylvania, 32.1% or 17 single-father households and 14.6% or 23 single-mother households are living below the poverty line. Among single-father households, those with no children have the highest poverty rate, with 8 households (47.1%) experiencing poverty. Likewise, among single-mother households, those with 3 or 4 children have the highest poverty rate, with 12 households (100.0%) falling below the poverty line.
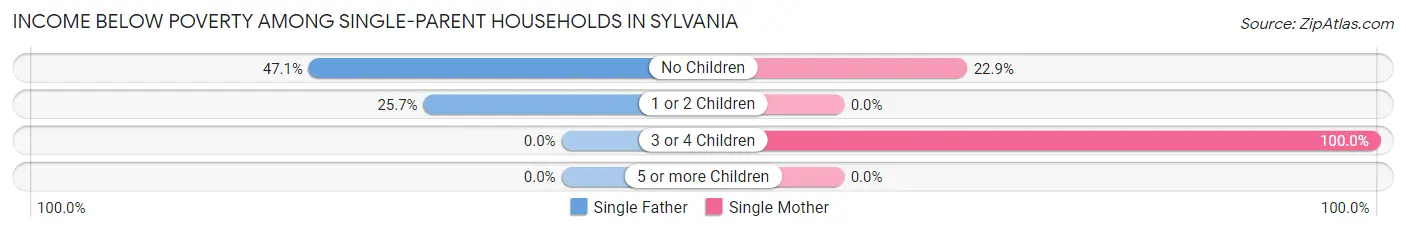
| Children | Single Father | Single Mother |
| No Children | 8 (47.1%) | 11 (22.9%) |
| 1 or 2 Children | 9 (25.7%) | 0 (0.0%) |
| 3 or 4 Children | 0 (0.0%) | 12 (100.0%) |
| 5 or more Children | 0 (0.0%) | 0 (0.0%) |
| Total | 17 (32.1%) | 23 (14.6%) |
Income Below Poverty Among Married-Couple vs Single-Parent Households in Sylvania
The poverty data for Sylvania shows that 11 of the married-couple family households (3.6%) and 40 of the single-parent households (19.1%) are living below the poverty level. Within the married-couple family households, those with 1 or 2 children have the highest poverty rate, with 6 households (4.0%) falling below the poverty line. Among the single-parent households, those with 3 or 4 children have the highest poverty rate, with 12 household (92.3%) living below poverty.
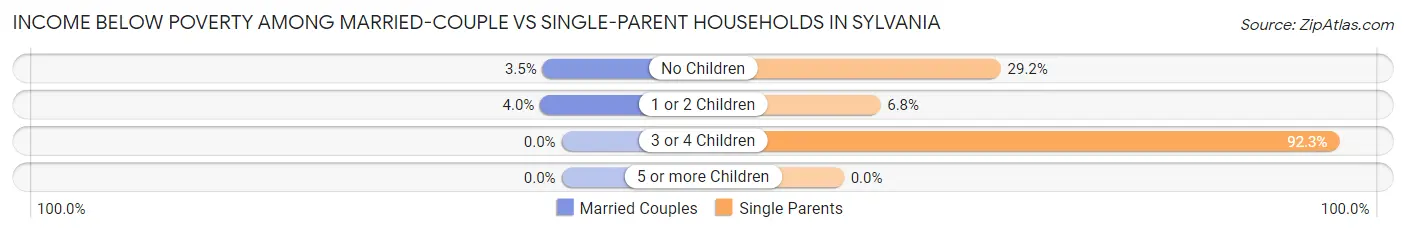
| Children | Married-Couple Families | Single-Parent Households |
| No Children | 5 (3.5%) | 19 (29.2%) |
| 1 or 2 Children | 6 (4.0%) | 9 (6.8%) |
| 3 or 4 Children | 0 (0.0%) | 12 (92.3%) |
| 5 or more Children | 0 (0.0%) | 0 (0.0%) |
| Total | 11 (3.6%) | 40 (19.1%) |
Employment Characteristics in Sylvania
Employment by Class of Employer in Sylvania
Among the 959 employed individuals in Sylvania, private company employees (782 | 81.5%), self-employed (not incorporated) (50 | 5.2%), and local government employees (46 | 4.8%) make up the most common classes of employment.
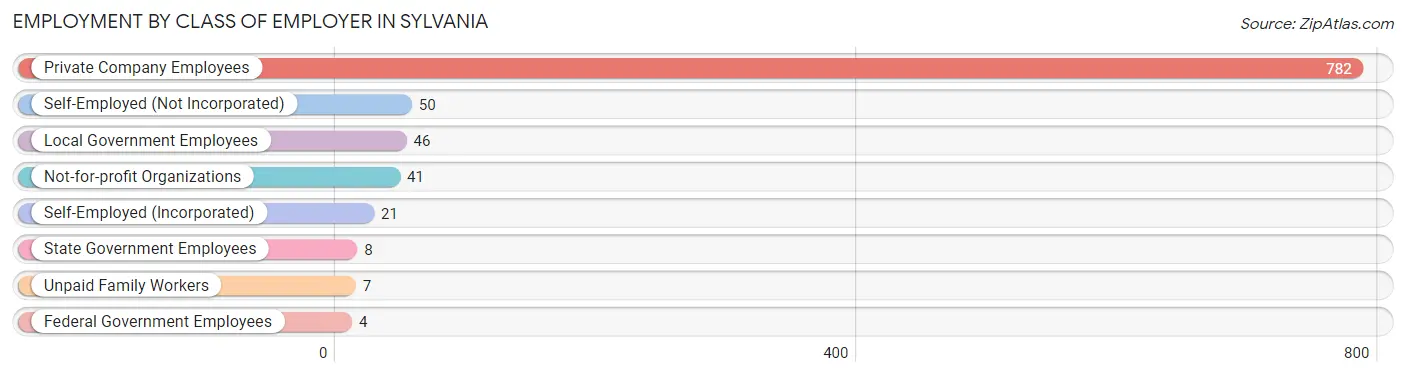
| Employer Class | # Employees | % Employees |
| Private Company Employees | 782 | 81.5% |
| Self-Employed (Incorporated) | 21 | 2.2% |
| Self-Employed (Not Incorporated) | 50 | 5.2% |
| Not-for-profit Organizations | 41 | 4.3% |
| Local Government Employees | 46 | 4.8% |
| State Government Employees | 8 | 0.8% |
| Federal Government Employees | 4 | 0.4% |
| Unpaid Family Workers | 7 | 0.7% |
| Total | 959 | 100.0% |
Employment Status by Age in Sylvania
According to the labor force statistics for Sylvania, out of the total population over 16 years of age (1,510), 66.2% or 1,000 individuals are in the labor force, with 3.4% or 34 of them unemployed. The age group with the highest labor force participation rate is 35 to 44 years, with 95.7% or 312 individuals in the labor force. Within the labor force, the 65 to 74 years age range has the highest percentage of unemployed individuals, with 15.6% or 5 of them being unemployed.
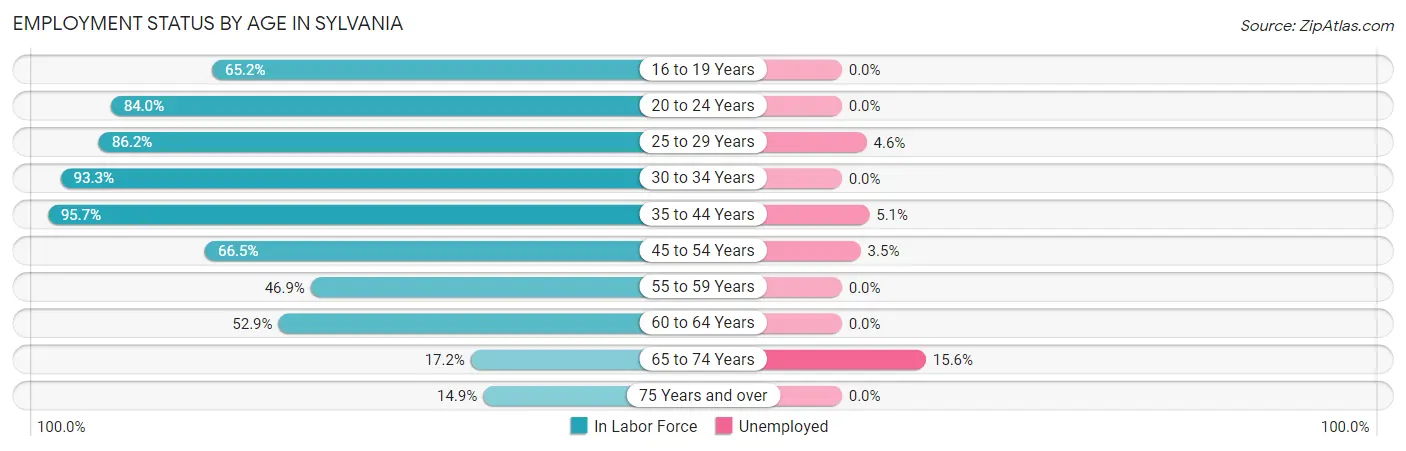
| Age Bracket | In Labor Force | Unemployed |
| 16 to 19 Years | 58 (65.2%) | 0 (0.0%) |
| 20 to 24 Years | 63 (84.0%) | 0 (0.0%) |
| 25 to 29 Years | 175 (86.2%) | 8 (4.6%) |
| 30 to 34 Years | 98 (93.3%) | 0 (0.0%) |
| 35 to 44 Years | 312 (95.7%) | 16 (5.1%) |
| 45 to 54 Years | 141 (66.5%) | 5 (3.5%) |
| 55 to 59 Years | 60 (46.9%) | 0 (0.0%) |
| 60 to 64 Years | 45 (52.9%) | 0 (0.0%) |
| 65 to 74 Years | 32 (17.2%) | 5 (15.6%) |
| 75 Years and over | 15 (14.9%) | 0 (0.0%) |
| Total | 1,000 (66.2%) | 34 (3.4%) |
Employment Status by Educational Attainment in Sylvania
According to labor force statistics for Sylvania, 78.5% of individuals (831) out of the total population between 25 and 64 years of age (1,059) are in the labor force, with 3.5% or 29 of them being unemployed. The group with the highest labor force participation rate are those with the educational attainment of bachelor's degree or higher, with 95.8% or 204 individuals in the labor force. Within the labor force, individuals with high school diploma education have the highest percentage of unemployment, with 5.0% or 14 of them being unemployed.
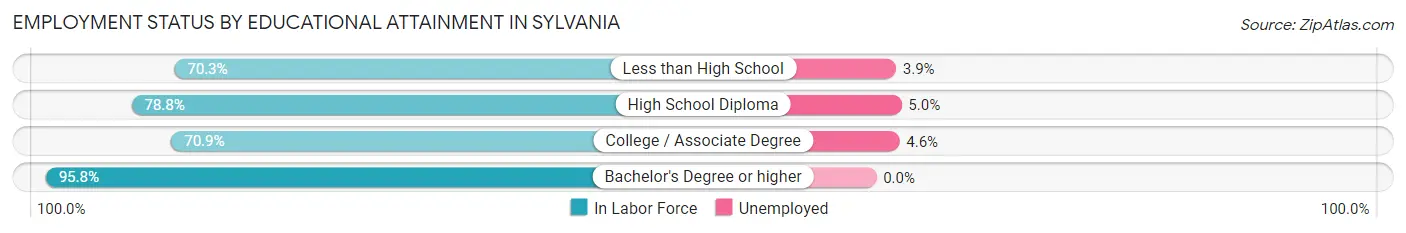
| Educational Attainment | In Labor Force | Unemployed |
| Less than High School | 128 (70.3%) | 7 (3.9%) |
| High School Diploma | 282 (78.8%) | 18 (5.0%) |
| College / Associate Degree | 217 (70.9%) | 14 (4.6%) |
| Bachelor's Degree or higher | 204 (95.8%) | 0 (0.0%) |
| Total | 831 (78.5%) | 37 (3.5%) |
Employment Occupations by Sex in Sylvania
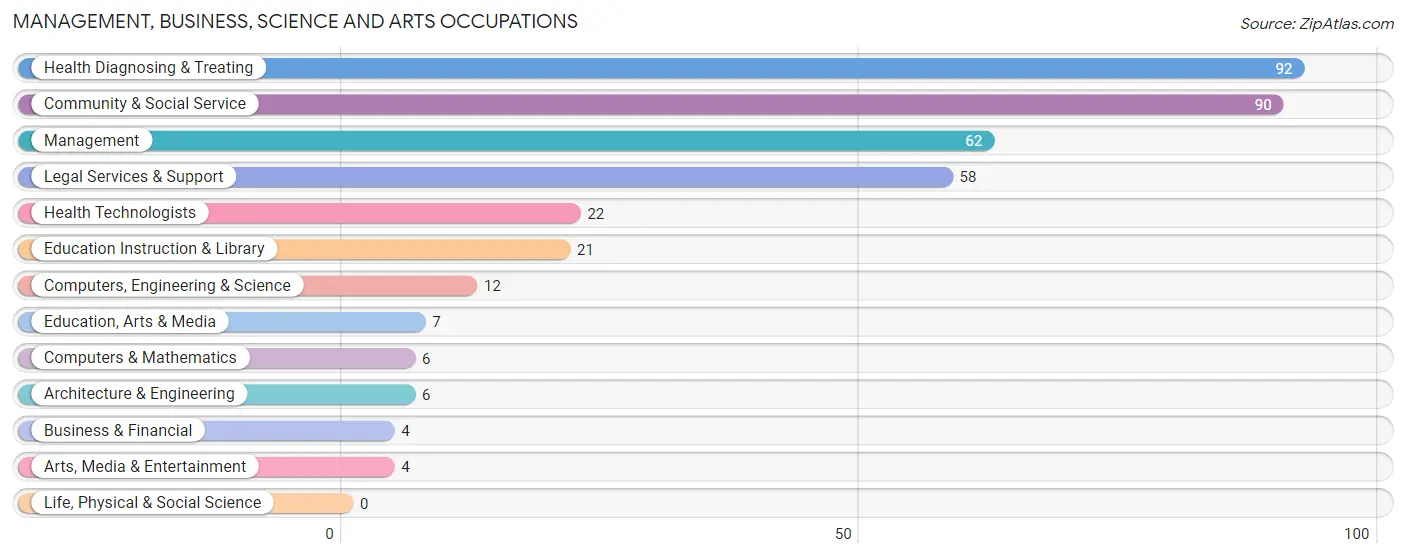
Management, Business, Science and Arts Occupations
The most common Management, Business, Science and Arts occupations in Sylvania are Health Diagnosing & Treating (92 | 9.5%), Community & Social Service (90 | 9.3%), Management (62 | 6.4%), Legal Services & Support (58 | 6.0%), and Health Technologists (22 | 2.3%).
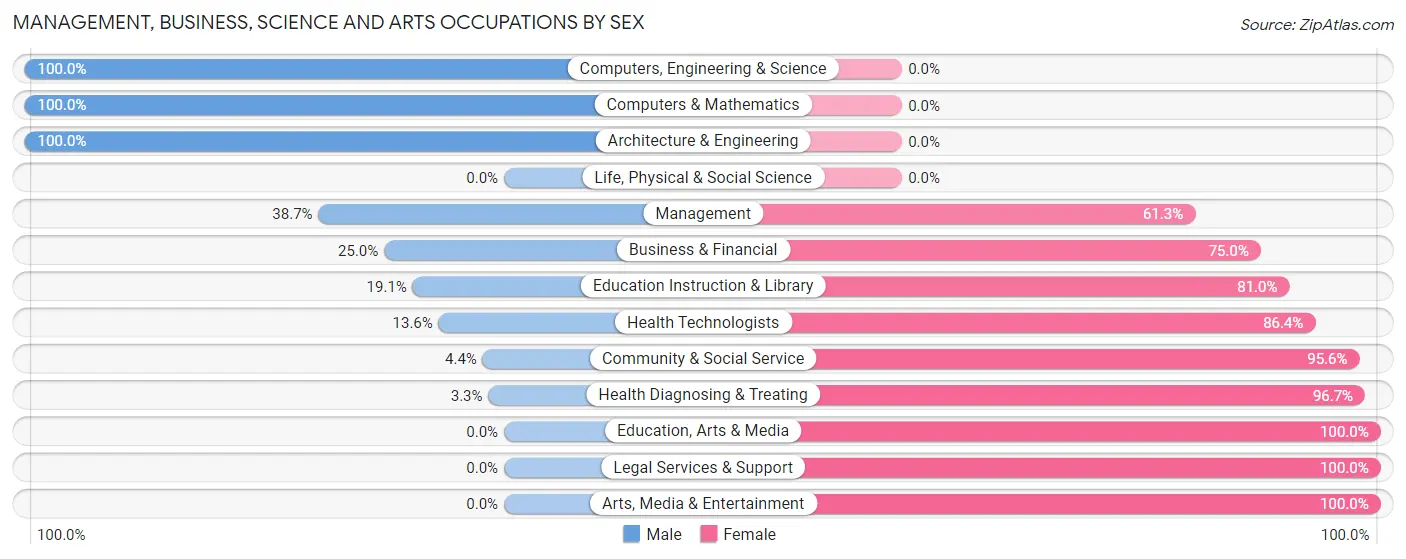
Management, Business, Science and Arts Occupations by Sex
Within the Management, Business, Science and Arts occupations in Sylvania, the most male-oriented occupations are Computers, Engineering & Science (100.0%), Computers & Mathematics (100.0%), and Architecture & Engineering (100.0%), while the most female-oriented occupations are Education, Arts & Media (100.0%), Legal Services & Support (100.0%), and Arts, Media & Entertainment (100.0%).
| Occupation | Male | Female |
| Management | 24 (38.7%) | 38 (61.3%) |
| Business & Financial | 1 (25.0%) | 3 (75.0%) |
| Computers, Engineering & Science | 12 (100.0%) | 0 (0.0%) |
| Computers & Mathematics | 6 (100.0%) | 0 (0.0%) |
| Architecture & Engineering | 6 (100.0%) | 0 (0.0%) |
| Life, Physical & Social Science | 0 (0.0%) | 0 (0.0%) |
| Community & Social Service | 4 (4.4%) | 86 (95.6%) |
| Education, Arts & Media | 0 (0.0%) | 7 (100.0%) |
| Legal Services & Support | 0 (0.0%) | 58 (100.0%) |
| Education Instruction & Library | 4 (19.1%) | 17 (80.9%) |
| Arts, Media & Entertainment | 0 (0.0%) | 4 (100.0%) |
| Health Diagnosing & Treating | 3 (3.3%) | 89 (96.7%) |
| Health Technologists | 3 (13.6%) | 19 (86.4%) |
| Total (Category) | 44 (16.9%) | 216 (83.1%) |
| Total (Overall) | 415 (43.0%) | 550 (57.0%) |
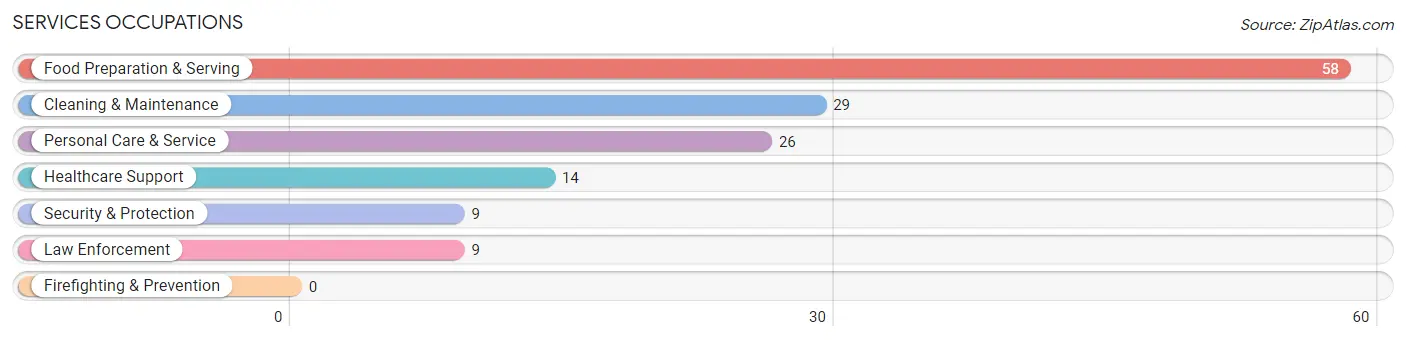
Services Occupations
The most common Services occupations in Sylvania are Food Preparation & Serving (58 | 6.0%), Cleaning & Maintenance (29 | 3.0%), Personal Care & Service (26 | 2.7%), Healthcare Support (14 | 1.5%), and Security & Protection (9 | 0.9%).
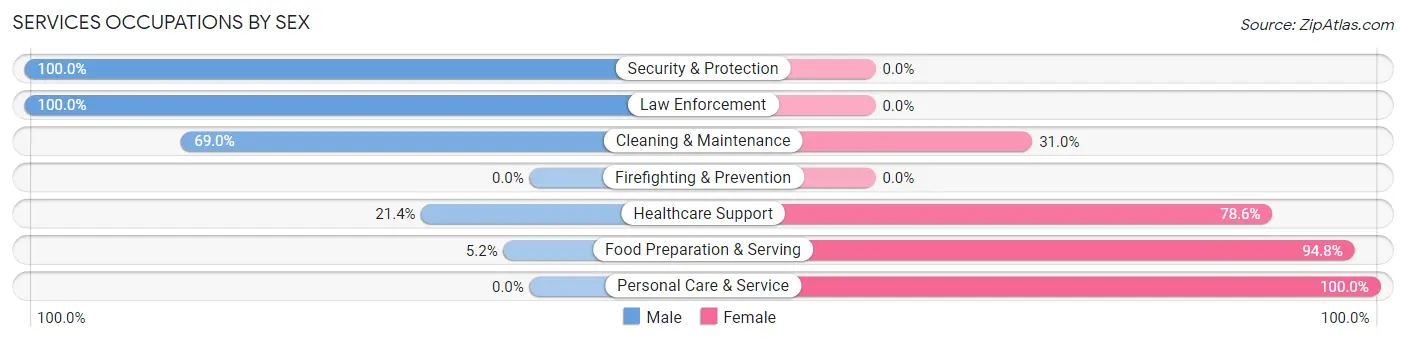
Services Occupations by Sex
Within the Services occupations in Sylvania, the most male-oriented occupations are Security & Protection (100.0%), Law Enforcement (100.0%), and Cleaning & Maintenance (69.0%), while the most female-oriented occupations are Personal Care & Service (100.0%), Food Preparation & Serving (94.8%), and Healthcare Support (78.6%).
| Occupation | Male | Female |
| Healthcare Support | 3 (21.4%) | 11 (78.6%) |
| Security & Protection | 9 (100.0%) | 0 (0.0%) |
| Firefighting & Prevention | 0 (0.0%) | 0 (0.0%) |
| Law Enforcement | 9 (100.0%) | 0 (0.0%) |
| Food Preparation & Serving | 3 (5.2%) | 55 (94.8%) |
| Cleaning & Maintenance | 20 (69.0%) | 9 (31.0%) |
| Personal Care & Service | 0 (0.0%) | 26 (100.0%) |
| Total (Category) | 35 (25.7%) | 101 (74.3%) |
| Total (Overall) | 415 (43.0%) | 550 (57.0%) |
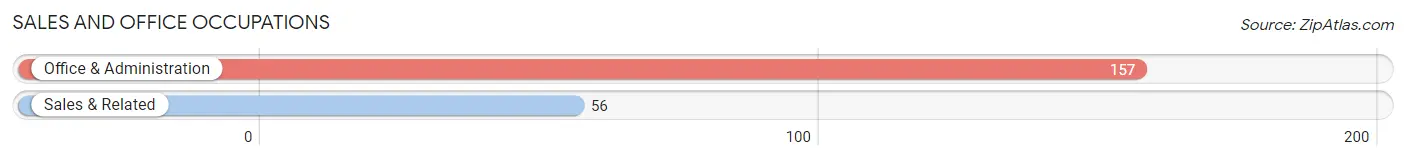
Sales and Office Occupations
The most common Sales and Office occupations in Sylvania are Office & Administration (157 | 16.3%), and Sales & Related (56 | 5.8%).
Sales and Office Occupations by Sex
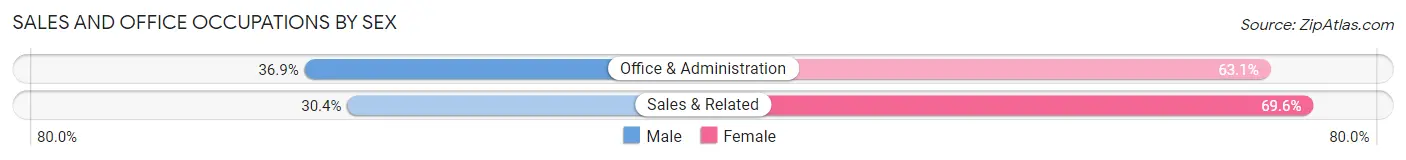
| Occupation | Male | Female |
| Sales & Related | 17 (30.4%) | 39 (69.6%) |
| Office & Administration | 58 (36.9%) | 99 (63.1%) |
| Total (Category) | 75 (35.2%) | 138 (64.8%) |
| Total (Overall) | 415 (43.0%) | 550 (57.0%) |
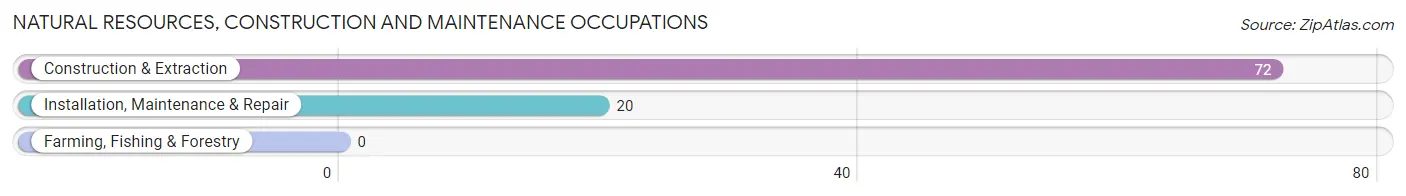
Natural Resources, Construction and Maintenance Occupations
The most common Natural Resources, Construction and Maintenance occupations in Sylvania are Construction & Extraction (72 | 7.5%), and Installation, Maintenance & Repair (20 | 2.1%).
Natural Resources, Construction and Maintenance Occupations by Sex
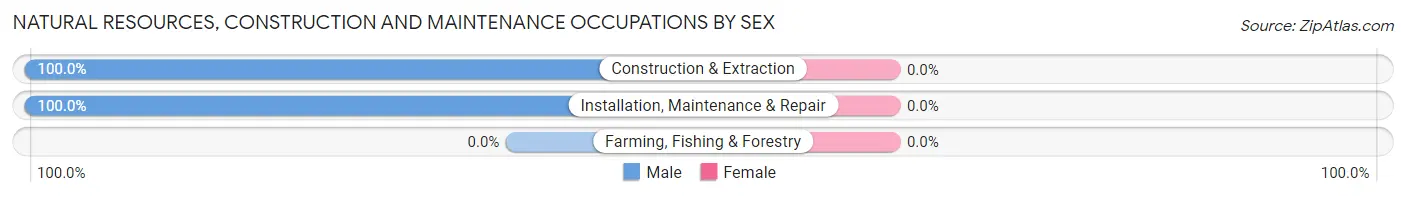
| Occupation | Male | Female |
| Farming, Fishing & Forestry | 0 (0.0%) | 0 (0.0%) |
| Construction & Extraction | 72 (100.0%) | 0 (0.0%) |
| Installation, Maintenance & Repair | 20 (100.0%) | 0 (0.0%) |
| Total (Category) | 92 (100.0%) | 0 (0.0%) |
| Total (Overall) | 415 (43.0%) | 550 (57.0%) |
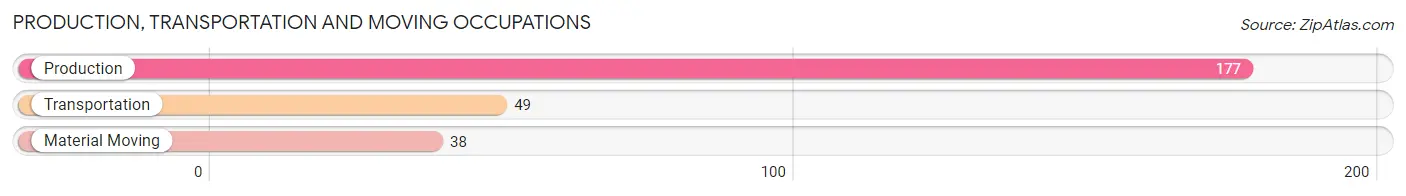
Production, Transportation and Moving Occupations
The most common Production, Transportation and Moving occupations in Sylvania are Production (177 | 18.3%), Transportation (49 | 5.1%), and Material Moving (38 | 3.9%).
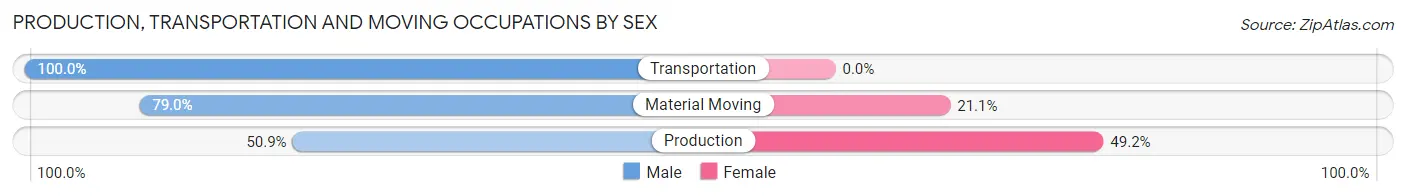
Production, Transportation and Moving Occupations by Sex
| Occupation | Male | Female |
| Production | 90 (50.8%) | 87 (49.1%) |
| Transportation | 49 (100.0%) | 0 (0.0%) |
| Material Moving | 30 (78.9%) | 8 (21.0%) |
| Total (Category) | 169 (64.0%) | 95 (36.0%) |
| Total (Overall) | 415 (43.0%) | 550 (57.0%) |
Employment Industries by Sex in Sylvania
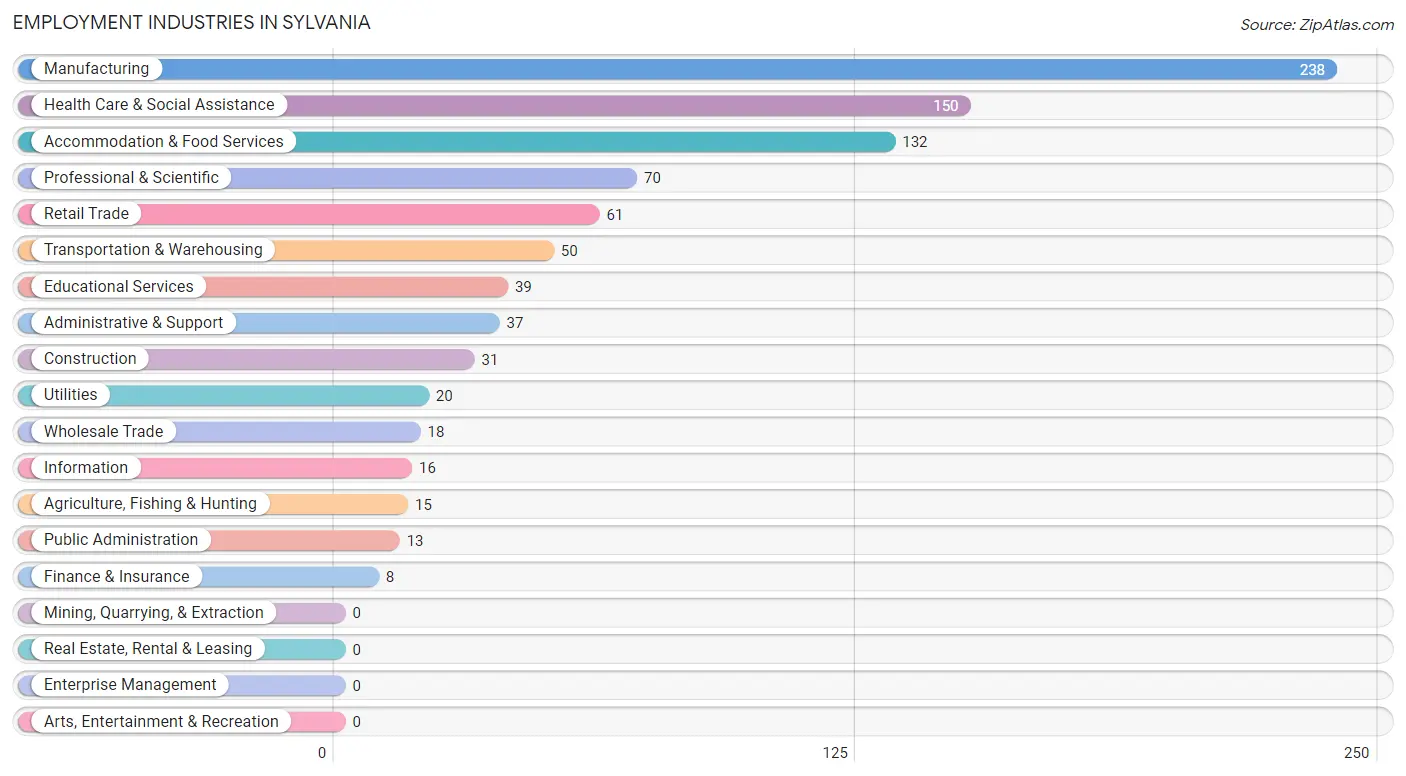
Employment Industries in Sylvania
The major employment industries in Sylvania include Manufacturing (238 | 24.7%), Health Care & Social Assistance (150 | 15.5%), Accommodation & Food Services (132 | 13.7%), Professional & Scientific (70 | 7.2%), and Retail Trade (61 | 6.3%).
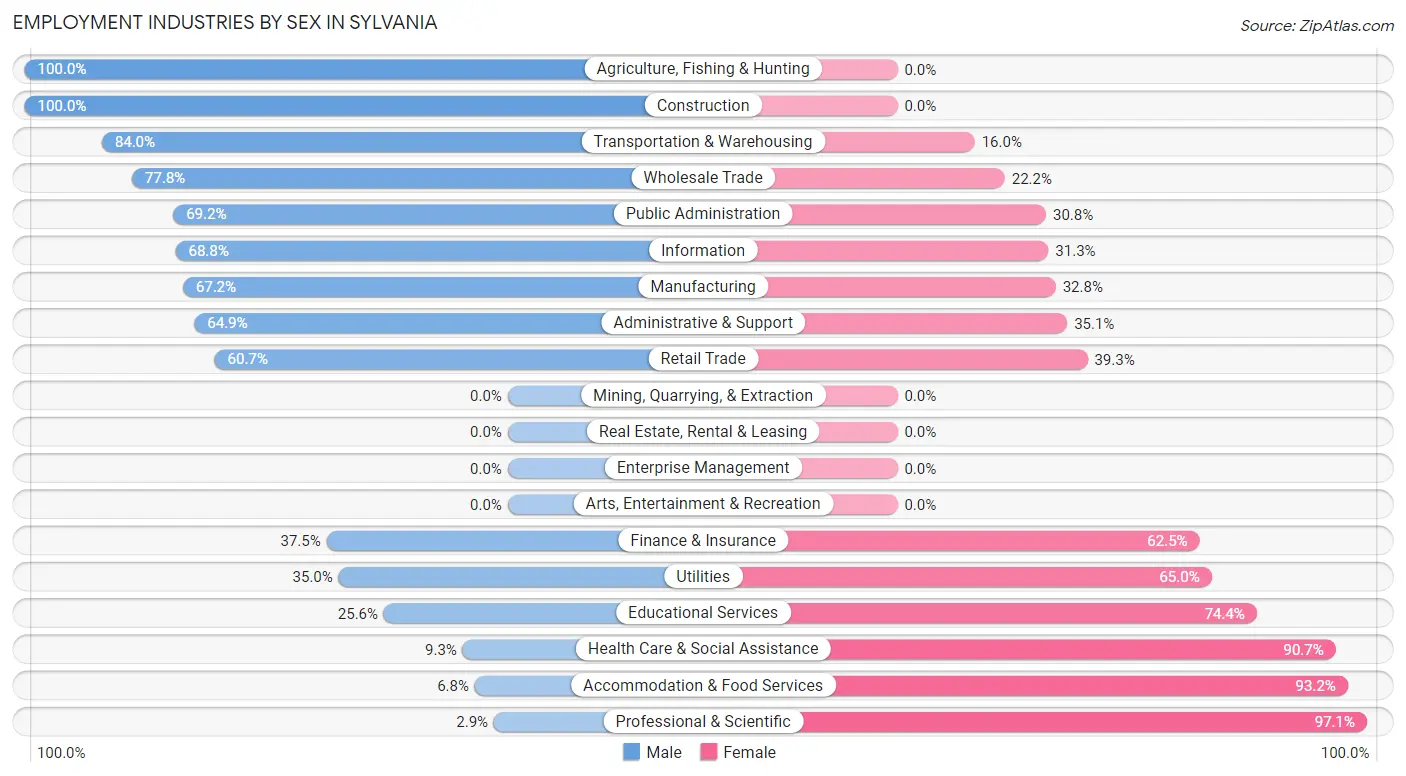
Employment Industries by Sex in Sylvania
The Sylvania industries that see more men than women are Agriculture, Fishing & Hunting (100.0%), Construction (100.0%), and Transportation & Warehousing (84.0%), whereas the industries that tend to have a higher number of women are Professional & Scientific (97.1%), Accommodation & Food Services (93.2%), and Health Care & Social Assistance (90.7%).
| Industry | Male | Female |
| Agriculture, Fishing & Hunting | 15 (100.0%) | 0 (0.0%) |
| Mining, Quarrying, & Extraction | 0 (0.0%) | 0 (0.0%) |
| Construction | 31 (100.0%) | 0 (0.0%) |
| Manufacturing | 160 (67.2%) | 78 (32.8%) |
| Wholesale Trade | 14 (77.8%) | 4 (22.2%) |
| Retail Trade | 37 (60.7%) | 24 (39.3%) |
| Transportation & Warehousing | 42 (84.0%) | 8 (16.0%) |
| Utilities | 7 (35.0%) | 13 (65.0%) |
| Information | 11 (68.8%) | 5 (31.2%) |
| Finance & Insurance | 3 (37.5%) | 5 (62.5%) |
| Real Estate, Rental & Leasing | 0 (0.0%) | 0 (0.0%) |
| Professional & Scientific | 2 (2.9%) | 68 (97.1%) |
| Enterprise Management | 0 (0.0%) | 0 (0.0%) |
| Administrative & Support | 24 (64.9%) | 13 (35.1%) |
| Educational Services | 10 (25.6%) | 29 (74.4%) |
| Health Care & Social Assistance | 14 (9.3%) | 136 (90.7%) |
| Arts, Entertainment & Recreation | 0 (0.0%) | 0 (0.0%) |
| Accommodation & Food Services | 9 (6.8%) | 123 (93.2%) |
| Public Administration | 9 (69.2%) | 4 (30.8%) |
| Total | 415 (43.0%) | 550 (57.0%) |
Education in Sylvania
School Enrollment in Sylvania
The most common levels of schooling among the 462 students in Sylvania are middle school (122 | 26.4%), elementary school (95 | 20.6%), and college / undergraduate (95 | 20.6%).
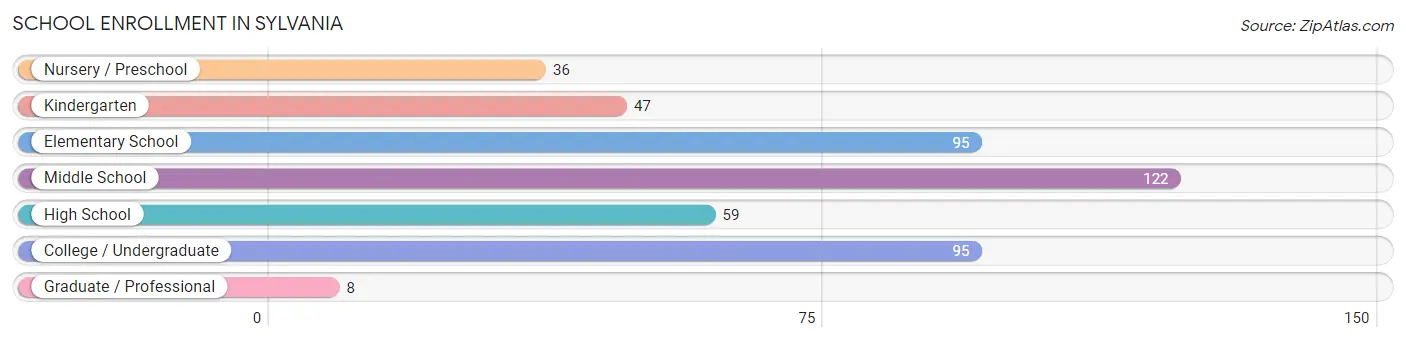
| School Level | # Students | % Students |
| Nursery / Preschool | 36 | 7.8% |
| Kindergarten | 47 | 10.2% |
| Elementary School | 95 | 20.6% |
| Middle School | 122 | 26.4% |
| High School | 59 | 12.8% |
| College / Undergraduate | 95 | 20.6% |
| Graduate / Professional | 8 | 1.7% |
| Total | 462 | 100.0% |
School Enrollment by Age by Funding Source in Sylvania
Out of a total of 462 students who are enrolled in schools in Sylvania, 25 (5.4%) attend a private institution, while the remaining 437 (94.6%) are enrolled in public schools. The age group of 15 to 17 year olds has the highest likelihood of being enrolled in private schools, with 9 (17.0% in the age bracket) enrolled. Conversely, the age group of 3 to 4 year olds has the lowest likelihood of being enrolled in a private school, with 15 (100.0% in the age bracket) attending a public institution.
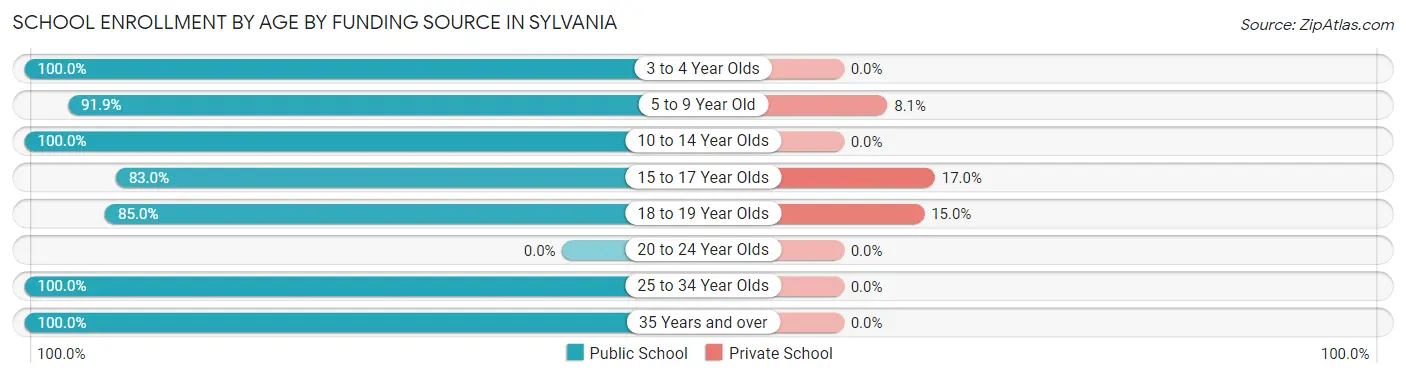
| Age Bracket | Public School | Private School |
| 3 to 4 Year Olds | 15 (100.0%) | 0 (0.0%) |
| 5 to 9 Year Old | 147 (91.9%) | 13 (8.1%) |
| 10 to 14 Year Olds | 131 (100.0%) | 0 (0.0%) |
| 15 to 17 Year Olds | 44 (83.0%) | 9 (17.0%) |
| 18 to 19 Year Olds | 17 (85.0%) | 3 (15.0%) |
| 20 to 24 Year Olds | 0 (0.0%) | 0 (0.0%) |
| 25 to 34 Year Olds | 17 (100.0%) | 0 (0.0%) |
| 35 Years and over | 66 (100.0%) | 0 (0.0%) |
| Total | 437 (94.6%) | 25 (5.4%) |
Educational Attainment by Field of Study in Sylvania
Education (123 | 42.4%), science & technology (47 | 16.2%), literature & languages (22 | 7.6%), social sciences (21 | 7.2%), and business (18 | 6.2%) are the most common fields of study among 290 individuals in Sylvania who have obtained a bachelor's degree or higher.
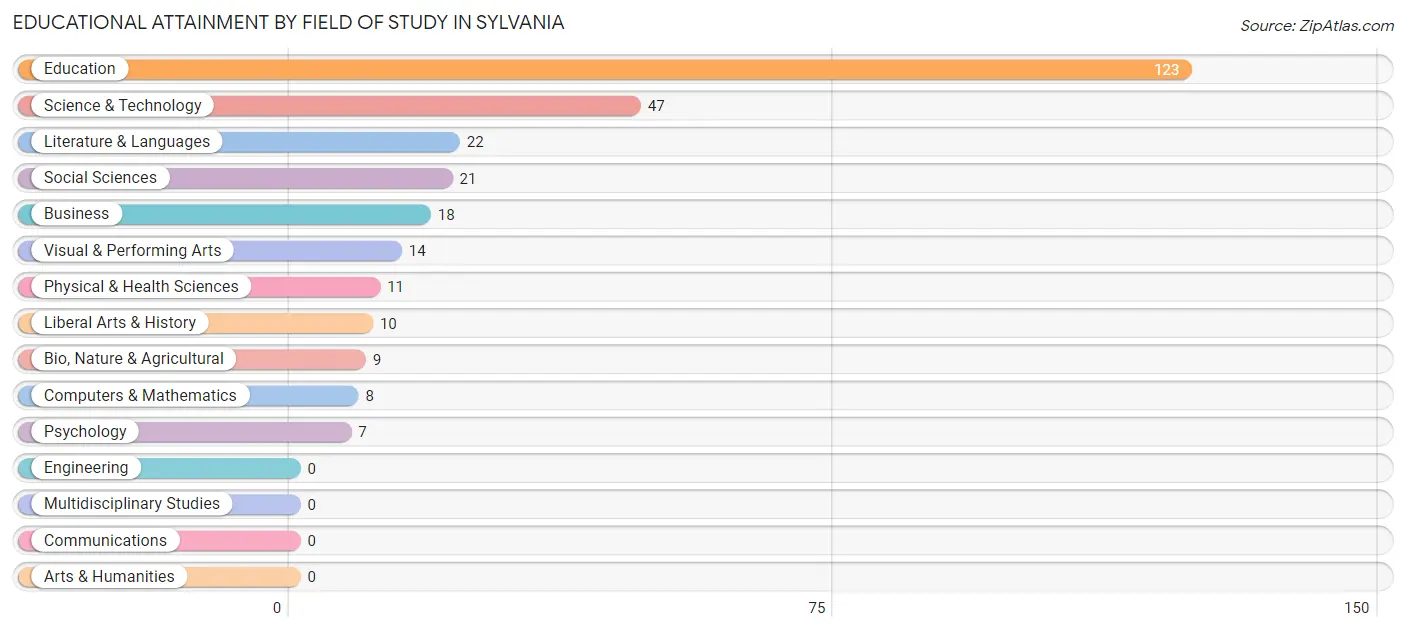
| Field of Study | # Graduates | % Graduates |
| Computers & Mathematics | 8 | 2.8% |
| Bio, Nature & Agricultural | 9 | 3.1% |
| Physical & Health Sciences | 11 | 3.8% |
| Psychology | 7 | 2.4% |
| Social Sciences | 21 | 7.2% |
| Engineering | 0 | 0.0% |
| Multidisciplinary Studies | 0 | 0.0% |
| Science & Technology | 47 | 16.2% |
| Business | 18 | 6.2% |
| Education | 123 | 42.4% |
| Literature & Languages | 22 | 7.6% |
| Liberal Arts & History | 10 | 3.5% |
| Visual & Performing Arts | 14 | 4.8% |
| Communications | 0 | 0.0% |
| Arts & Humanities | 0 | 0.0% |
| Total | 290 | 100.0% |
Transportation & Commute in Sylvania
Vehicle Availability by Sex in Sylvania
The most prevalent vehicle ownership categories in Sylvania are males with 3 vehicles (176, accounting for 43.0%) and females with 3 vehicles (170, making up 32.0%).
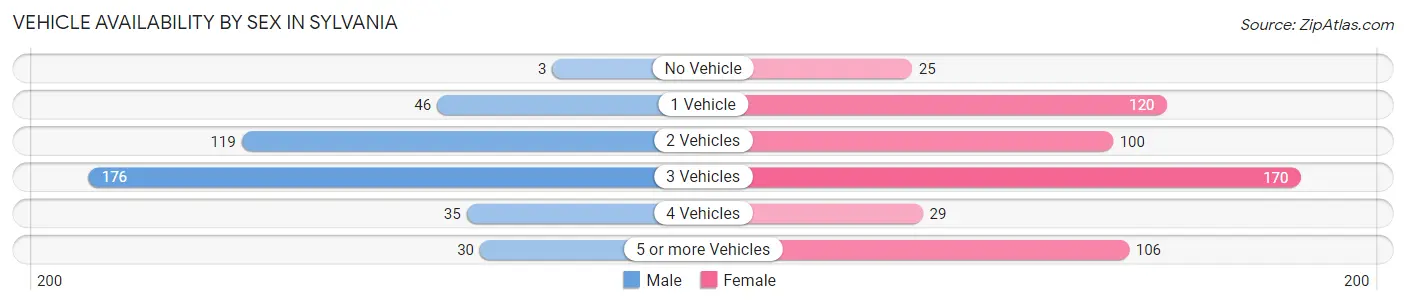
| Vehicles Available | Male | Female |
| No Vehicle | 3 (0.7%) | 25 (4.5%) |
| 1 Vehicle | 46 (11.3%) | 120 (21.8%) |
| 2 Vehicles | 119 (29.1%) | 100 (18.2%) |
| 3 Vehicles | 176 (43.0%) | 170 (30.9%) |
| 4 Vehicles | 35 (8.6%) | 29 (5.3%) |
| 5 or more Vehicles | 30 (7.3%) | 106 (19.3%) |
| Total | 409 (100.0%) | 550 (100.0%) |
Commute Time in Sylvania
The most frequently occuring commute durations in Sylvania are 15 to 19 minutes (222 commuters, 23.4%), 20 to 24 minutes (198 commuters, 20.8%), and 25 to 29 minutes (142 commuters, 14.9%).
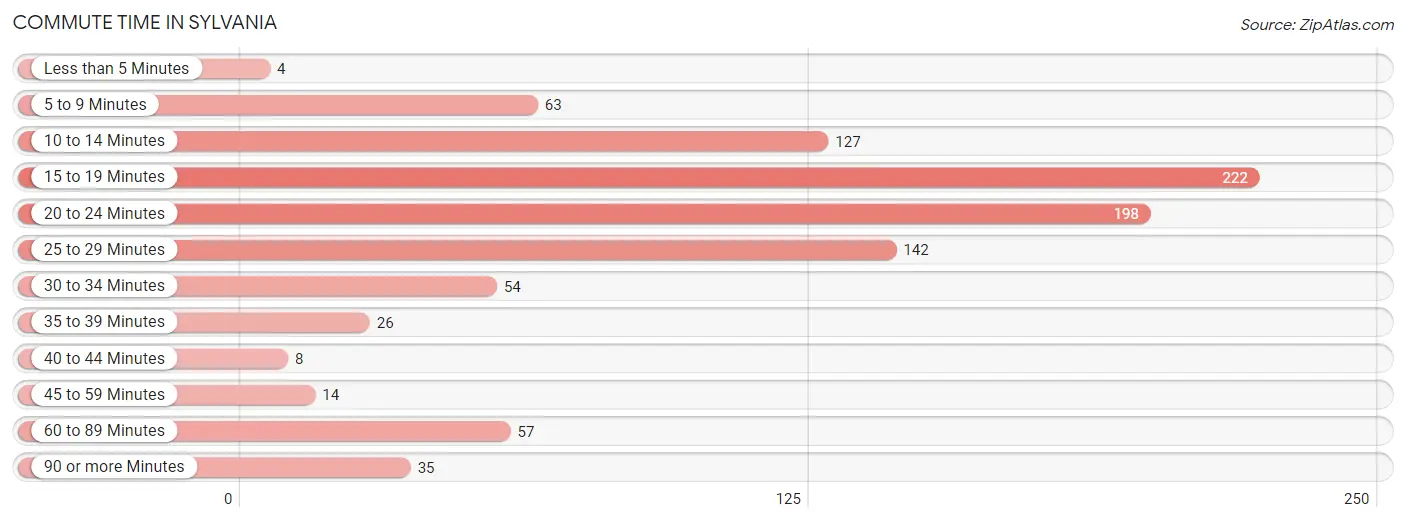
| Commute Time | # Commuters | % Commuters |
| Less than 5 Minutes | 4 | 0.4% |
| 5 to 9 Minutes | 63 | 6.6% |
| 10 to 14 Minutes | 127 | 13.4% |
| 15 to 19 Minutes | 222 | 23.4% |
| 20 to 24 Minutes | 198 | 20.8% |
| 25 to 29 Minutes | 142 | 14.9% |
| 30 to 34 Minutes | 54 | 5.7% |
| 35 to 39 Minutes | 26 | 2.7% |
| 40 to 44 Minutes | 8 | 0.8% |
| 45 to 59 Minutes | 14 | 1.5% |
| 60 to 89 Minutes | 57 | 6.0% |
| 90 or more Minutes | 35 | 3.7% |
Commute Time by Sex in Sylvania
The most common commute times in Sylvania are 15 to 19 minutes (122 commuters, 30.3%) for males and 25 to 29 minutes (126 commuters, 23.0%) for females.
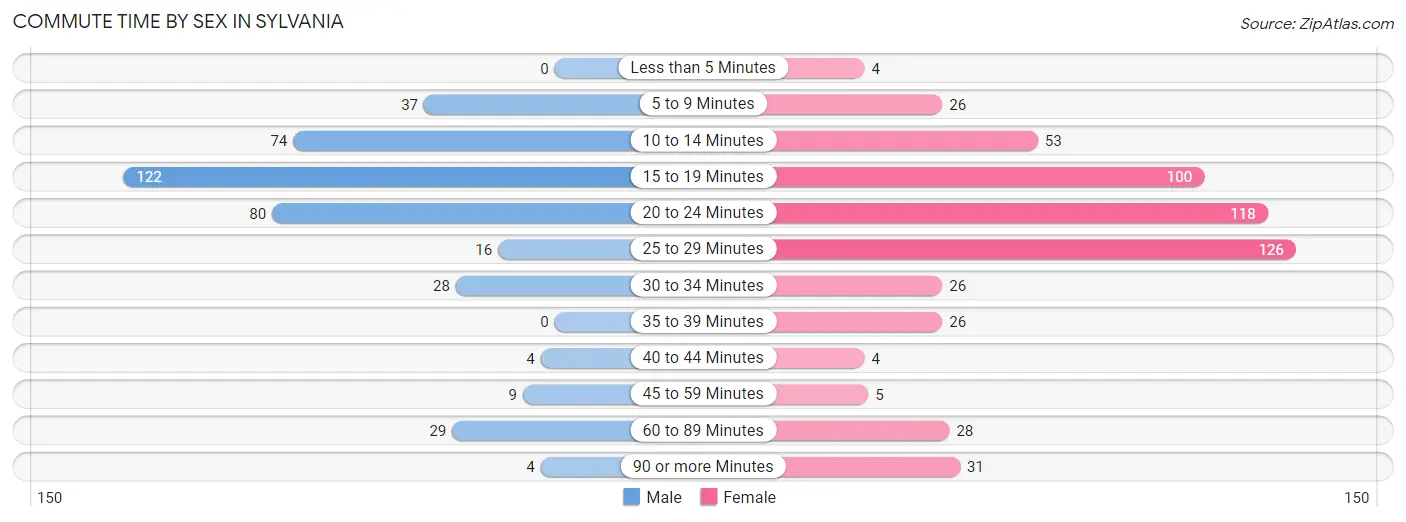
| Commute Time | Male | Female |
| Less than 5 Minutes | 0 (0.0%) | 4 (0.7%) |
| 5 to 9 Minutes | 37 (9.2%) | 26 (4.8%) |
| 10 to 14 Minutes | 74 (18.4%) | 53 (9.7%) |
| 15 to 19 Minutes | 122 (30.3%) | 100 (18.3%) |
| 20 to 24 Minutes | 80 (19.9%) | 118 (21.6%) |
| 25 to 29 Minutes | 16 (4.0%) | 126 (23.0%) |
| 30 to 34 Minutes | 28 (7.0%) | 26 (4.8%) |
| 35 to 39 Minutes | 0 (0.0%) | 26 (4.8%) |
| 40 to 44 Minutes | 4 (1.0%) | 4 (0.7%) |
| 45 to 59 Minutes | 9 (2.2%) | 5 (0.9%) |
| 60 to 89 Minutes | 29 (7.2%) | 28 (5.1%) |
| 90 or more Minutes | 4 (1.0%) | 31 (5.7%) |
Time of Departure to Work by Sex in Sylvania
The most frequent times of departure to work in Sylvania are 4:00 PM to 11:59 PM (59, 14.6%) for males and 7:30 AM to 7:59 AM (142, 26.0%) for females.
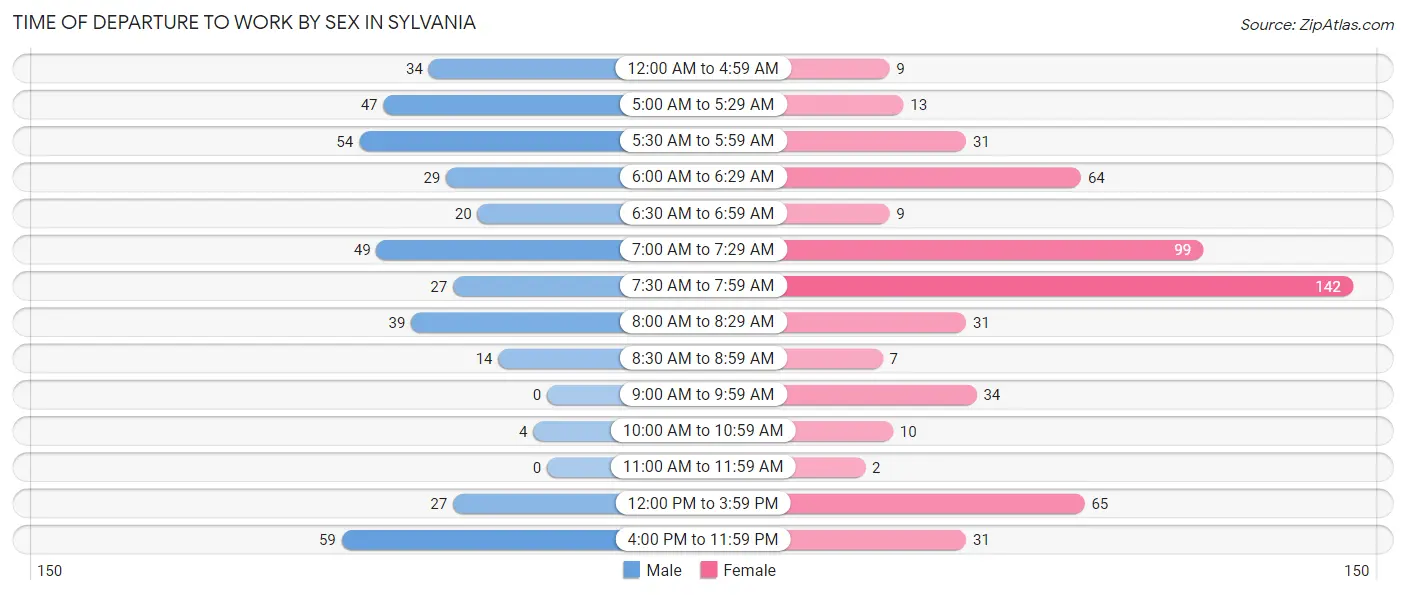
| Time of Departure | Male | Female |
| 12:00 AM to 4:59 AM | 34 (8.4%) | 9 (1.7%) |
| 5:00 AM to 5:29 AM | 47 (11.7%) | 13 (2.4%) |
| 5:30 AM to 5:59 AM | 54 (13.4%) | 31 (5.7%) |
| 6:00 AM to 6:29 AM | 29 (7.2%) | 64 (11.7%) |
| 6:30 AM to 6:59 AM | 20 (5.0%) | 9 (1.7%) |
| 7:00 AM to 7:29 AM | 49 (12.2%) | 99 (18.1%) |
| 7:30 AM to 7:59 AM | 27 (6.7%) | 142 (26.0%) |
| 8:00 AM to 8:29 AM | 39 (9.7%) | 31 (5.7%) |
| 8:30 AM to 8:59 AM | 14 (3.5%) | 7 (1.3%) |
| 9:00 AM to 9:59 AM | 0 (0.0%) | 34 (6.2%) |
| 10:00 AM to 10:59 AM | 4 (1.0%) | 10 (1.8%) |
| 11:00 AM to 11:59 AM | 0 (0.0%) | 2 (0.4%) |
| 12:00 PM to 3:59 PM | 27 (6.7%) | 65 (11.9%) |
| 4:00 PM to 11:59 PM | 59 (14.6%) | 31 (5.7%) |
| Total | 403 (100.0%) | 547 (100.0%) |
Housing Occupancy in Sylvania
Occupancy by Ownership in Sylvania
Of the total 715 dwellings in Sylvania, owner-occupied units account for 480 (67.1%), while renter-occupied units make up 235 (32.9%).
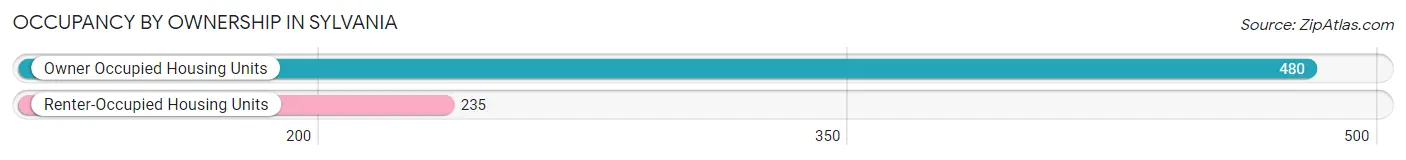
| Occupancy | # Housing Units | % Housing Units |
| Owner Occupied Housing Units | 480 | 67.1% |
| Renter-Occupied Housing Units | 235 | 32.9% |
| Total Occupied Housing Units | 715 | 100.0% |
Occupancy by Household Size in Sylvania
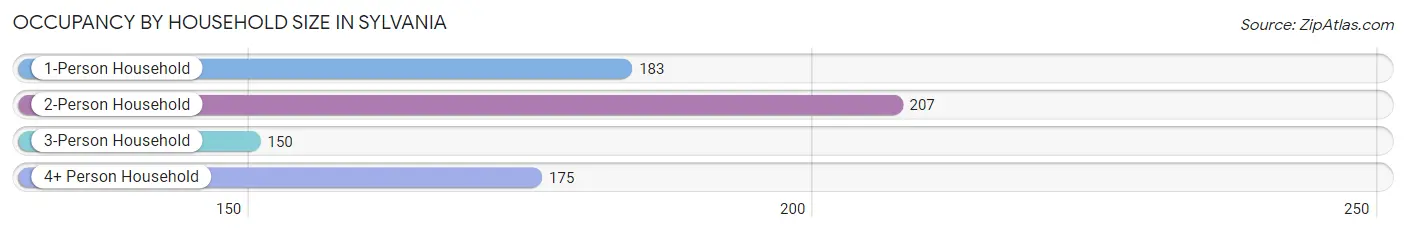
| Household Size | # Housing Units | % Housing Units |
| 1-Person Household | 183 | 25.6% |
| 2-Person Household | 207 | 28.9% |
| 3-Person Household | 150 | 21.0% |
| 4+ Person Household | 175 | 24.5% |
| Total Housing Units | 715 | 100.0% |
Occupancy by Ownership by Household Size in Sylvania
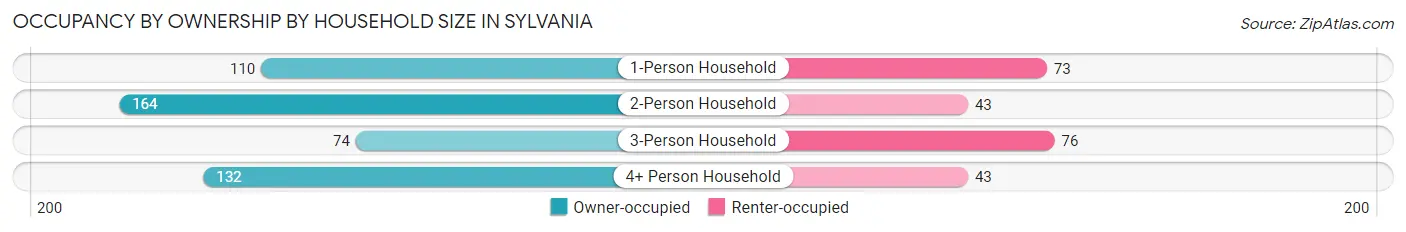
| Household Size | Owner-occupied | Renter-occupied |
| 1-Person Household | 110 (60.1%) | 73 (39.9%) |
| 2-Person Household | 164 (79.2%) | 43 (20.8%) |
| 3-Person Household | 74 (49.3%) | 76 (50.7%) |
| 4+ Person Household | 132 (75.4%) | 43 (24.6%) |
| Total Housing Units | 480 (67.1%) | 235 (32.9%) |
Occupancy by Educational Attainment in Sylvania
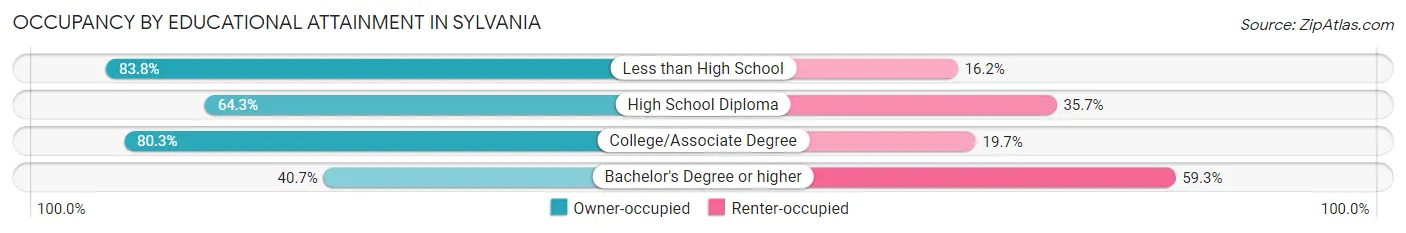
| Household Size | Owner-occupied | Renter-occupied |
| Less than High School | 83 (83.8%) | 16 (16.2%) |
| High School Diploma | 169 (64.3%) | 94 (35.7%) |
| College/Associate Degree | 171 (80.3%) | 42 (19.7%) |
| Bachelor's Degree or higher | 57 (40.7%) | 83 (59.3%) |
Occupancy by Age of Householder in Sylvania
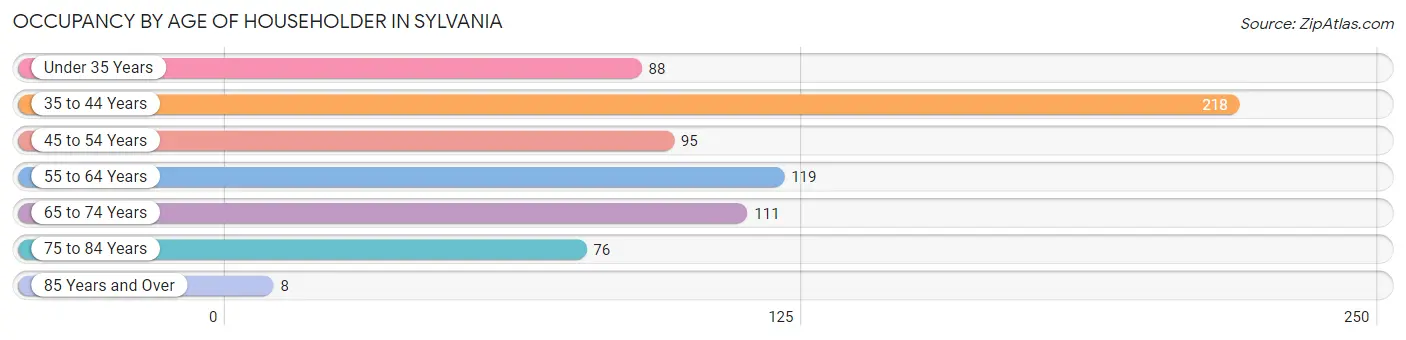
| Age Bracket | # Households | % Households |
| Under 35 Years | 88 | 12.3% |
| 35 to 44 Years | 218 | 30.5% |
| 45 to 54 Years | 95 | 13.3% |
| 55 to 64 Years | 119 | 16.6% |
| 65 to 74 Years | 111 | 15.5% |
| 75 to 84 Years | 76 | 10.6% |
| 85 Years and Over | 8 | 1.1% |
| Total | 715 | 100.0% |
Housing Finances in Sylvania
Median Income by Occupancy in Sylvania
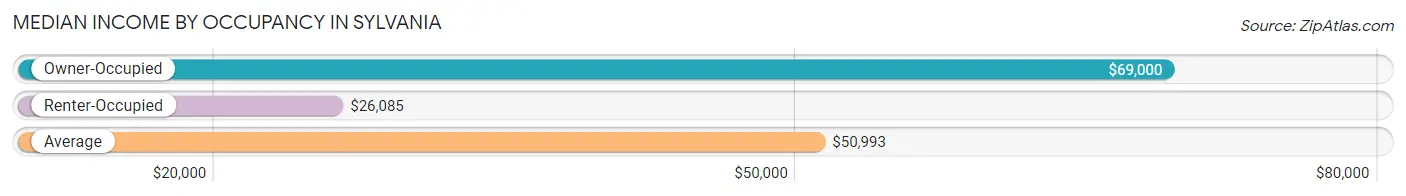
| Occupancy Type | # Households | Median Income |
| Owner-Occupied | 480 (67.1%) | $69,000 |
| Renter-Occupied | 235 (32.9%) | $26,085 |
| Average | 715 (100.0%) | $50,993 |
Occupancy by Householder Income Bracket in Sylvania
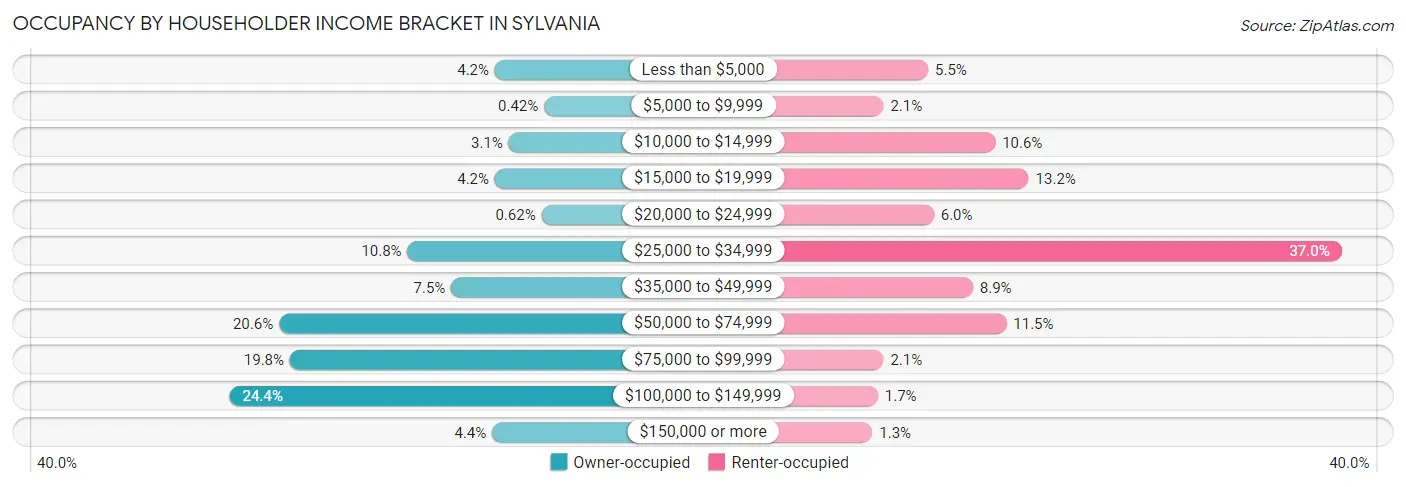
| Income Bracket | Owner-occupied | Renter-occupied |
| Less than $5,000 | 20 (4.2%) | 13 (5.5%) |
| $5,000 to $9,999 | 2 (0.4%) | 5 (2.1%) |
| $10,000 to $14,999 | 15 (3.1%) | 25 (10.6%) |
| $15,000 to $19,999 | 20 (4.2%) | 31 (13.2%) |
| $20,000 to $24,999 | 3 (0.6%) | 14 (6.0%) |
| $25,000 to $34,999 | 52 (10.8%) | 87 (37.0%) |
| $35,000 to $49,999 | 36 (7.5%) | 21 (8.9%) |
| $50,000 to $74,999 | 99 (20.6%) | 27 (11.5%) |
| $75,000 to $99,999 | 95 (19.8%) | 5 (2.1%) |
| $100,000 to $149,999 | 117 (24.4%) | 4 (1.7%) |
| $150,000 or more | 21 (4.4%) | 3 (1.3%) |
| Total | 480 (100.0%) | 235 (100.0%) |
Monthly Housing Cost Tiers in Sylvania
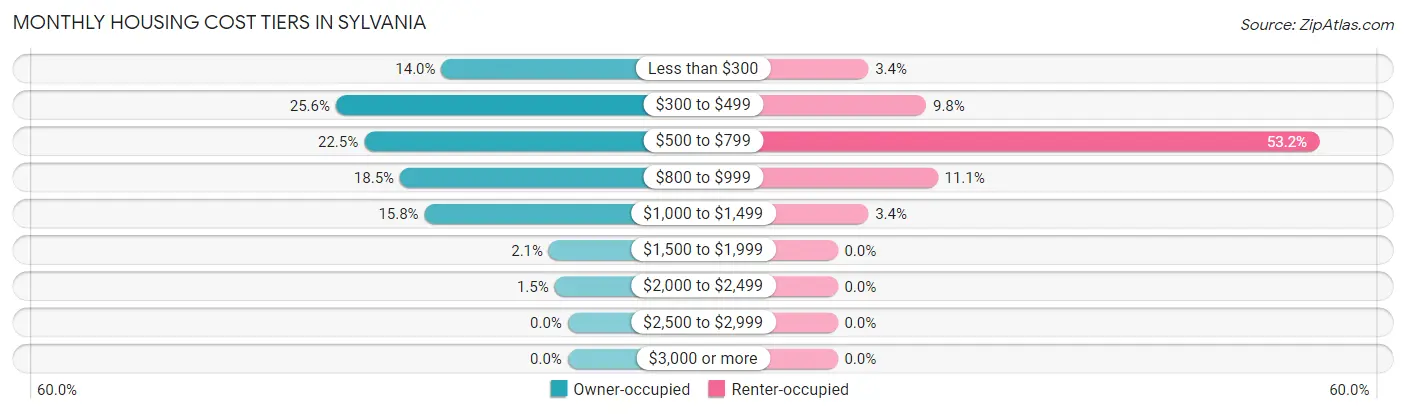
| Monthly Cost | Owner-occupied | Renter-occupied |
| Less than $300 | 67 (14.0%) | 8 (3.4%) |
| $300 to $499 | 123 (25.6%) | 23 (9.8%) |
| $500 to $799 | 108 (22.5%) | 125 (53.2%) |
| $800 to $999 | 89 (18.5%) | 26 (11.1%) |
| $1,000 to $1,499 | 76 (15.8%) | 8 (3.4%) |
| $1,500 to $1,999 | 10 (2.1%) | 0 (0.0%) |
| $2,000 to $2,499 | 7 (1.5%) | 0 (0.0%) |
| $2,500 to $2,999 | 0 (0.0%) | 0 (0.0%) |
| $3,000 or more | 0 (0.0%) | 0 (0.0%) |
| Total | 480 (100.0%) | 235 (100.0%) |
Physical Housing Characteristics in Sylvania
Housing Structures in Sylvania
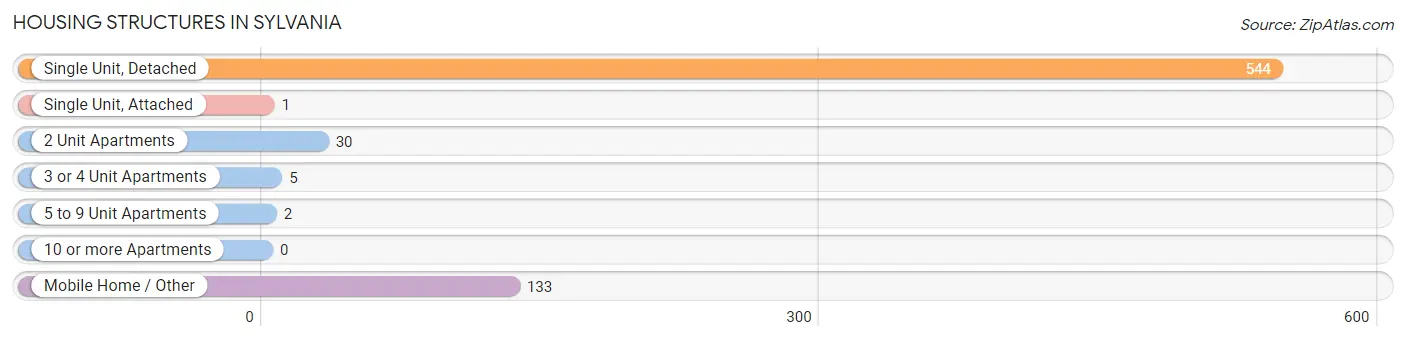
| Structure Type | # Housing Units | % Housing Units |
| Single Unit, Detached | 544 | 76.1% |
| Single Unit, Attached | 1 | 0.1% |
| 2 Unit Apartments | 30 | 4.2% |
| 3 or 4 Unit Apartments | 5 | 0.7% |
| 5 to 9 Unit Apartments | 2 | 0.3% |
| 10 or more Apartments | 0 | 0.0% |
| Mobile Home / Other | 133 | 18.6% |
| Total | 715 | 100.0% |
Housing Structures by Occupancy in Sylvania
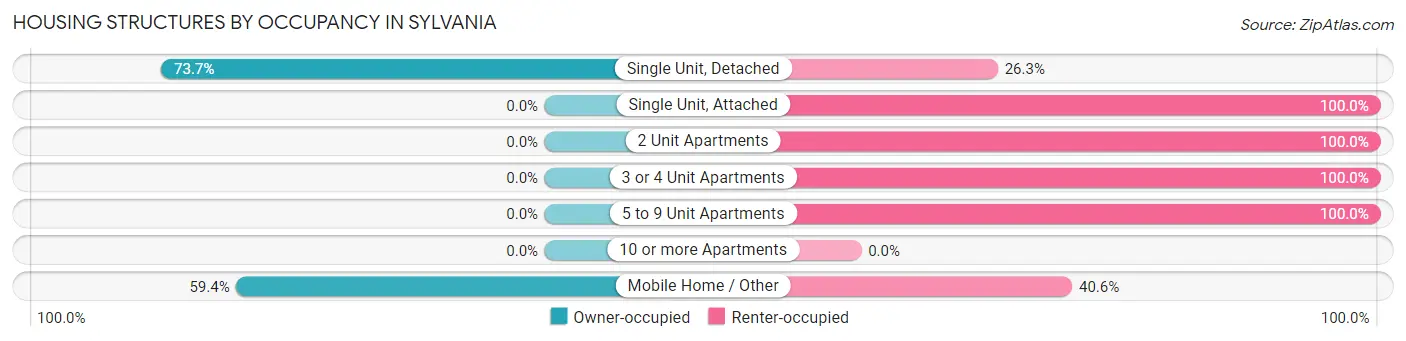
| Structure Type | Owner-occupied | Renter-occupied |
| Single Unit, Detached | 401 (73.7%) | 143 (26.3%) |
| Single Unit, Attached | 0 (0.0%) | 1 (100.0%) |
| 2 Unit Apartments | 0 (0.0%) | 30 (100.0%) |
| 3 or 4 Unit Apartments | 0 (0.0%) | 5 (100.0%) |
| 5 to 9 Unit Apartments | 0 (0.0%) | 2 (100.0%) |
| 10 or more Apartments | 0 (0.0%) | 0 (0.0%) |
| Mobile Home / Other | 79 (59.4%) | 54 (40.6%) |
| Total | 480 (67.1%) | 235 (32.9%) |
Housing Structures by Number of Rooms in Sylvania
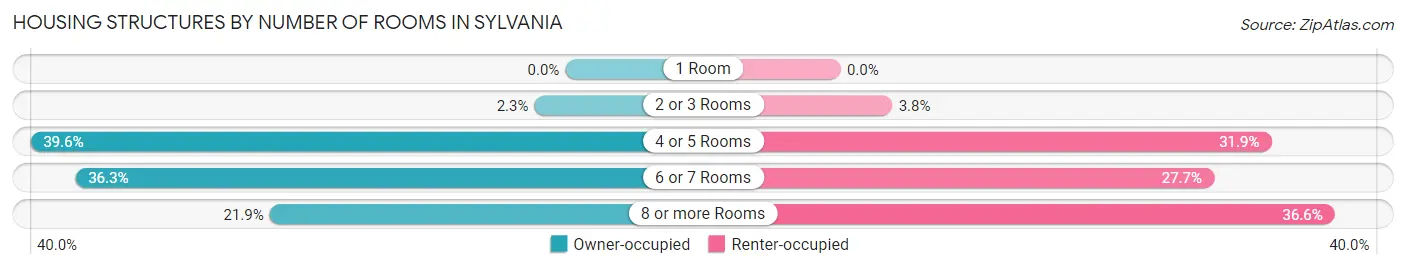
| Number of Rooms | Owner-occupied | Renter-occupied |
| 1 Room | 0 (0.0%) | 0 (0.0%) |
| 2 or 3 Rooms | 11 (2.3%) | 9 (3.8%) |
| 4 or 5 Rooms | 190 (39.6%) | 75 (31.9%) |
| 6 or 7 Rooms | 174 (36.2%) | 65 (27.7%) |
| 8 or more Rooms | 105 (21.9%) | 86 (36.6%) |
| Total | 480 (100.0%) | 235 (100.0%) |
Housing Structure by Heating Type in Sylvania
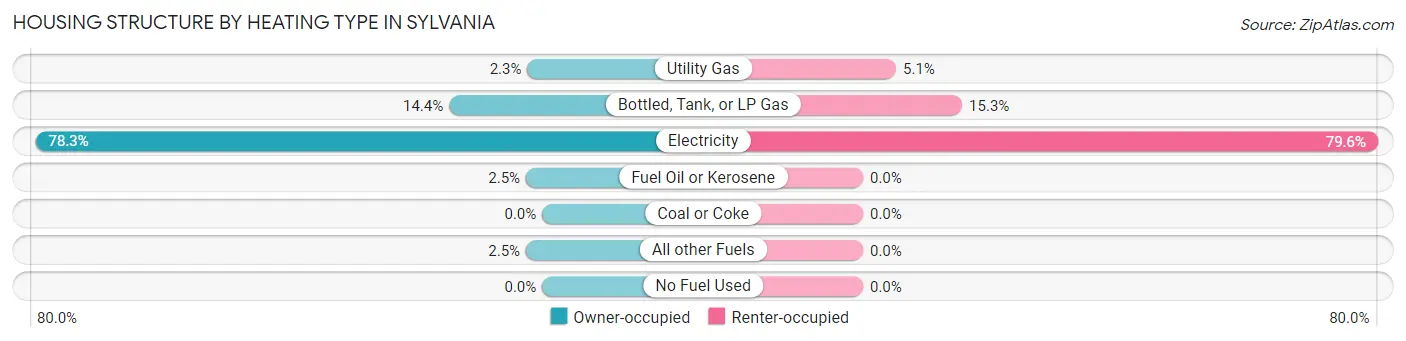
| Heating Type | Owner-occupied | Renter-occupied |
| Utility Gas | 11 (2.3%) | 12 (5.1%) |
| Bottled, Tank, or LP Gas | 69 (14.4%) | 36 (15.3%) |
| Electricity | 376 (78.3%) | 187 (79.6%) |
| Fuel Oil or Kerosene | 12 (2.5%) | 0 (0.0%) |
| Coal or Coke | 0 (0.0%) | 0 (0.0%) |
| All other Fuels | 12 (2.5%) | 0 (0.0%) |
| No Fuel Used | 0 (0.0%) | 0 (0.0%) |
| Total | 480 (100.0%) | 235 (100.0%) |
Household Vehicle Usage in Sylvania
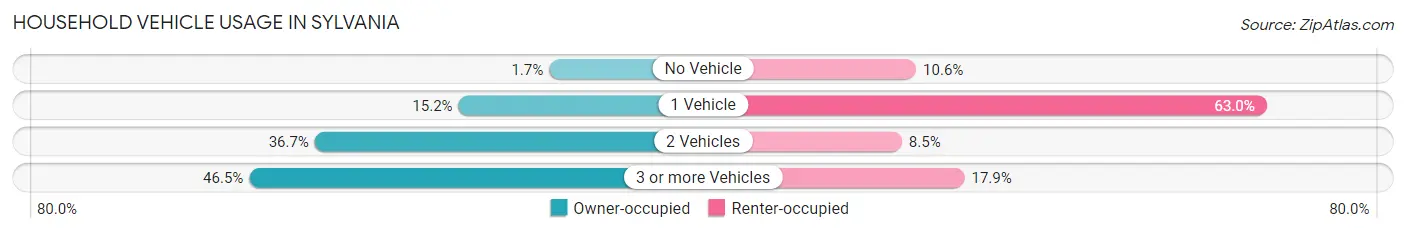
| Vehicles per Household | Owner-occupied | Renter-occupied |
| No Vehicle | 8 (1.7%) | 25 (10.6%) |
| 1 Vehicle | 73 (15.2%) | 148 (63.0%) |
| 2 Vehicles | 176 (36.7%) | 20 (8.5%) |
| 3 or more Vehicles | 223 (46.5%) | 42 (17.9%) |
| Total | 480 (100.0%) | 235 (100.0%) |
Real Estate & Mortgages in Sylvania
Real Estate and Mortgage Overview in Sylvania
| Characteristic | Without Mortgage | With Mortgage |
| Housing Units | 257 | 223 |
| Median Property Value | $97,500 | $133,600 |
| Median Household Income | $52,188 | $12 |
| Monthly Housing Costs | $393 | $0 |
| Real Estate Taxes | $414 | $32 |
Property Value by Mortgage Status in Sylvania
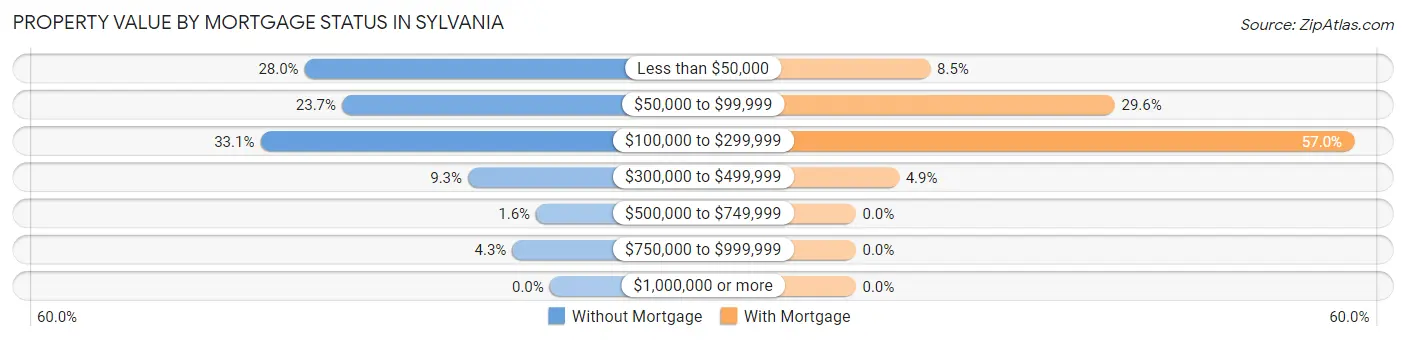
| Property Value | Without Mortgage | With Mortgage |
| Less than $50,000 | 72 (28.0%) | 19 (8.5%) |
| $50,000 to $99,999 | 61 (23.7%) | 66 (29.6%) |
| $100,000 to $299,999 | 85 (33.1%) | 127 (57.0%) |
| $300,000 to $499,999 | 24 (9.3%) | 11 (4.9%) |
| $500,000 to $749,999 | 4 (1.6%) | 0 (0.0%) |
| $750,000 to $999,999 | 11 (4.3%) | 0 (0.0%) |
| $1,000,000 or more | 0 (0.0%) | 0 (0.0%) |
| Total | 257 (100.0%) | 223 (100.0%) |
Household Income by Mortgage Status in Sylvania
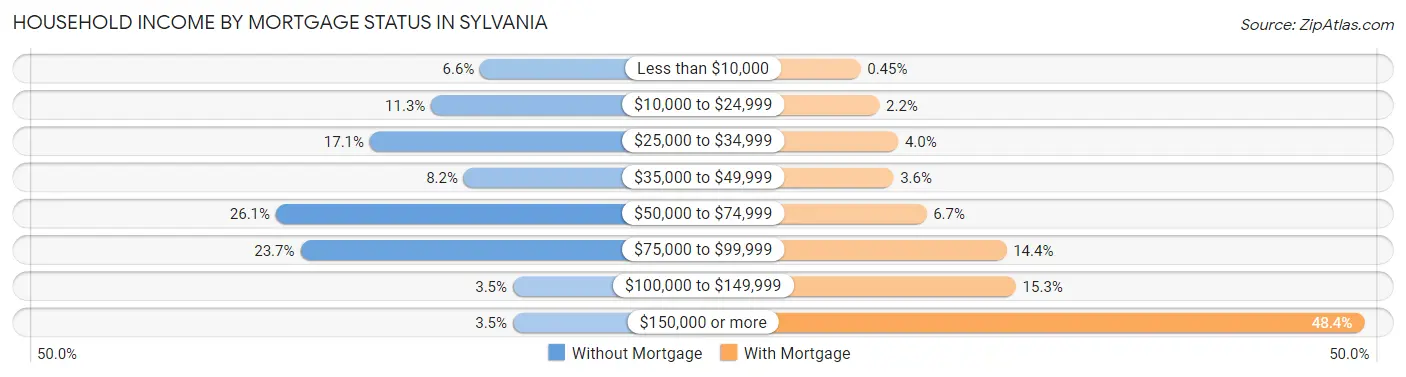
| Household Income | Without Mortgage | With Mortgage |
| Less than $10,000 | 17 (6.6%) | 1 (0.4%) |
| $10,000 to $24,999 | 29 (11.3%) | 5 (2.2%) |
| $25,000 to $34,999 | 44 (17.1%) | 9 (4.0%) |
| $35,000 to $49,999 | 21 (8.2%) | 8 (3.6%) |
| $50,000 to $74,999 | 67 (26.1%) | 15 (6.7%) |
| $75,000 to $99,999 | 61 (23.7%) | 32 (14.3%) |
| $100,000 to $149,999 | 9 (3.5%) | 34 (15.2%) |
| $150,000 or more | 9 (3.5%) | 108 (48.4%) |
| Total | 257 (100.0%) | 223 (100.0%) |
Property Value to Household Income Ratio in Sylvania
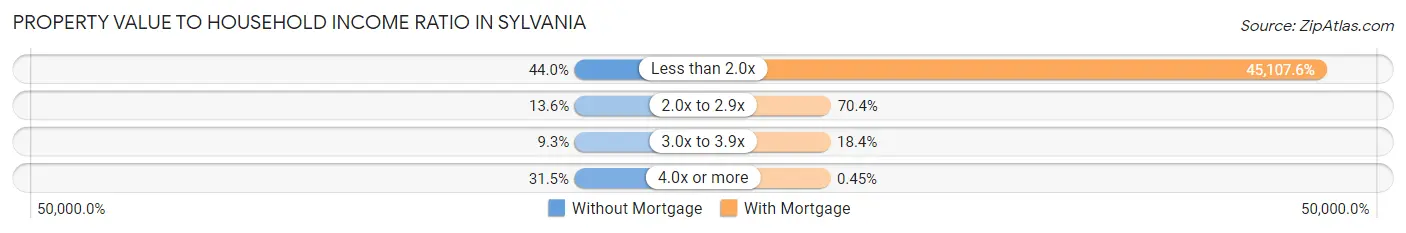
| Value-to-Income Ratio | Without Mortgage | With Mortgage |
| Less than 2.0x | 113 (44.0%) | 100,590 (45,107.6%) |
| 2.0x to 2.9x | 35 (13.6%) | 157 (70.4%) |
| 3.0x to 3.9x | 24 (9.3%) | 41 (18.4%) |
| 4.0x or more | 81 (31.5%) | 1 (0.4%) |
| Total | 257 (100.0%) | 223 (100.0%) |
Real Estate Taxes by Mortgage Status in Sylvania
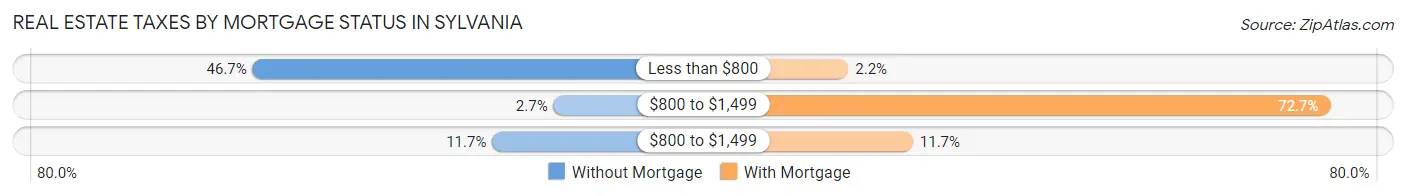
| Property Taxes | Without Mortgage | With Mortgage |
| Less than $800 | 120 (46.7%) | 5 (2.2%) |
| $800 to $1,499 | 7 (2.7%) | 162 (72.7%) |
| $800 to $1,499 | 30 (11.7%) | 26 (11.7%) |
| Total | 257 (100.0%) | 223 (100.0%) |
Health & Disability in Sylvania
Health Insurance Coverage by Age in Sylvania
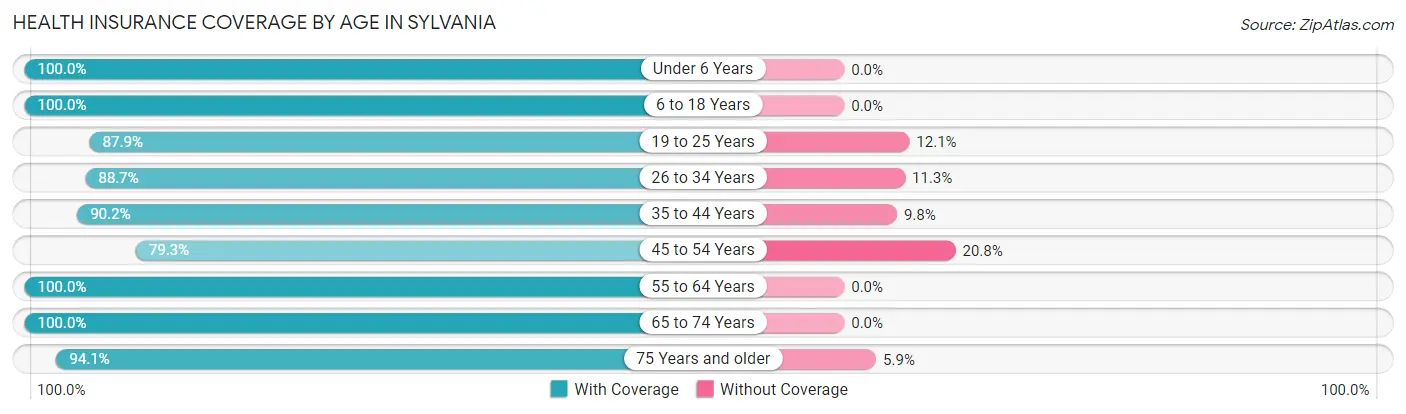
| Age Bracket | With Coverage | Without Coverage |
| Under 6 Years | 151 (100.0%) | 0 (0.0%) |
| 6 to 18 Years | 371 (100.0%) | 0 (0.0%) |
| 19 to 25 Years | 152 (87.9%) | 21 (12.1%) |
| 26 to 34 Years | 211 (88.7%) | 27 (11.3%) |
| 35 to 44 Years | 294 (90.2%) | 32 (9.8%) |
| 45 to 54 Years | 168 (79.2%) | 44 (20.7%) |
| 55 to 64 Years | 213 (100.0%) | 0 (0.0%) |
| 65 to 74 Years | 186 (100.0%) | 0 (0.0%) |
| 75 Years and older | 95 (94.1%) | 6 (5.9%) |
| Total | 1,841 (93.4%) | 130 (6.6%) |
Health Insurance Coverage by Citizenship Status in Sylvania
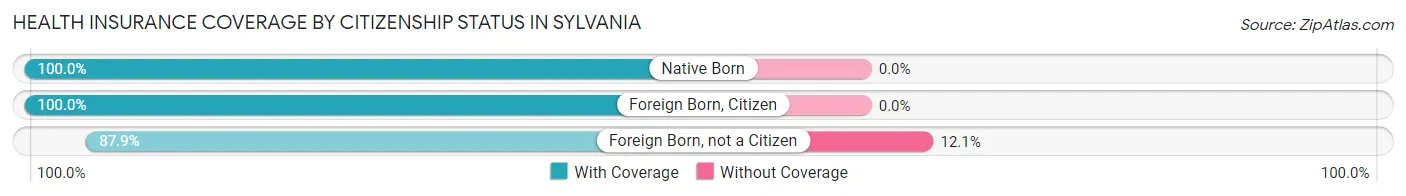
| Citizenship Status | With Coverage | Without Coverage |
| Native Born | 151 (100.0%) | 0 (0.0%) |
| Foreign Born, Citizen | 371 (100.0%) | 0 (0.0%) |
| Foreign Born, not a Citizen | 152 (87.9%) | 21 (12.1%) |
Health Insurance Coverage by Household Income in Sylvania
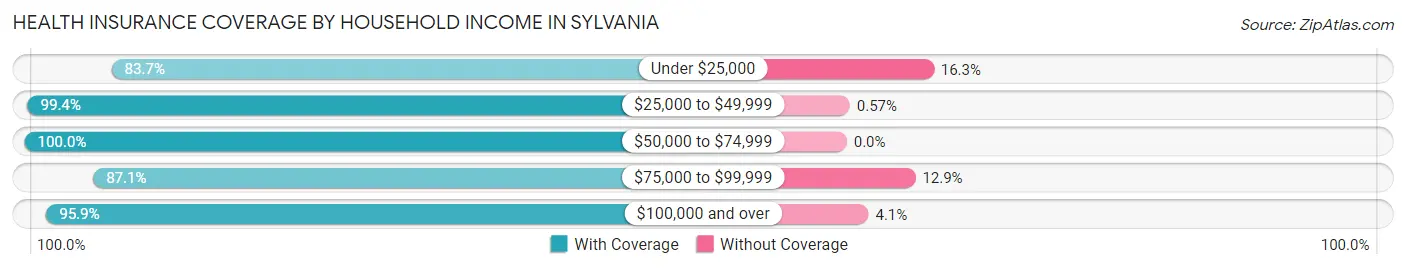
| Household Income | With Coverage | Without Coverage |
| Under $25,000 | 267 (83.7%) | 52 (16.3%) |
| $25,000 to $49,999 | 347 (99.4%) | 2 (0.6%) |
| $50,000 to $74,999 | 342 (100.0%) | 0 (0.0%) |
| $75,000 to $99,999 | 366 (87.1%) | 54 (12.9%) |
| $100,000 and over | 519 (95.9%) | 22 (4.1%) |
Public vs Private Health Insurance Coverage by Age in Sylvania
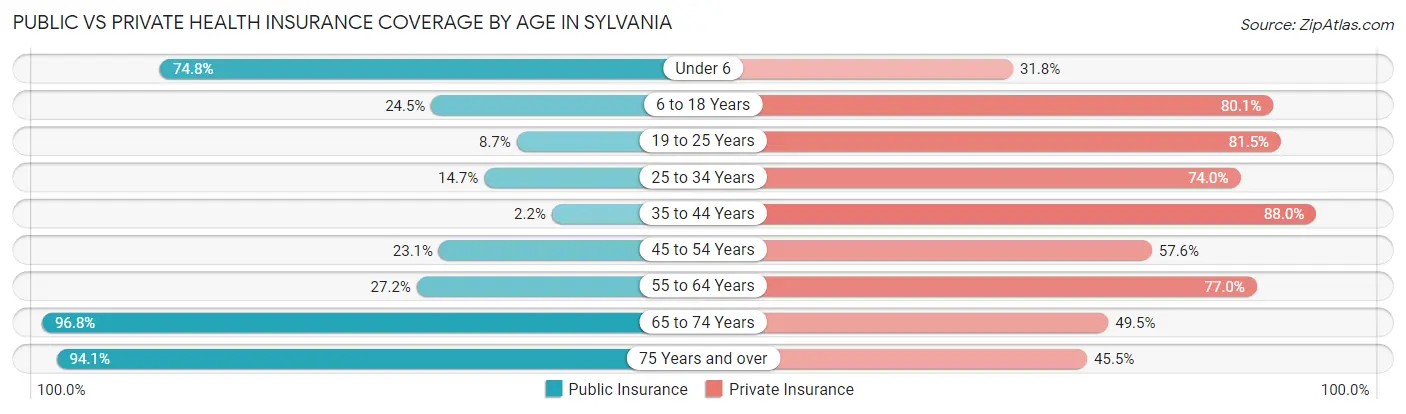
| Age Bracket | Public Insurance | Private Insurance |
| Under 6 | 113 (74.8%) | 48 (31.8%) |
| 6 to 18 Years | 91 (24.5%) | 297 (80.0%) |
| 19 to 25 Years | 15 (8.7%) | 141 (81.5%) |
| 25 to 34 Years | 35 (14.7%) | 176 (74.0%) |
| 35 to 44 Years | 7 (2.1%) | 287 (88.0%) |
| 45 to 54 Years | 49 (23.1%) | 122 (57.6%) |
| 55 to 64 Years | 58 (27.2%) | 164 (77.0%) |
| 65 to 74 Years | 180 (96.8%) | 92 (49.5%) |
| 75 Years and over | 95 (94.1%) | 46 (45.5%) |
| Total | 643 (32.6%) | 1,373 (69.7%) |
Disability Status by Sex by Age in Sylvania
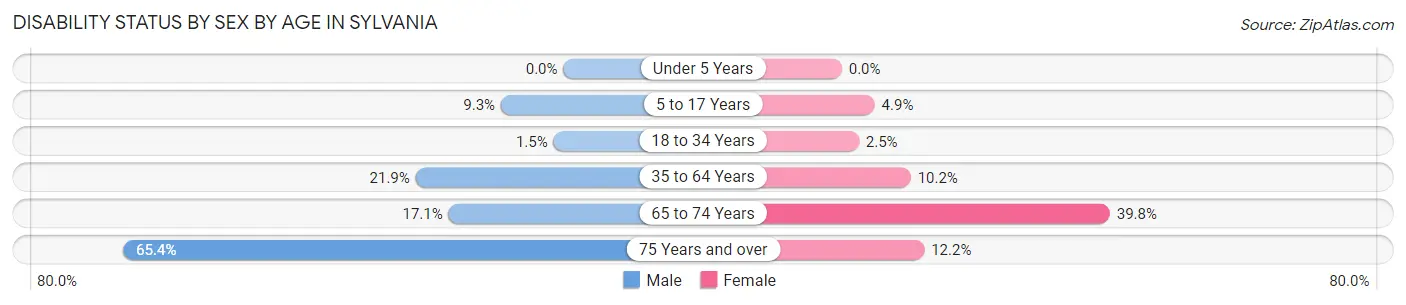
| Age Bracket | Male | Female |
| Under 5 Years | 0 (0.0%) | 0 (0.0%) |
| 5 to 17 Years | 14 (9.3%) | 14 (4.9%) |
| 18 to 34 Years | 2 (1.5%) | 7 (2.5%) |
| 35 to 64 Years | 79 (21.9%) | 40 (10.2%) |
| 65 to 74 Years | 15 (17.1%) | 39 (39.8%) |
| 75 Years and over | 34 (65.4%) | 6 (12.2%) |
Disability Class by Sex by Age in Sylvania
Disability Class: Hearing Difficulty
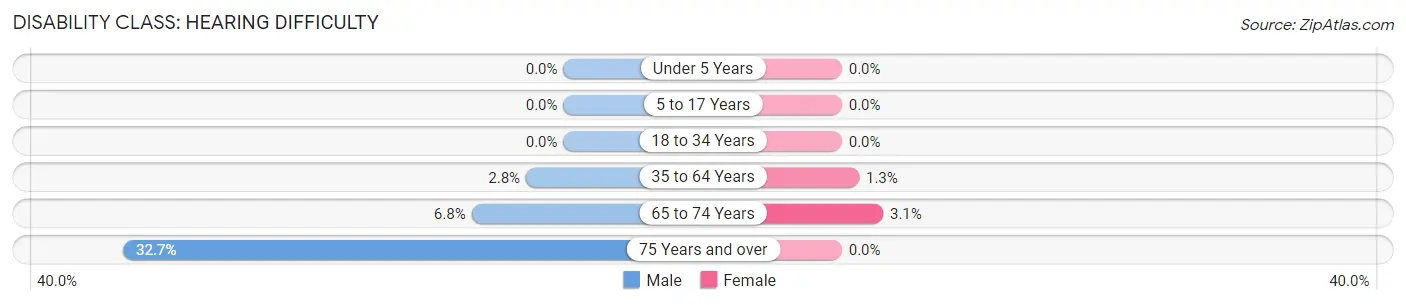
| Age Bracket | Male | Female |
| Under 5 Years | 0 (0.0%) | 0 (0.0%) |
| 5 to 17 Years | 0 (0.0%) | 0 (0.0%) |
| 18 to 34 Years | 0 (0.0%) | 0 (0.0%) |
| 35 to 64 Years | 10 (2.8%) | 5 (1.3%) |
| 65 to 74 Years | 6 (6.8%) | 3 (3.1%) |
| 75 Years and over | 17 (32.7%) | 0 (0.0%) |
Disability Class: Vision Difficulty
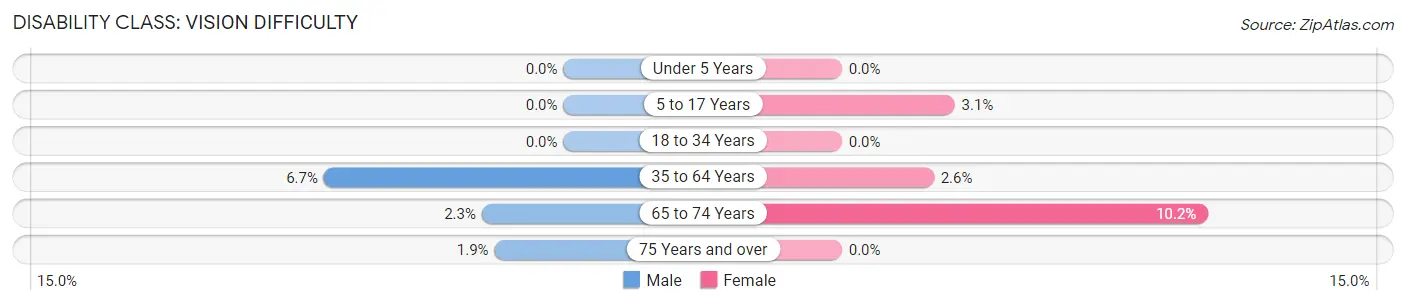
| Age Bracket | Male | Female |
| Under 5 Years | 0 (0.0%) | 0 (0.0%) |
| 5 to 17 Years | 0 (0.0%) | 9 (3.1%) |
| 18 to 34 Years | 0 (0.0%) | 0 (0.0%) |
| 35 to 64 Years | 24 (6.7%) | 10 (2.6%) |
| 65 to 74 Years | 2 (2.3%) | 10 (10.2%) |
| 75 Years and over | 1 (1.9%) | 0 (0.0%) |
Disability Class: Cognitive Difficulty
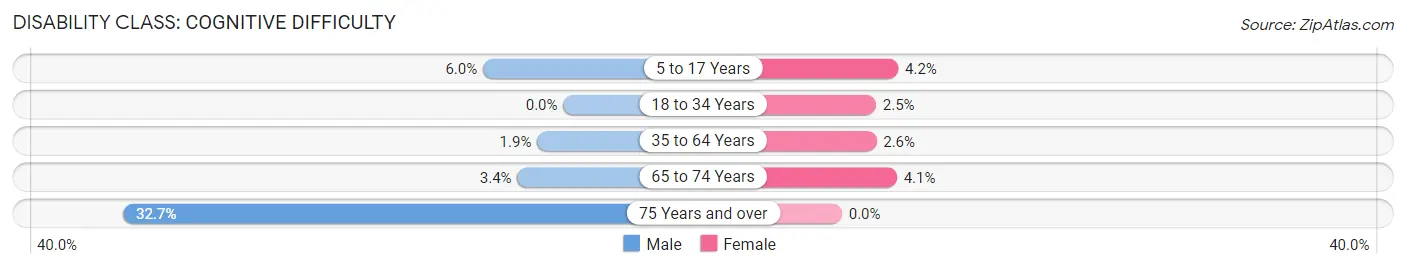
| Age Bracket | Male | Female |
| 5 to 17 Years | 9 (6.0%) | 12 (4.2%) |
| 18 to 34 Years | 0 (0.0%) | 7 (2.5%) |
| 35 to 64 Years | 7 (1.9%) | 10 (2.6%) |
| 65 to 74 Years | 3 (3.4%) | 4 (4.1%) |
| 75 Years and over | 17 (32.7%) | 0 (0.0%) |
Disability Class: Ambulatory Difficulty
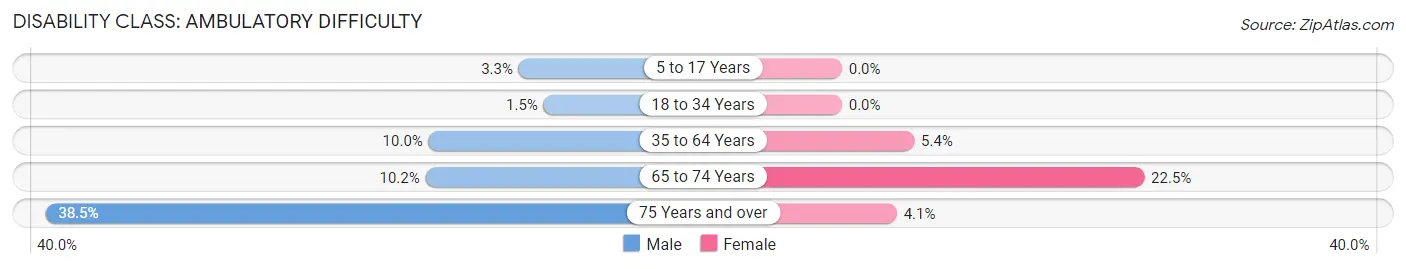
| Age Bracket | Male | Female |
| 5 to 17 Years | 5 (3.3%) | 0 (0.0%) |
| 18 to 34 Years | 2 (1.5%) | 0 (0.0%) |
| 35 to 64 Years | 36 (10.0%) | 21 (5.4%) |
| 65 to 74 Years | 9 (10.2%) | 22 (22.5%) |
| 75 Years and over | 20 (38.5%) | 2 (4.1%) |
Disability Class: Self-Care Difficulty
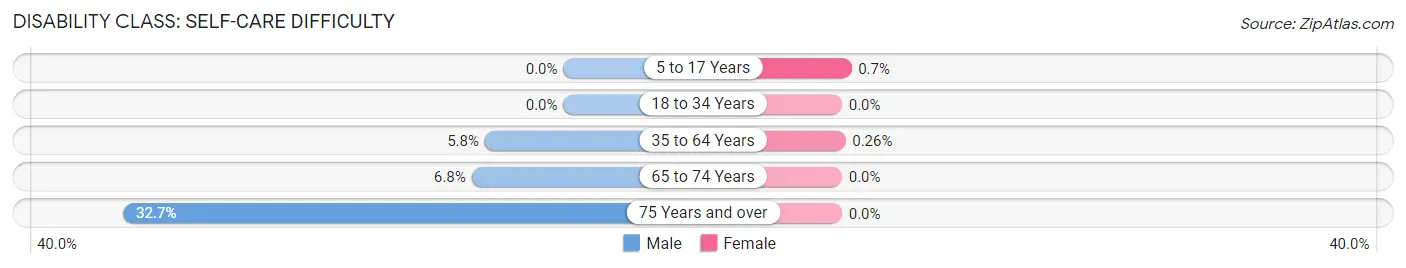
| Age Bracket | Male | Female |
| 5 to 17 Years | 0 (0.0%) | 2 (0.7%) |
| 18 to 34 Years | 0 (0.0%) | 0 (0.0%) |
| 35 to 64 Years | 21 (5.8%) | 1 (0.3%) |
| 65 to 74 Years | 6 (6.8%) | 0 (0.0%) |
| 75 Years and over | 17 (32.7%) | 0 (0.0%) |
Technology Access in Sylvania
Computing Device Access in Sylvania
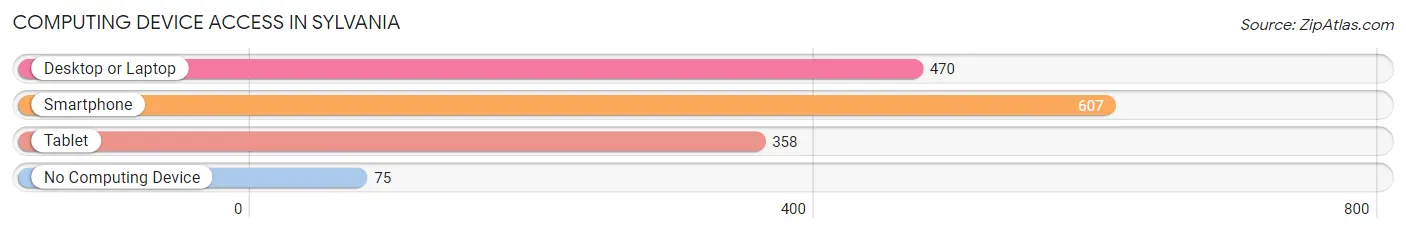
| Device Type | # Households | % Households |
| Desktop or Laptop | 470 | 65.7% |
| Smartphone | 607 | 84.9% |
| Tablet | 358 | 50.1% |
| No Computing Device | 75 | 10.5% |
| Total | 715 | 100.0% |
Internet Access in Sylvania
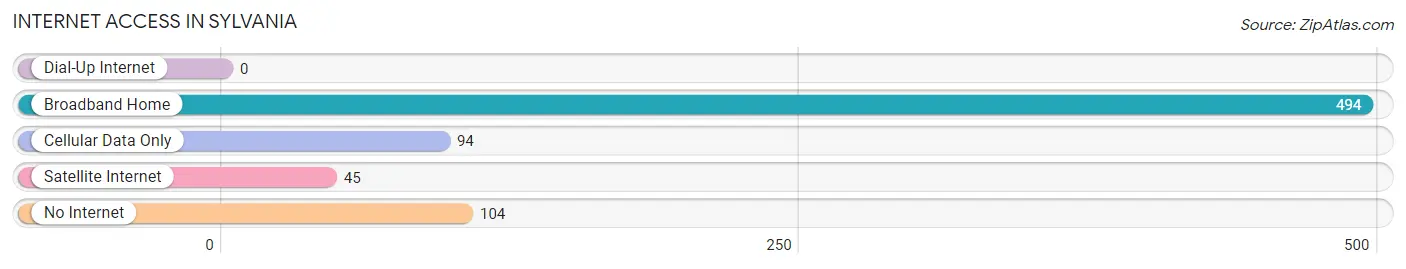
| Internet Type | # Households | % Households |
| Dial-Up Internet | 0 | 0.0% |
| Broadband Home | 494 | 69.1% |
| Cellular Data Only | 94 | 13.2% |
| Satellite Internet | 45 | 6.3% |
| No Internet | 104 | 14.5% |
| Total | 715 | 100.0% |
Sylvania Summary
Sylvania is a small town located in the northwest corner of Alabama, in Colbert County. It is situated on the banks of the Tennessee River, and is part of the Muscle Shoals metropolitan area. The town has a population of approximately 1,000 people, and is known for its rural charm and friendly atmosphere.
History
Sylvania was founded in 1818 by settlers from North Carolina. The town was named after the Latin word for “forest”, and was originally a farming community. In the late 19th century, the town began to grow as a result of the lumber industry. The town was incorporated in 1887, and the first mayor was elected in 1888.
In the early 20th century, Sylvania became a popular tourist destination due to its proximity to the Tennessee River. The town was home to several resorts, and was known for its fishing and hunting opportunities.
In the 1950s, the town began to decline as the lumber industry moved away. The town was revitalized in the 1970s, when the Tennessee Valley Authority (TVA) began to build a dam on the Tennessee River. The dam created a large lake, which provided recreational opportunities for the town.
Geography
Sylvania is located in the northwest corner of Alabama, in Colbert County. It is situated on the banks of the Tennessee River, and is part of the Muscle Shoals metropolitan area. The town is located approximately 25 miles south of Florence, and is about an hour’s drive from Huntsville.
The town is situated in a hilly area, and is surrounded by forests and farmland. The town is located at an elevation of approximately 500 feet above sea level.
Economy
Sylvania’s economy is largely based on tourism and agriculture. The town is home to several resorts, and is known for its fishing and hunting opportunities. The town is also home to several small businesses, including restaurants, shops, and a hardware store.
The town is also home to several manufacturing companies, including a furniture factory and a paper mill. The town is also home to a large poultry processing plant.
Demographics
As of the 2010 census, Sylvania had a population of 1,000 people. The town is predominantly white, with approximately 95% of the population being white. The town also has a small African American population, with approximately 4% of the population being African American.
The median household income in Sylvania is approximately $35,000, and the median home value is approximately $90,000. The town has a low unemployment rate, with approximately 4% of the population being unemployed.
Conclusion
Sylvania is a small town located in the northwest corner of Alabama, in Colbert County. It is situated on the banks of the Tennessee River, and is part of the Muscle Shoals metropolitan area. The town has a population of approximately 1,000 people, and is known for its rural charm and friendly atmosphere. The town’s economy is largely based on tourism and agriculture, and the town is home to several small businesses, manufacturing companies, and a large poultry processing plant. The town is predominantly white, with approximately 95% of the population being white. The median household income in Sylvania is approximately $35,000, and the median home value is approximately $90,000.
Common Questions
What is the Total Population of Sylvania?
Total Population of Sylvania is 1,971.
What is the Total Male Population of Sylvania?
Total Male Population of Sylvania is 831.
What is the Total Female Population of Sylvania?
Total Female Population of Sylvania is 1,140.
What is the Ratio of Males per 100 Females in Sylvania?
There are 72.89 Males per 100 Females in Sylvania.
What is the Ratio of Females per 100 Males in Sylvania?
There are 137.18 Females per 100 Males in Sylvania.
What is the Median Population Age in Sylvania?
Median Population Age in Sylvania is 36.7 Years.
What is the Average Family Size in Sylvania
Average Family Size in Sylvania is 3.4 People.
What is the Average Household Size in Sylvania
Average Household Size in Sylvania is 2.8 People.
What is Per Capita Income in Sylvania?
Per Capita income in Sylvania is $27,029.
What is the Median Family Income in Sylvania?
Median Family Income in Sylvania is $59,750.
What is the Median Household income in Sylvania?
Median Household Income in Sylvania is $50,993.
What is Income or Wage Gap in Sylvania?
Income or Wage Gap in Sylvania is 35.9%.
Women in Sylvania earn 64.1 cents for every dollar earned by a man.
What is Inequality or Gini Index in Sylvania?
Inequality or Gini Index in Sylvania is 0.47.
How Large is the Labor Force in Sylvania?
There are 1,000 People in the Labor Forcein in Sylvania.
What is the Percentage of People in the Labor Force in Sylvania?
66.2% of People are in the Labor Force in Sylvania.
What is the Unemployment Rate in Sylvania?
Unemployment Rate in Sylvania is 3.4%.