Semmes, AL
Semmes Map
Semmes Overview
5,123
TOTAL POPULATION
2,387
MALE POPULATION
2,736
FEMALE POPULATION
87.24
MALES / 100 FEMALES
114.62
FEMALES / 100 MALES
45.1
MEDIAN AGE
2.9
AVG FAMILY SIZE
2.3
AVG HOUSEHOLD SIZE
$34,792
PER CAPITA INCOME
$74,291
AVG FAMILY INCOME
$61,433
AVG HOUSEHOLD INCOME
16.5%
WAGE / INCOME GAP [ % ]
83.5¢/ $1
WAGE / INCOME GAP [ $ ]
0.46
INEQUALITY / GINI INDEX
2,156
LABOR FORCE [ PEOPLE ]
50.4%
PERCENT IN LABOR FORCE
2.3%
UNEMPLOYMENT RATE
Semmes Zip Codes
Semmes Area Codes
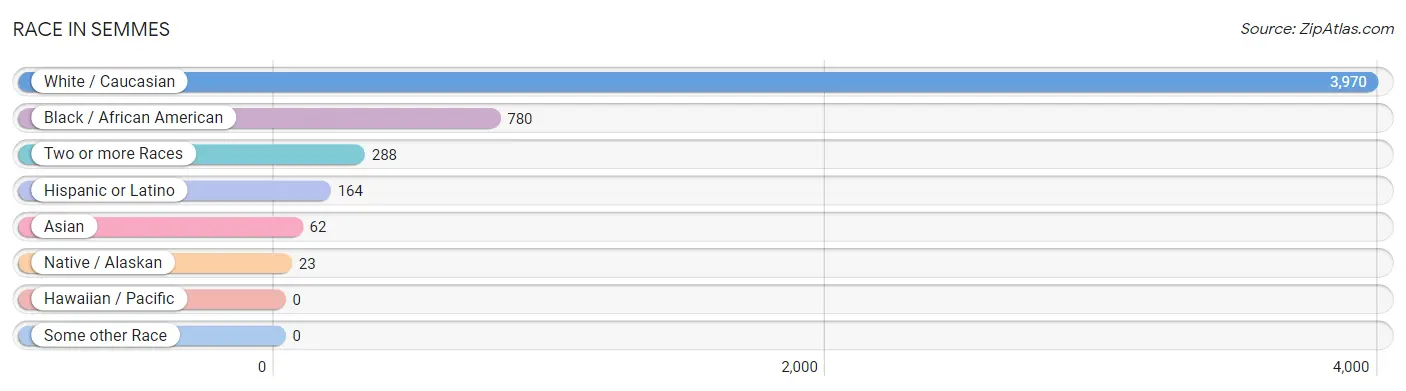
Race in Semmes
The most populous races in Semmes are White / Caucasian (3,970 | 77.5%), Black / African American (780 | 15.2%), and Two or more Races (288 | 5.6%).
| Race | # Population | % Population |
| Asian | 62 | 1.2% |
| Black / African American | 780 | 15.2% |
| Hawaiian / Pacific | 0 | 0.0% |
| Hispanic or Latino | 164 | 3.2% |
| Native / Alaskan | 23 | 0.4% |
| White / Caucasian | 3,970 | 77.5% |
| Two or more Races | 288 | 5.6% |
| Some other Race | 0 | 0.0% |
| Total | 5,123 | 100.0% |
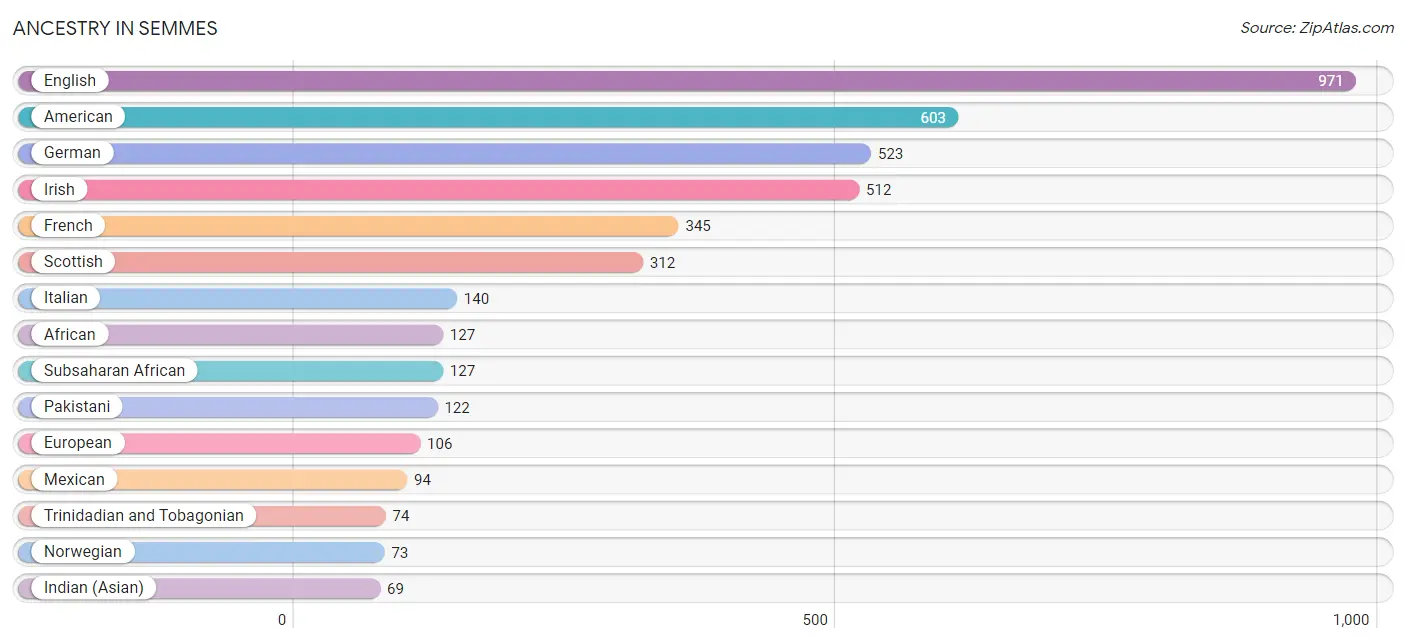
Ancestry in Semmes
The most populous ancestries reported in Semmes are English (971 | 19.0%), American (603 | 11.8%), German (523 | 10.2%), Irish (512 | 10.0%), and French (345 | 6.7%), together accounting for 57.7% of all Semmes residents.
| Ancestry | # Population | % Population |
| African | 127 | 2.5% |
| American | 603 | 11.8% |
| Arab | 30 | 0.6% |
| Bhutanese | 30 | 0.6% |
| British | 16 | 0.3% |
| Central American Indian | 8 | 0.2% |
| Cherokee | 60 | 1.2% |
| Choctaw | 30 | 0.6% |
| Cuban | 62 | 1.2% |
| Czech | 17 | 0.3% |
| Dutch | 43 | 0.8% |
| English | 971 | 19.0% |
| European | 106 | 2.1% |
| French | 345 | 6.7% |
| German | 523 | 10.2% |
| Indian (Asian) | 69 | 1.3% |
| Irish | 512 | 10.0% |
| Italian | 140 | 2.7% |
| Korean | 9 | 0.2% |
| Lebanese | 30 | 0.6% |
| Mexican | 94 | 1.8% |
| Native Hawaiian | 44 | 0.9% |
| Northern European | 25 | 0.5% |
| Norwegian | 73 | 1.4% |
| Pakistani | 122 | 2.4% |
| Polish | 59 | 1.1% |
| Portuguese | 12 | 0.2% |
| Puerto Rican | 8 | 0.2% |
| Russian | 37 | 0.7% |
| Scandinavian | 55 | 1.1% |
| Scotch-Irish | 34 | 0.7% |
| Scottish | 312 | 6.1% |
| Subsaharan African | 127 | 2.5% |
| Trinidadian and Tobagonian | 74 | 1.4% | View All 34 Rows |
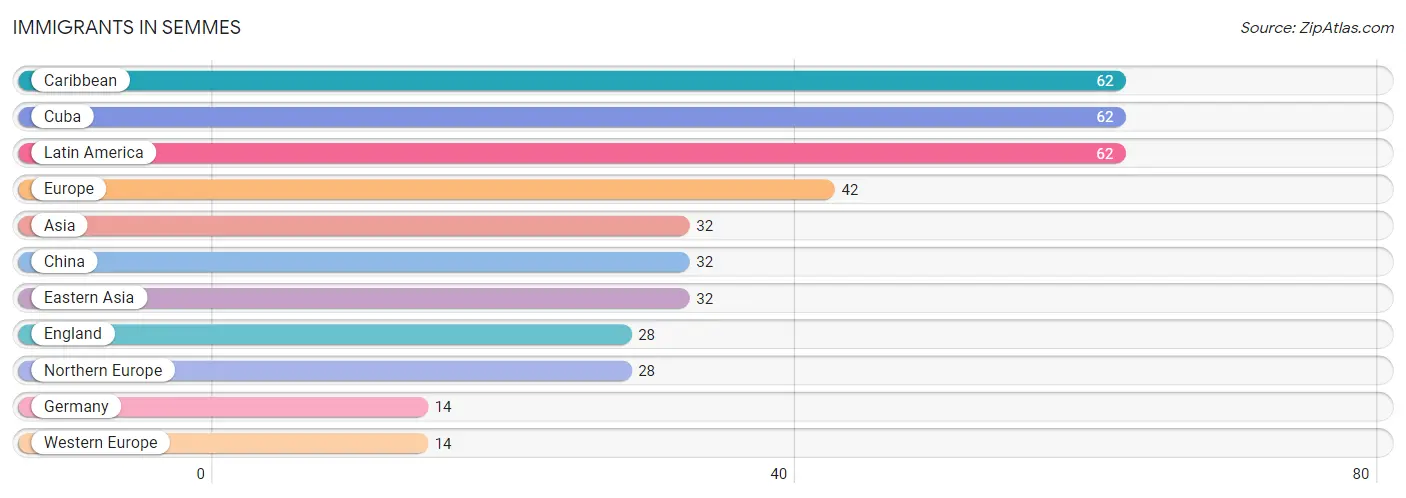
Immigrants in Semmes
The most numerous immigrant groups reported in Semmes came from Caribbean (62 | 1.2%), Cuba (62 | 1.2%), Latin America (62 | 1.2%), Europe (42 | 0.8%), and Asia (32 | 0.6%), together accounting for 5.1% of all Semmes residents.
| Immigration Origin | # Population | % Population |
| Asia | 32 | 0.6% |
| Caribbean | 62 | 1.2% |
| China | 32 | 0.6% |
| Cuba | 62 | 1.2% |
| Eastern Asia | 32 | 0.6% |
| England | 28 | 0.5% |
| Europe | 42 | 0.8% |
| Germany | 14 | 0.3% |
| Latin America | 62 | 1.2% |
| Northern Europe | 28 | 0.5% |
| Western Europe | 14 | 0.3% | View All 11 Rows |
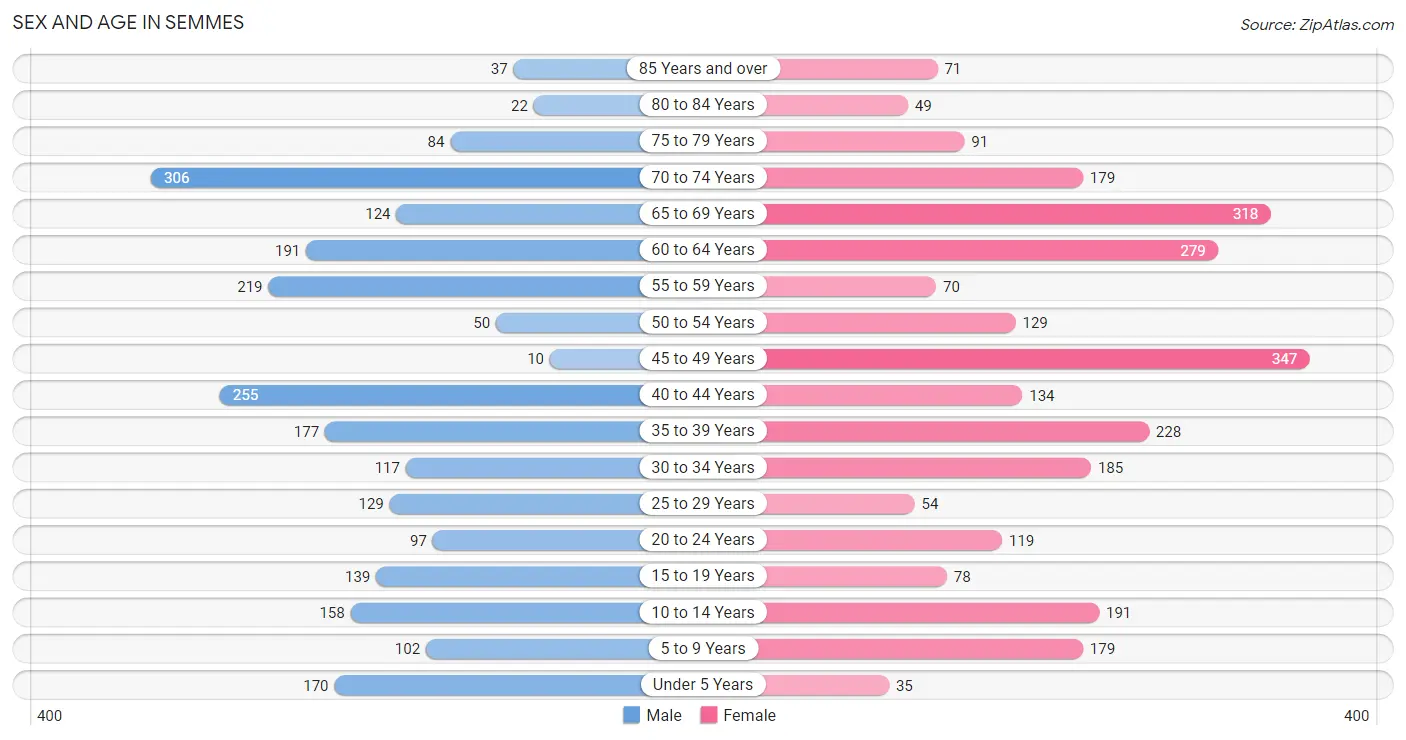
Sex and Age in Semmes
Sex and Age in Semmes
The most populous age groups in Semmes are 70 to 74 Years (306 | 12.8%) for men and 45 to 49 Years (347 | 12.7%) for women.
| Age Bracket | Male | Female |
| Under 5 Years | 170 (7.1%) | 35 (1.3%) |
| 5 to 9 Years | 102 (4.3%) | 179 (6.5%) |
| 10 to 14 Years | 158 (6.6%) | 191 (7.0%) |
| 15 to 19 Years | 139 (5.8%) | 78 (2.9%) |
| 20 to 24 Years | 97 (4.1%) | 119 (4.3%) |
| 25 to 29 Years | 129 (5.4%) | 54 (2.0%) |
| 30 to 34 Years | 117 (4.9%) | 185 (6.8%) |
| 35 to 39 Years | 177 (7.4%) | 228 (8.3%) |
| 40 to 44 Years | 255 (10.7%) | 134 (4.9%) |
| 45 to 49 Years | 10 (0.4%) | 347 (12.7%) |
| 50 to 54 Years | 50 (2.1%) | 129 (4.7%) |
| 55 to 59 Years | 219 (9.2%) | 70 (2.6%) |
| 60 to 64 Years | 191 (8.0%) | 279 (10.2%) |
| 65 to 69 Years | 124 (5.2%) | 318 (11.6%) |
| 70 to 74 Years | 306 (12.8%) | 179 (6.5%) |
| 75 to 79 Years | 84 (3.5%) | 91 (3.3%) |
| 80 to 84 Years | 22 (0.9%) | 49 (1.8%) |
| 85 Years and over | 37 (1.5%) | 71 (2.6%) |
| Total | 2,387 (100.0%) | 2,736 (100.0%) |
Families and Households in Semmes
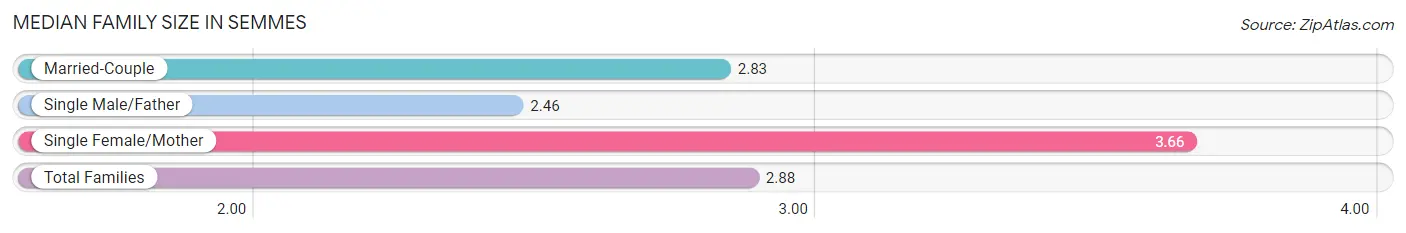
Median Family Size in Semmes
The median family size in Semmes is 2.88 persons per family, with single female/mother families (170 | 11.6%) accounting for the largest median family size of 3.66 persons per family. On the other hand, single male/father families (204 | 14.0%) represent the smallest median family size with 2.46 persons per family.
| Family Type | # Families | Family Size |
| Married-Couple | 1,086 (74.4%) | 2.83 |
| Single Male/Father | 204 (14.0%) | 2.46 |
| Single Female/Mother | 170 (11.6%) | 3.66 |
| Total Families | 1,460 (100.0%) | 2.88 |
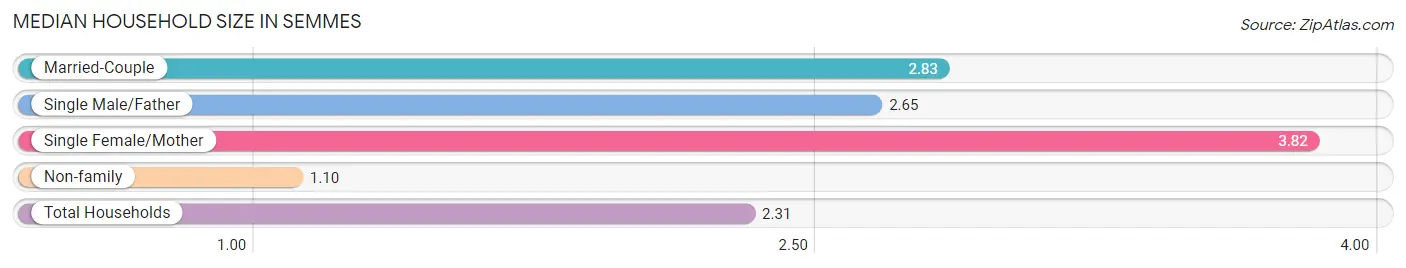
Median Household Size in Semmes
The median household size in Semmes is 2.31 persons per household, with single female/mother households (170 | 7.7%) accounting for the largest median household size of 3.82 persons per household. non-family households (749 | 33.9%) represent the smallest median household size with 1.10 persons per household.
| Household Type | # Households | Household Size |
| Married-Couple | 1,086 (49.2%) | 2.83 |
| Single Male/Father | 204 (9.2%) | 2.65 |
| Single Female/Mother | 170 (7.7%) | 3.82 |
| Non-family | 749 (33.9%) | 1.10 |
| Total Households | 2,209 (100.0%) | 2.31 |
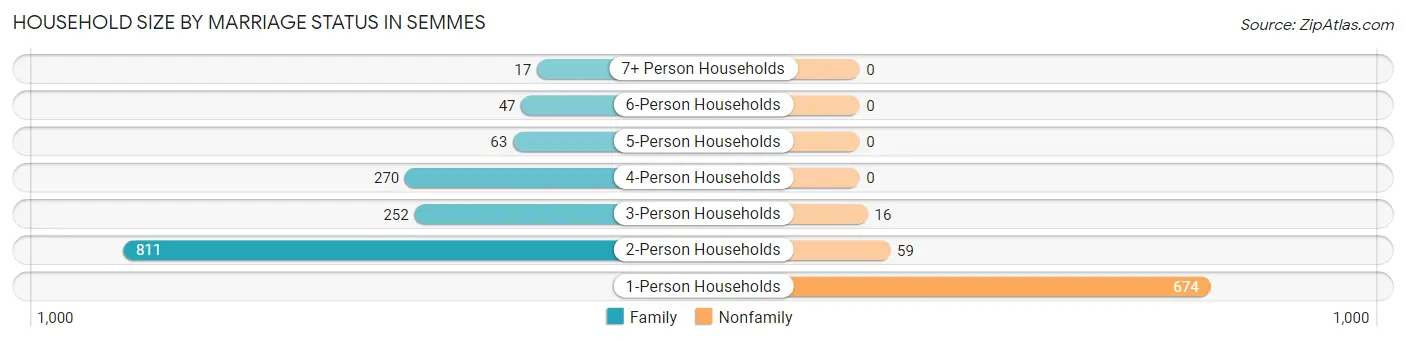
Household Size by Marriage Status in Semmes
Out of a total of 2,209 households in Semmes, 1,460 (66.1%) are family households, while 749 (33.9%) are nonfamily households. The most numerous type of family households are 2-person households, comprising 811, and the most common type of nonfamily households are 1-person households, comprising 674.
| Household Size | Family Households | Nonfamily Households |
| 1-Person Households | - | 674 (30.5%) |
| 2-Person Households | 811 (36.7%) | 59 (2.7%) |
| 3-Person Households | 252 (11.4%) | 16 (0.7%) |
| 4-Person Households | 270 (12.2%) | 0 (0.0%) |
| 5-Person Households | 63 (2.9%) | 0 (0.0%) |
| 6-Person Households | 47 (2.1%) | 0 (0.0%) |
| 7+ Person Households | 17 (0.8%) | 0 (0.0%) |
| Total | 1,460 (66.1%) | 749 (33.9%) |
Female Fertility in Semmes
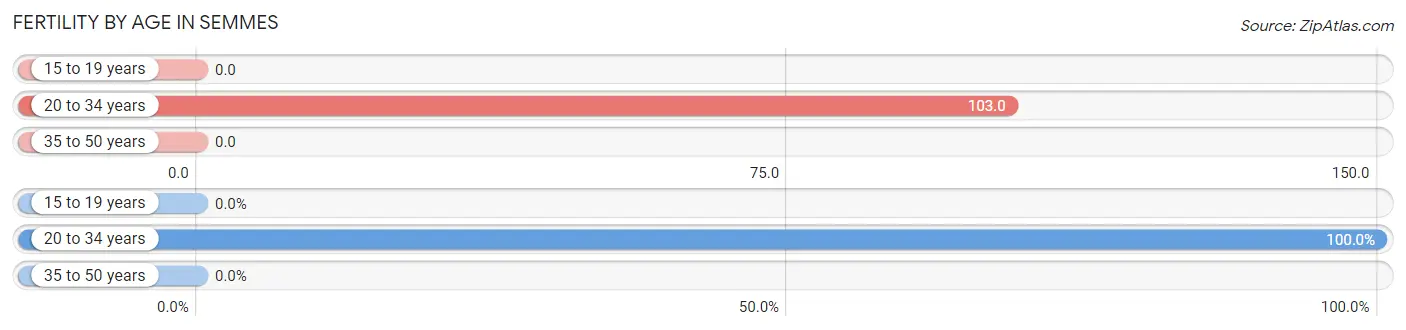
Fertility by Age in Semmes
Average fertility rate in Semmes is 32.0 births per 1,000 women. Women in the age bracket of 20 to 34 years have the highest fertility rate with 103.0 births per 1,000 women. Women in the age bracket of 20 to 34 years acount for 100.0% of all women with births.
| Age Bracket | Women with Births | Births / 1,000 Women |
| 15 to 19 years | 0 (0.0%) | 0.0 |
| 20 to 34 years | 37 (100.0%) | 103.0 |
| 35 to 50 years | 0 (0.0%) | 0.0 |
| Total | 37 (100.0%) | 32.0 |
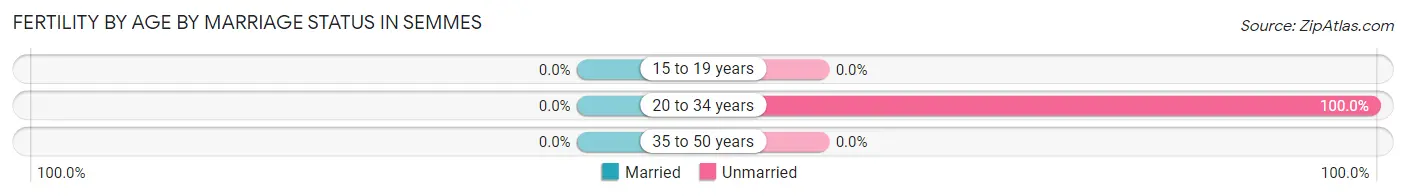
Fertility by Age by Marriage Status in Semmes
| Age Bracket | Married | Unmarried |
| 15 to 19 years | 0 (0.0%) | 0 (0.0%) |
| 20 to 34 years | 0 (0.0%) | 37 (100.0%) |
| 35 to 50 years | 0 (0.0%) | 0 (0.0%) |
| Total | 0 (0.0%) | 37 (100.0%) |
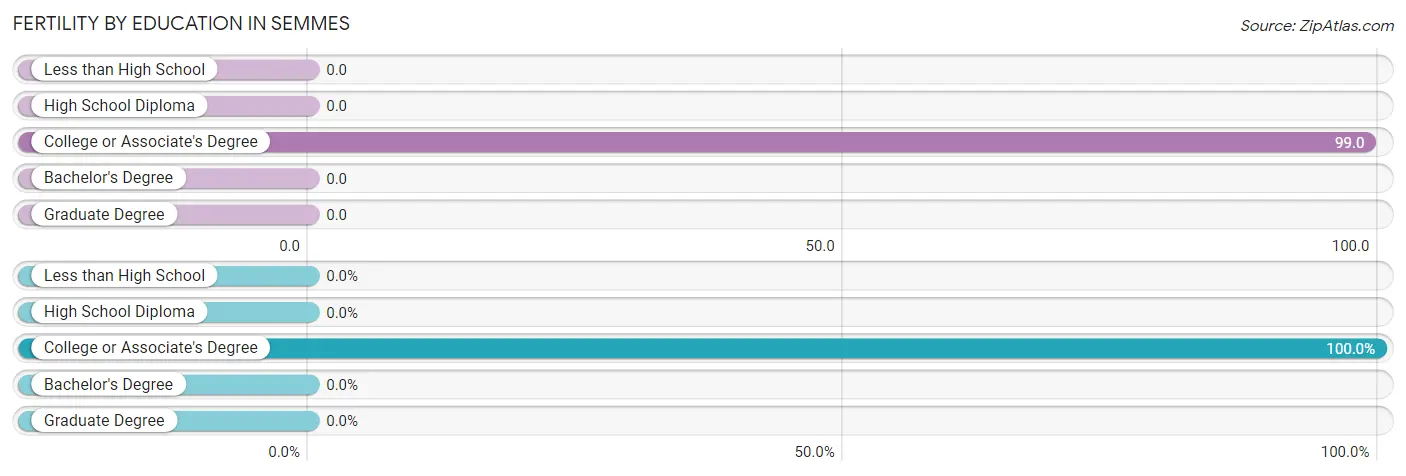
Fertility by Education in Semmes
| Educational Attainment | Women with Births | Births / 1,000 Women |
| Less than High School | 0 (0.0%) | 0.0 |
| High School Diploma | 0 (0.0%) | 0.0 |
| College or Associate's Degree | 37 (100.0%) | 99.0 |
| Bachelor's Degree | 0 (0.0%) | 0.0 |
| Graduate Degree | 0 (0.0%) | 0.0 |
| Total | 37 (100.0%) | 32.0 |
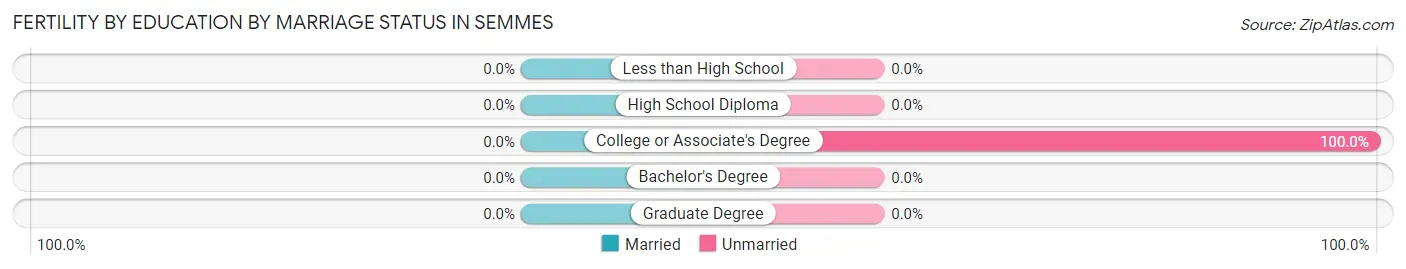
Fertility by Education by Marriage Status in Semmes
| Educational Attainment | Married | Unmarried |
| Less than High School | 0 (0.0%) | 0 (0.0%) |
| High School Diploma | 0 (0.0%) | 0 (0.0%) |
| College or Associate's Degree | 0 (0.0%) | 37 (100.0%) |
| Bachelor's Degree | 0 (0.0%) | 0 (0.0%) |
| Graduate Degree | 0 (0.0%) | 0 (0.0%) |
| Total | 0 (0.0%) | 37 (100.0%) |
Income in Semmes
Income Overview in Semmes
Per Capita Income in Semmes is $34,792, while median incomes of families and households are $74,291 and $61,433 respectively.
| Characteristic | Number | Measure |
| Per Capita Income | 5,123 | $34,792 |
| Median Family Income | 1,460 | $74,291 |
| Mean Family Income | 1,460 | $101,104 |
| Median Household Income | 2,209 | $61,433 |
| Mean Household Income | 2,209 | $80,646 |
| Income Deficit | 1,460 | $0 |
| Wage / Income Gap (%) | 5,123 | 16.52% |
| Wage / Income Gap ($) | 5,123 | 83.48¢ per $1 |
| Gini / Inequality Index | 5,123 | 0.46 |
Earnings by Sex in Semmes
Average Earnings in Semmes are $41,738, $42,360 for men and $35,363 for women, a difference of 16.5%.
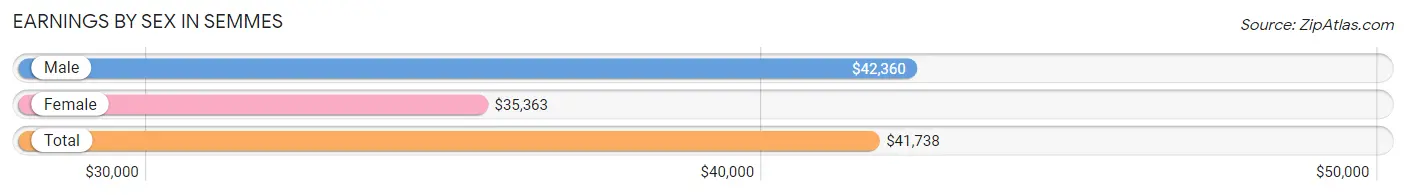
| Sex | Number | Average Earnings |
| Male | 1,168 (52.2%) | $42,360 |
| Female | 1,071 (47.8%) | $35,363 |
| Total | 2,239 (100.0%) | $41,738 |
Earnings by Sex by Income Bracket in Semmes
The most common earnings brackets in Semmes are $100,000+ for men (220 | 18.8%) and $100,000+ for women (193 | 18.0%).
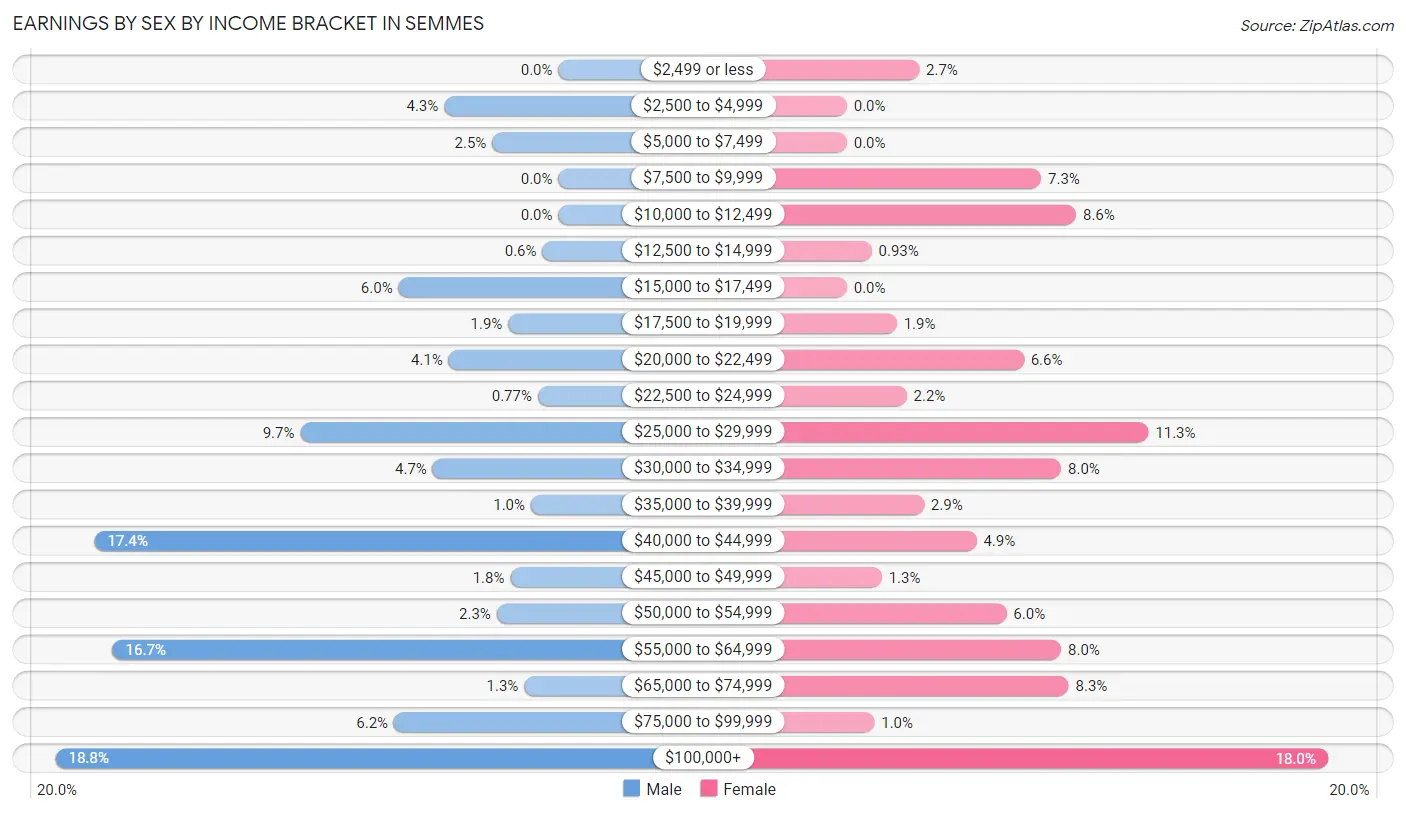
| Income | Male | Female |
| $2,499 or less | 0 (0.0%) | 29 (2.7%) |
| $2,500 to $4,999 | 50 (4.3%) | 0 (0.0%) |
| $5,000 to $7,499 | 29 (2.5%) | 0 (0.0%) |
| $7,500 to $9,999 | 0 (0.0%) | 78 (7.3%) |
| $10,000 to $12,499 | 0 (0.0%) | 92 (8.6%) |
| $12,500 to $14,999 | 7 (0.6%) | 10 (0.9%) |
| $15,000 to $17,499 | 70 (6.0%) | 0 (0.0%) |
| $17,500 to $19,999 | 22 (1.9%) | 20 (1.9%) |
| $20,000 to $22,499 | 48 (4.1%) | 71 (6.6%) |
| $22,500 to $24,999 | 9 (0.8%) | 24 (2.2%) |
| $25,000 to $29,999 | 113 (9.7%) | 121 (11.3%) |
| $30,000 to $34,999 | 55 (4.7%) | 86 (8.0%) |
| $35,000 to $39,999 | 12 (1.0%) | 31 (2.9%) |
| $40,000 to $44,999 | 203 (17.4%) | 52 (4.9%) |
| $45,000 to $49,999 | 21 (1.8%) | 14 (1.3%) |
| $50,000 to $54,999 | 27 (2.3%) | 64 (6.0%) |
| $55,000 to $64,999 | 195 (16.7%) | 86 (8.0%) |
| $65,000 to $74,999 | 15 (1.3%) | 89 (8.3%) |
| $75,000 to $99,999 | 72 (6.2%) | 11 (1.0%) |
| $100,000+ | 220 (18.8%) | 193 (18.0%) |
| Total | 1,168 (100.0%) | 1,071 (100.0%) |
Earnings by Sex by Educational Attainment in Semmes
Average earnings in Semmes are $53,194 for men and $44,567 for women, a difference of 16.2%. Men with an educational attainment of bachelor's degree enjoy the highest average annual earnings of $121,353, while those with high school diploma education earn the least with $41,374. Women with an educational attainment of graduate degree earn the most with the average annual earnings of $58,505, while those with college or associate's degree education have the smallest earnings of $40,769.
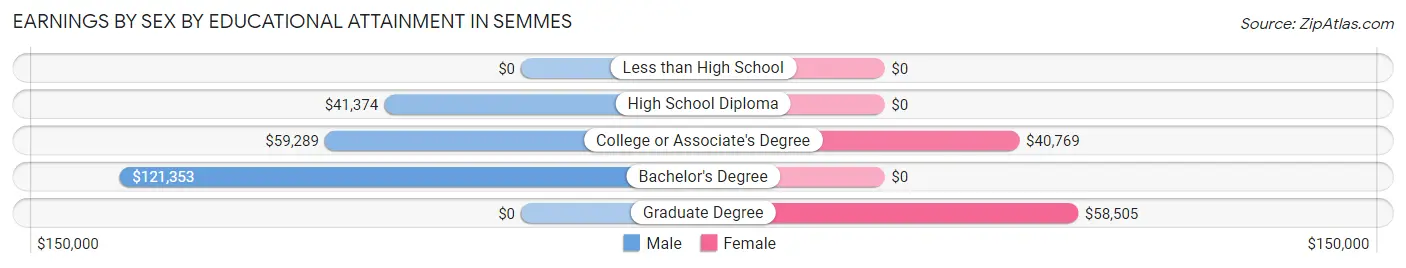
| Educational Attainment | Male Income | Female Income |
| Less than High School | - | - |
| High School Diploma | $41,374 | $0 |
| College or Associate's Degree | $59,289 | $40,769 |
| Bachelor's Degree | $121,353 | $0 |
| Graduate Degree | - | - |
| Total | $53,194 | $44,567 |
Family Income in Semmes
Family Income Brackets in Semmes
According to the Semmes family income data, there are 366 families falling into the $50,000 to $74,999 income range, which is the most common income bracket and makes up 25.1% of all families. Conversely, the less than $10,000 income bracket is the least frequent group with only 23 families (1.6%) belonging to this category.
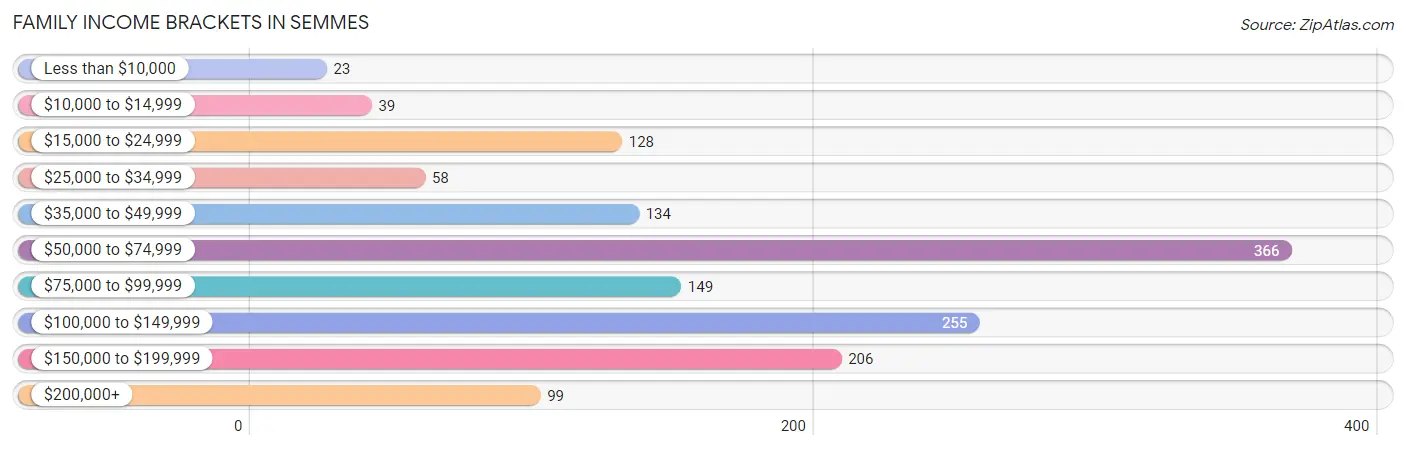
| Income Bracket | # Families | % Families |
| Less than $10,000 | 23 | 1.6% |
| $10,000 to $14,999 | 39 | 2.7% |
| $15,000 to $24,999 | 128 | 8.8% |
| $25,000 to $34,999 | 58 | 4.0% |
| $35,000 to $49,999 | 134 | 9.2% |
| $50,000 to $74,999 | 366 | 25.1% |
| $75,000 to $99,999 | 149 | 10.2% |
| $100,000 to $149,999 | 255 | 17.5% |
| $150,000 to $199,999 | 206 | 14.1% |
| $200,000+ | 99 | 6.8% |
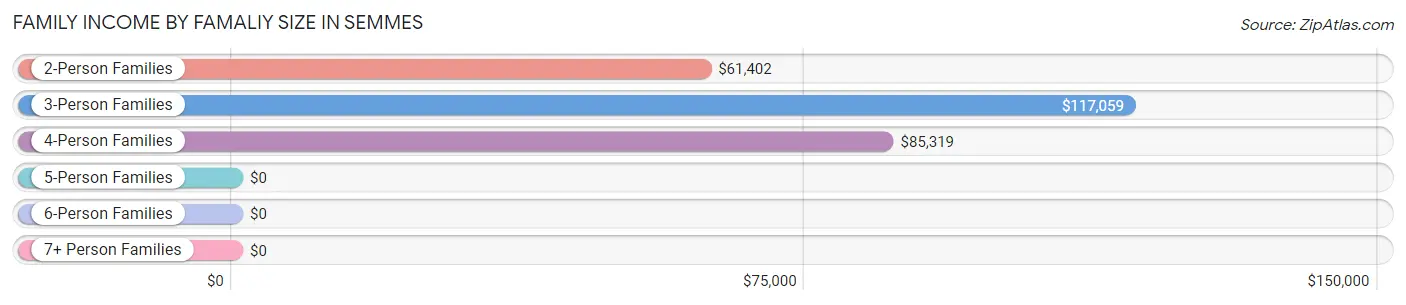
Family Income by Famaliy Size in Semmes
3-person families (232 | 15.9%) account for the highest median family income in Semmes with $117,059 per family, while 3-person families (232 | 15.9%) have the highest median income of $39,020 per family member.
| Income Bracket | # Families | Median Income |
| 2-Person Families | 831 (56.9%) | $61,402 |
| 3-Person Families | 232 (15.9%) | $117,059 |
| 4-Person Families | 293 (20.1%) | $85,319 |
| 5-Person Families | 40 (2.7%) | $0 |
| 6-Person Families | 47 (3.2%) | $0 |
| 7+ Person Families | 17 (1.2%) | $0 |
| Total | 1,460 (100.0%) | $74,291 |
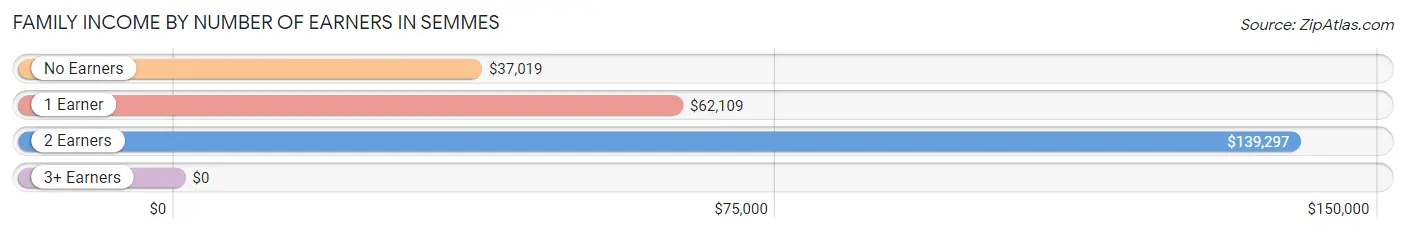
Family Income by Number of Earners in Semmes
| Number of Earners | # Families | Median Income |
| No Earners | 353 (24.2%) | $37,019 |
| 1 Earner | 488 (33.4%) | $62,109 |
| 2 Earners | 595 (40.7%) | $139,297 |
| 3+ Earners | 24 (1.6%) | $0 |
| Total | 1,460 (100.0%) | $74,291 |
Household Income in Semmes
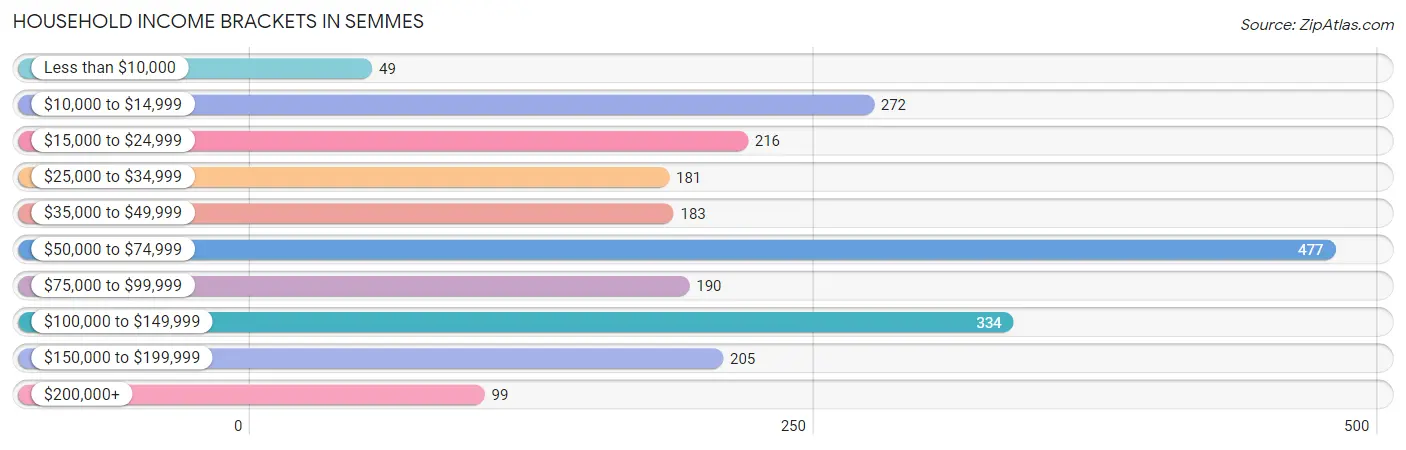
Household Income Brackets in Semmes
With 477 households falling in the category, the $50,000 to $74,999 income range is the most frequent in Semmes, accounting for 21.6% of all households. In contrast, only 49 households (2.2%) fall into the less than $10,000 income bracket, making it the least populous group.
| Income Bracket | # Households | % Households |
| Less than $10,000 | 49 | 2.2% |
| $10,000 to $14,999 | 272 | 12.3% |
| $15,000 to $24,999 | 216 | 9.8% |
| $25,000 to $34,999 | 181 | 8.2% |
| $35,000 to $49,999 | 183 | 8.3% |
| $50,000 to $74,999 | 477 | 21.6% |
| $75,000 to $99,999 | 190 | 8.6% |
| $100,000 to $149,999 | 334 | 15.1% |
| $150,000 to $199,999 | 205 | 9.3% |
| $200,000+ | 99 | 4.5% |
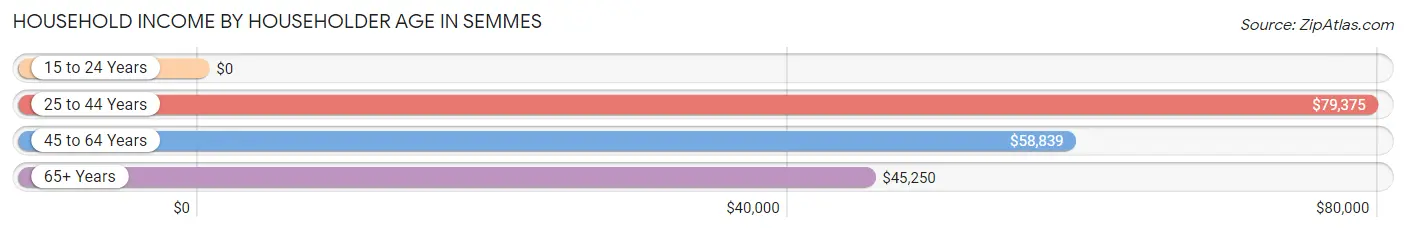
Household Income by Householder Age in Semmes
The median household income in Semmes is $61,433, with the highest median household income of $79,375 found in the 25 to 44 years age bracket for the primary householder. A total of 652 households (29.5%) fall into this category.
| Income Bracket | # Households | Median Income |
| 15 to 24 Years | 0 (0.0%) | $0 |
| 25 to 44 Years | 652 (29.5%) | $79,375 |
| 45 to 64 Years | 807 (36.5%) | $58,839 |
| 65+ Years | 750 (34.0%) | $45,250 |
| Total | 2,209 (100.0%) | $61,433 |
Poverty in Semmes
Income Below Poverty by Sex and Age in Semmes
With 16.8% poverty level for males and 16.5% for females among the residents of Semmes, 6 to 11 year old males and 16 and 17 year old females are the most vulnerable to poverty, with 74 males (62.7%) and 29 females (59.2%) in their respective age groups living below the poverty level.
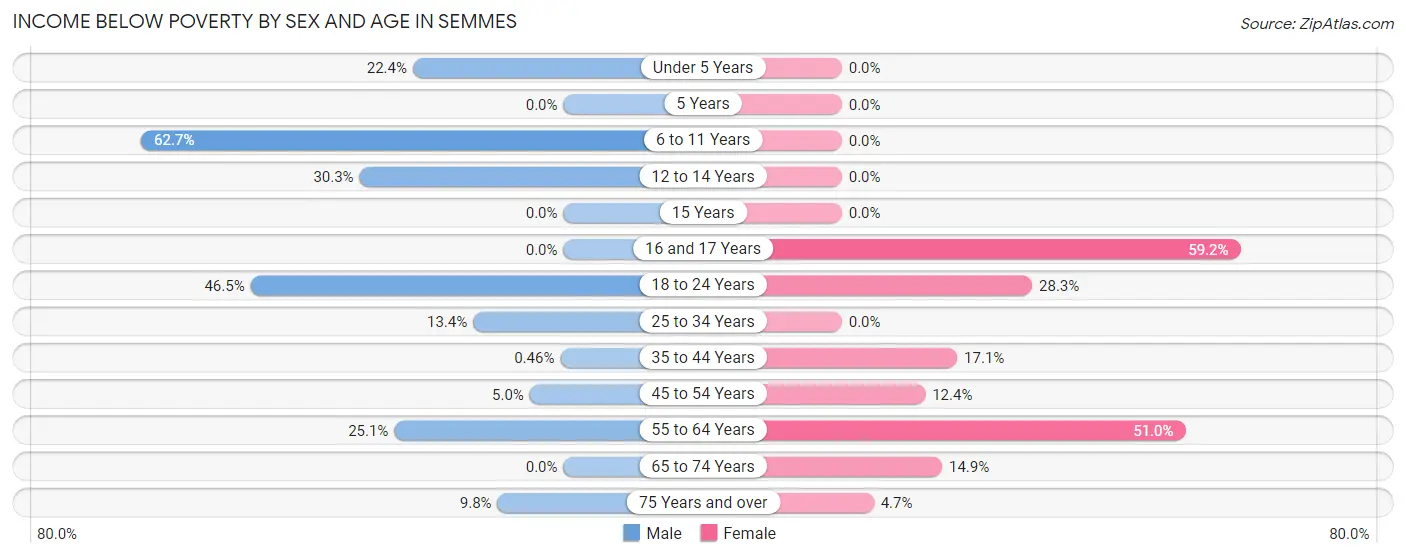
| Age Bracket | Male | Female |
| Under 5 Years | 38 (22.4%) | 0 (0.0%) |
| 5 Years | 0 (0.0%) | 0 (0.0%) |
| 6 to 11 Years | 74 (62.7%) | 0 (0.0%) |
| 12 to 14 Years | 43 (30.3%) | 0 (0.0%) |
| 15 Years | 0 (0.0%) | 0 (0.0%) |
| 16 and 17 Years | 0 (0.0%) | 29 (59.2%) |
| 18 to 24 Years | 92 (46.5%) | 39 (28.3%) |
| 25 to 34 Years | 33 (13.4%) | 0 (0.0%) |
| 35 to 44 Years | 2 (0.5%) | 62 (17.1%) |
| 45 to 54 Years | 3 (5.0%) | 59 (12.4%) |
| 55 to 64 Years | 103 (25.1%) | 178 (51.0%) |
| 65 to 74 Years | 0 (0.0%) | 74 (14.9%) |
| 75 Years and over | 14 (9.8%) | 10 (4.7%) |
| Total | 402 (16.8%) | 451 (16.5%) |
Income Above Poverty by Sex and Age in Semmes
According to the poverty statistics in Semmes, males aged 16 and 17 years and females aged under 5 years are the age groups that are most secure financially, with 100.0% of males and 100.0% of females in these age groups living above the poverty line.
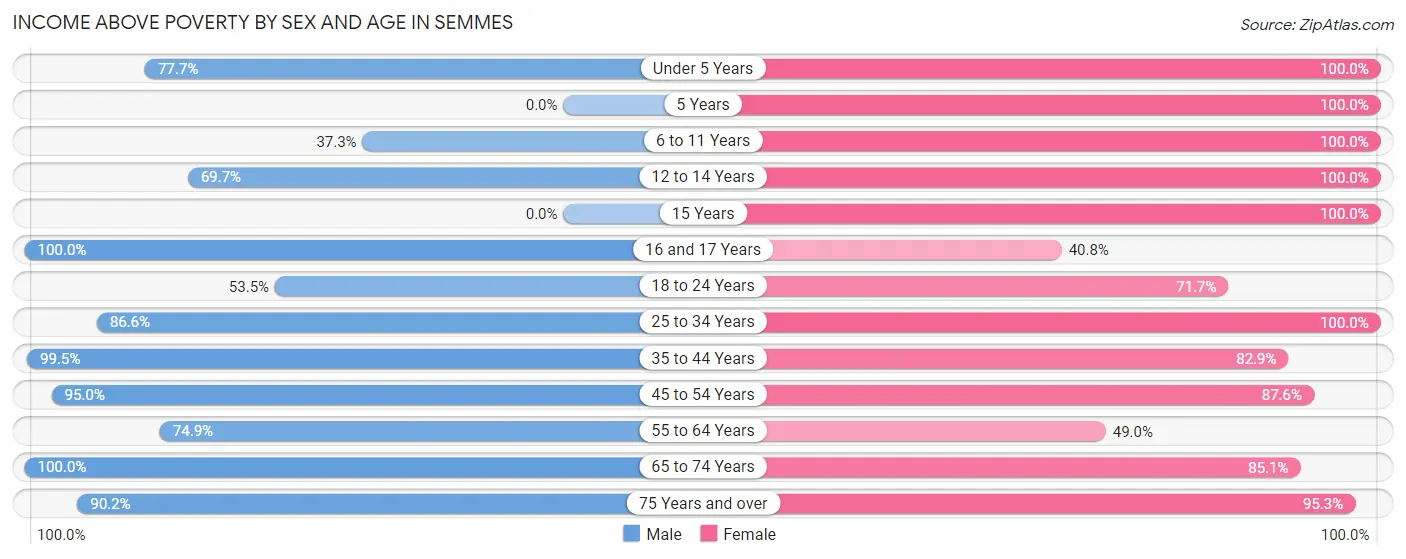
| Age Bracket | Male | Female |
| Under 5 Years | 132 (77.6%) | 35 (100.0%) |
| 5 Years | 0 (0.0%) | 70 (100.0%) |
| 6 to 11 Years | 44 (37.3%) | 210 (100.0%) |
| 12 to 14 Years | 99 (69.7%) | 90 (100.0%) |
| 15 Years | 0 (0.0%) | 10 (100.0%) |
| 16 and 17 Years | 38 (100.0%) | 20 (40.8%) |
| 18 to 24 Years | 106 (53.5%) | 99 (71.7%) |
| 25 to 34 Years | 213 (86.6%) | 239 (100.0%) |
| 35 to 44 Years | 430 (99.5%) | 300 (82.9%) |
| 45 to 54 Years | 57 (95.0%) | 417 (87.6%) |
| 55 to 64 Years | 307 (74.9%) | 171 (49.0%) |
| 65 to 74 Years | 430 (100.0%) | 423 (85.1%) |
| 75 Years and over | 129 (90.2%) | 201 (95.3%) |
| Total | 1,985 (83.2%) | 2,285 (83.5%) |
Income Below Poverty Among Married-Couple Families in Semmes
The poverty statistics for married-couple families in Semmes show that 4.6% or 50 of the total 1,086 families live below the poverty line. Families with 1 or 2 children have the highest poverty rate of 9.6%, comprising of 28 families. On the other hand, families with 3 or 4 children have the lowest poverty rate of 0.0%, which includes 0 families.
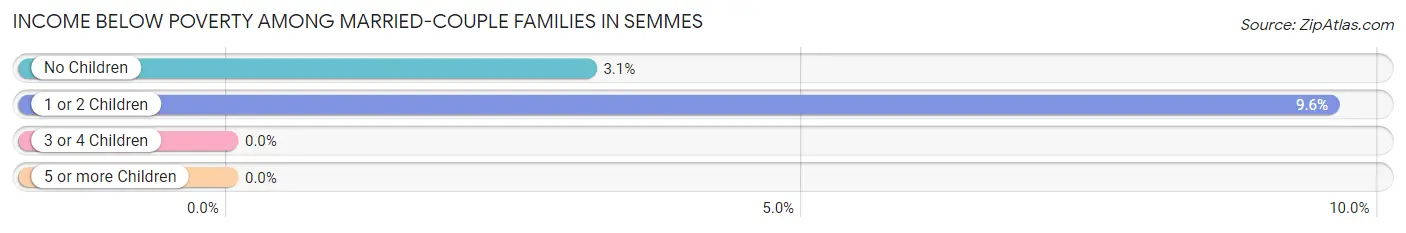
| Children | Above Poverty | Below Poverty |
| No Children | 683 (96.9%) | 22 (3.1%) |
| 1 or 2 Children | 264 (90.4%) | 28 (9.6%) |
| 3 or 4 Children | 72 (100.0%) | 0 (0.0%) |
| 5 or more Children | 17 (100.0%) | 0 (0.0%) |
| Total | 1,036 (95.4%) | 50 (4.6%) |
Income Below Poverty Among Single-Parent Households in Semmes
According to the poverty data in Semmes, 11.3% or 23 single-father households and 22.9% or 39 single-mother households are living below the poverty line. Among single-father households, those with 1 or 2 children have the highest poverty rate, with 23 households (100.0%) experiencing poverty. Likewise, among single-mother households, those with 1 or 2 children have the highest poverty rate, with 39 households (36.4%) falling below the poverty line.
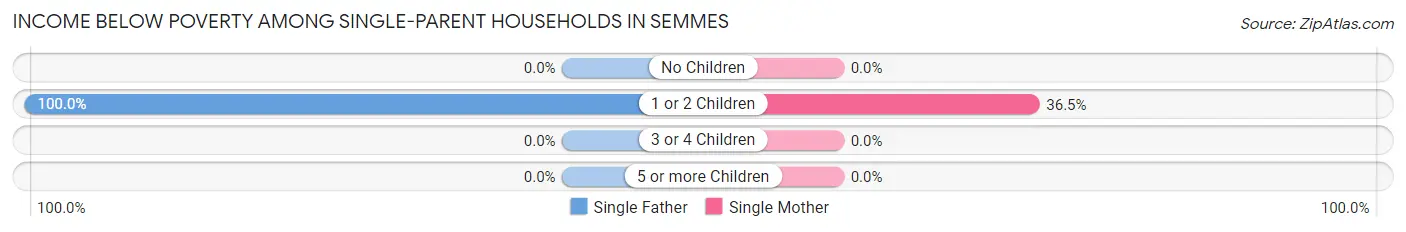
| Children | Single Father | Single Mother |
| No Children | 0 (0.0%) | 0 (0.0%) |
| 1 or 2 Children | 23 (100.0%) | 39 (36.4%) |
| 3 or 4 Children | 0 (0.0%) | 0 (0.0%) |
| 5 or more Children | 0 (0.0%) | 0 (0.0%) |
| Total | 23 (11.3%) | 39 (22.9%) |
Income Below Poverty Among Married-Couple vs Single-Parent Households in Semmes
The poverty data for Semmes shows that 50 of the married-couple family households (4.6%) and 62 of the single-parent households (16.6%) are living below the poverty level. Within the married-couple family households, those with 1 or 2 children have the highest poverty rate, with 28 households (9.6%) falling below the poverty line. Among the single-parent households, those with 1 or 2 children have the highest poverty rate, with 62 household (47.7%) living below poverty.
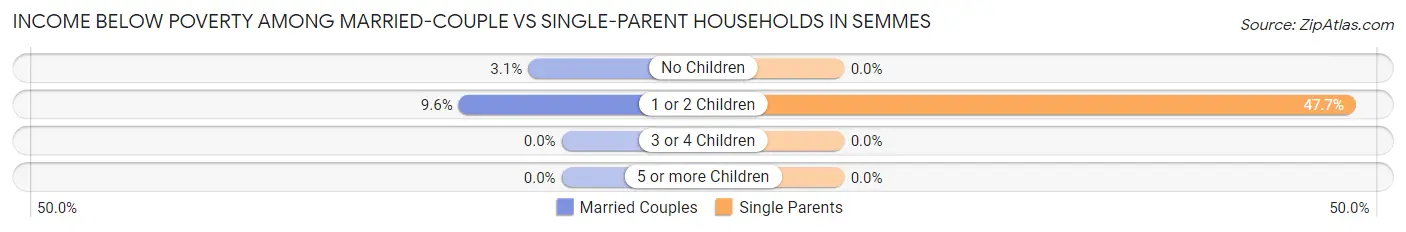
| Children | Married-Couple Families | Single-Parent Households |
| No Children | 22 (3.1%) | 0 (0.0%) |
| 1 or 2 Children | 28 (9.6%) | 62 (47.7%) |
| 3 or 4 Children | 0 (0.0%) | 0 (0.0%) |
| 5 or more Children | 0 (0.0%) | 0 (0.0%) |
| Total | 50 (4.6%) | 62 (16.6%) |
Employment Characteristics in Semmes
Employment by Class of Employer in Semmes
Among the 2,107 employed individuals in Semmes, private company employees (1,336 | 63.4%), local government employees (318 | 15.1%), and not-for-profit organizations (205 | 9.7%) make up the most common classes of employment.
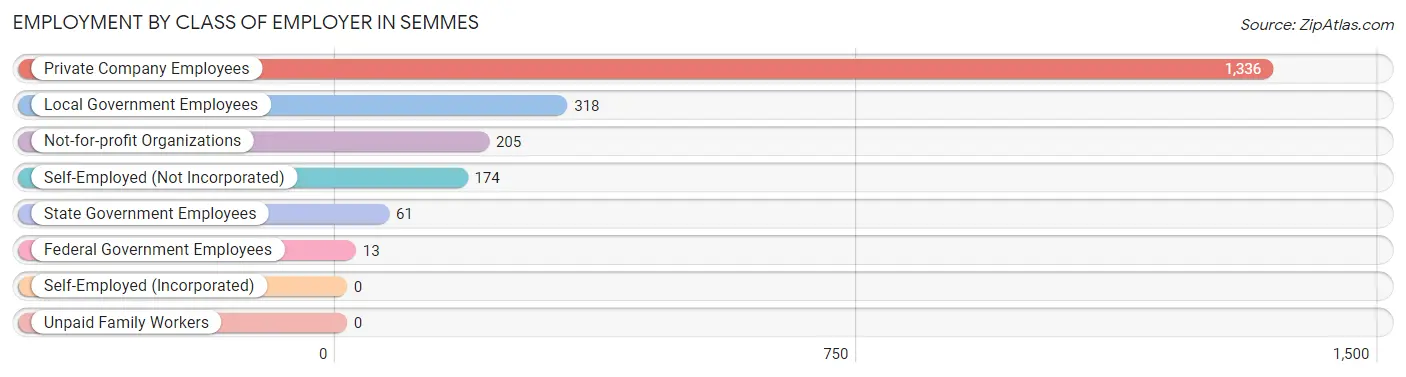
| Employer Class | # Employees | % Employees |
| Private Company Employees | 1,336 | 63.4% |
| Self-Employed (Incorporated) | 0 | 0.0% |
| Self-Employed (Not Incorporated) | 174 | 8.3% |
| Not-for-profit Organizations | 205 | 9.7% |
| Local Government Employees | 318 | 15.1% |
| State Government Employees | 61 | 2.9% |
| Federal Government Employees | 13 | 0.6% |
| Unpaid Family Workers | 0 | 0.0% |
| Total | 2,107 | 100.0% |
Employment Status by Age in Semmes
According to the labor force statistics for Semmes, out of the total population over 16 years of age (4,278), 50.4% or 2,156 individuals are in the labor force, with 2.3% or 50 of them unemployed. The age group with the highest labor force participation rate is 20 to 24 years, with 99.5% or 215 individuals in the labor force. Within the labor force, the 16 to 19 years age range has the highest percentage of unemployed individuals, with 34.8% or 31 of them being unemployed.
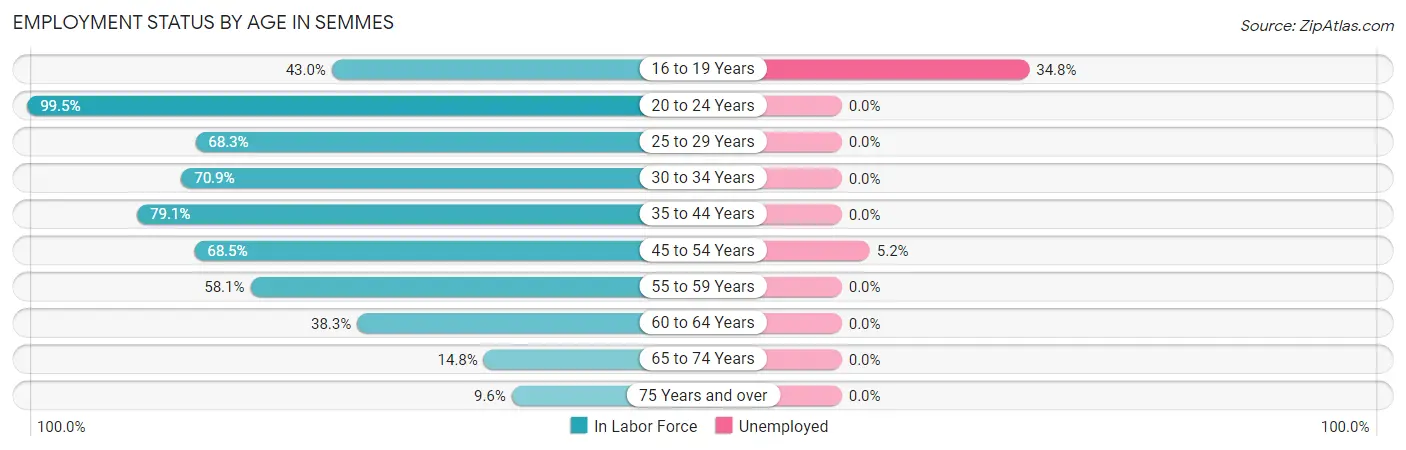
| Age Bracket | In Labor Force | Unemployed |
| 16 to 19 Years | 89 (43.0%) | 31 (34.8%) |
| 20 to 24 Years | 215 (99.5%) | 0 (0.0%) |
| 25 to 29 Years | 125 (68.3%) | 0 (0.0%) |
| 30 to 34 Years | 214 (70.9%) | 0 (0.0%) |
| 35 to 44 Years | 628 (79.1%) | 0 (0.0%) |
| 45 to 54 Years | 367 (68.5%) | 19 (5.2%) |
| 55 to 59 Years | 168 (58.1%) | 0 (0.0%) |
| 60 to 64 Years | 180 (38.3%) | 0 (0.0%) |
| 65 to 74 Years | 137 (14.8%) | 0 (0.0%) |
| 75 Years and over | 34 (9.6%) | 0 (0.0%) |
| Total | 2,156 (50.4%) | 50 (2.3%) |
Employment Status by Educational Attainment in Semmes
According to labor force statistics for Semmes, 65.3% of individuals (1,681) out of the total population between 25 and 64 years of age (2,574) are in the labor force, with 1.1% or 18 of them being unemployed. The group with the highest labor force participation rate are those with the educational attainment of college / associate degree, with 80.2% or 516 individuals in the labor force. Within the labor force, individuals with less than high school education have the highest percentage of unemployment, with 67.9% or 19 of them being unemployed.
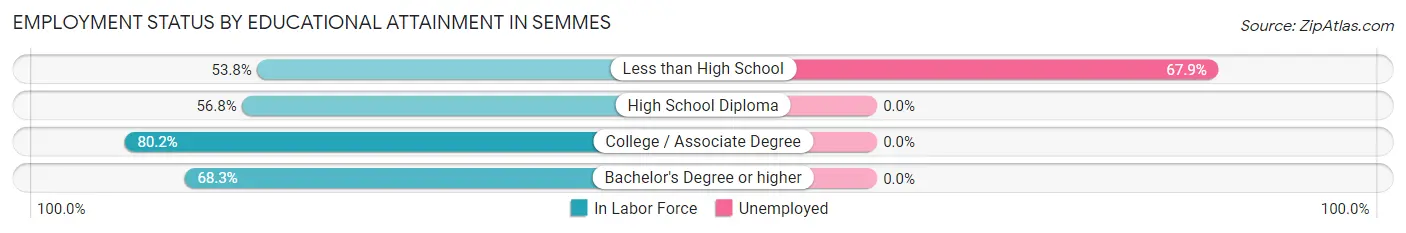
| Educational Attainment | In Labor Force | Unemployed |
| Less than High School | 28 (53.8%) | 35 (67.9%) |
| High School Diploma | 716 (56.8%) | 0 (0.0%) |
| College / Associate Degree | 516 (80.2%) | 0 (0.0%) |
| Bachelor's Degree or higher | 422 (68.3%) | 0 (0.0%) |
| Total | 1,681 (65.3%) | 28 (1.1%) |
Employment Occupations by Sex in Semmes
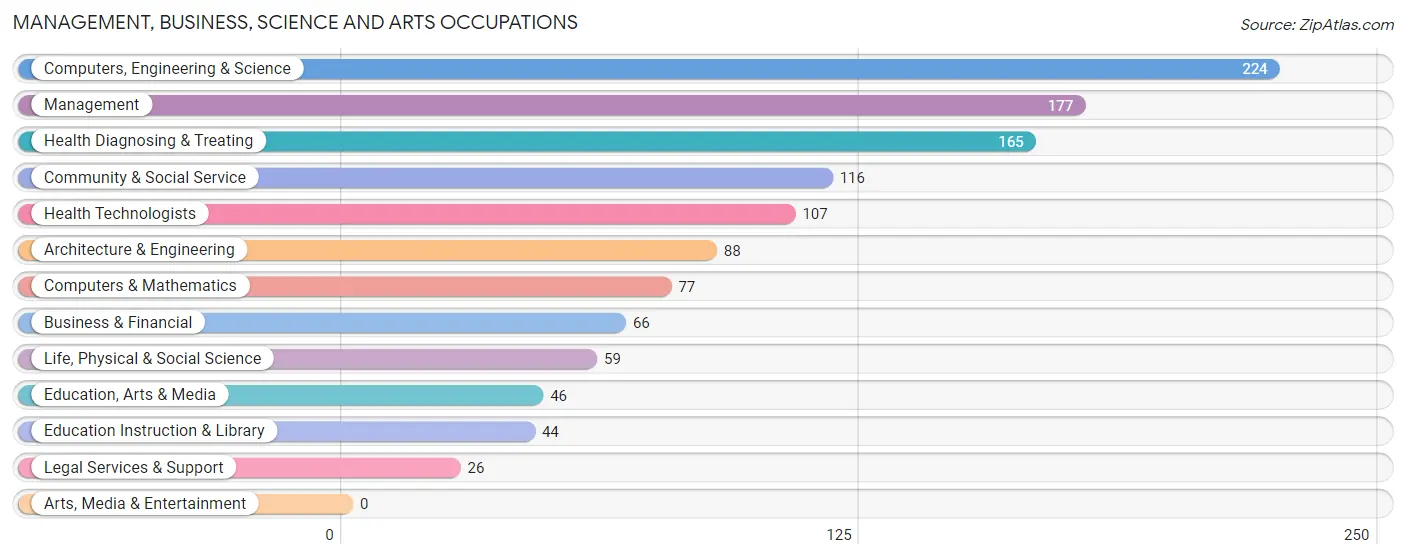
Management, Business, Science and Arts Occupations
The most common Management, Business, Science and Arts occupations in Semmes are Computers, Engineering & Science (224 | 10.6%), Management (177 | 8.4%), Health Diagnosing & Treating (165 | 7.8%), Community & Social Service (116 | 5.5%), and Health Technologists (107 | 5.1%).
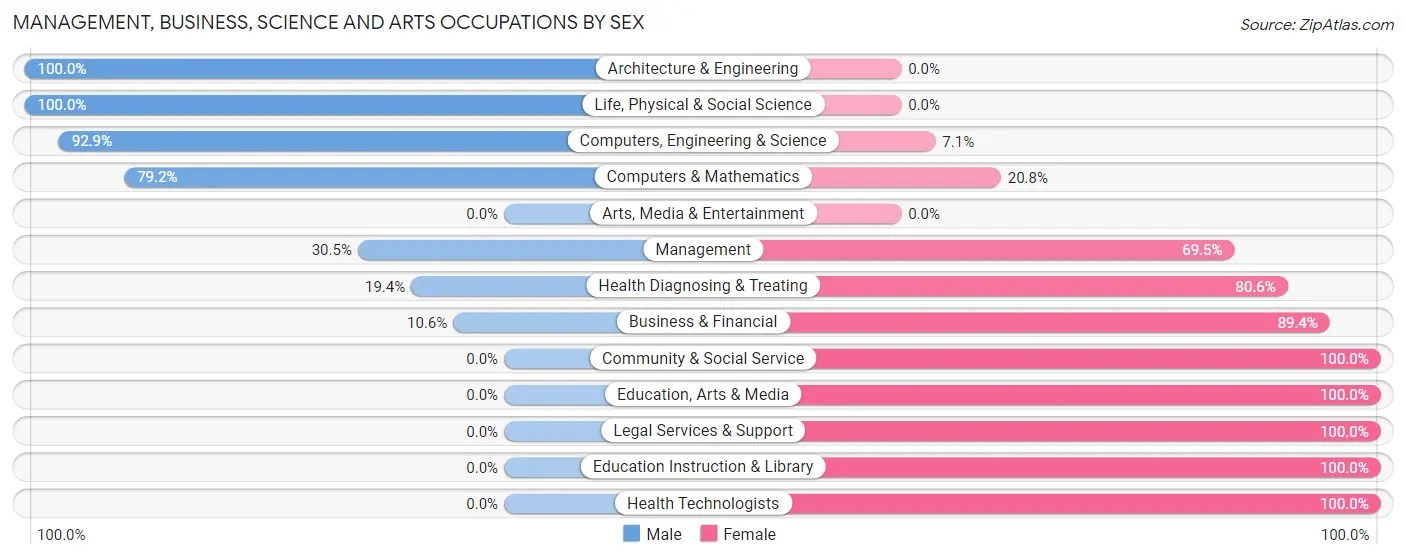
Management, Business, Science and Arts Occupations by Sex
Within the Management, Business, Science and Arts occupations in Semmes, the most male-oriented occupations are Architecture & Engineering (100.0%), Life, Physical & Social Science (100.0%), and Computers, Engineering & Science (92.9%), while the most female-oriented occupations are Community & Social Service (100.0%), Education, Arts & Media (100.0%), and Legal Services & Support (100.0%).
| Occupation | Male | Female |
| Management | 54 (30.5%) | 123 (69.5%) |
| Business & Financial | 7 (10.6%) | 59 (89.4%) |
| Computers, Engineering & Science | 208 (92.9%) | 16 (7.1%) |
| Computers & Mathematics | 61 (79.2%) | 16 (20.8%) |
| Architecture & Engineering | 88 (100.0%) | 0 (0.0%) |
| Life, Physical & Social Science | 59 (100.0%) | 0 (0.0%) |
| Community & Social Service | 0 (0.0%) | 116 (100.0%) |
| Education, Arts & Media | 0 (0.0%) | 46 (100.0%) |
| Legal Services & Support | 0 (0.0%) | 26 (100.0%) |
| Education Instruction & Library | 0 (0.0%) | 44 (100.0%) |
| Arts, Media & Entertainment | 0 (0.0%) | 0 (0.0%) |
| Health Diagnosing & Treating | 32 (19.4%) | 133 (80.6%) |
| Health Technologists | 0 (0.0%) | 107 (100.0%) |
| Total (Category) | 301 (40.2%) | 447 (59.8%) |
| Total (Overall) | 1,161 (55.1%) | 946 (44.9%) |
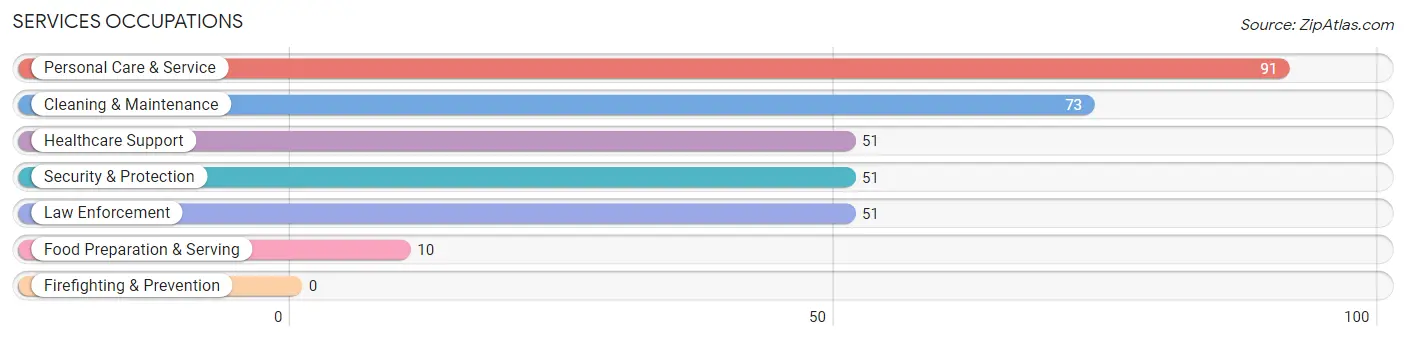
Services Occupations
The most common Services occupations in Semmes are Personal Care & Service (91 | 4.3%), Cleaning & Maintenance (73 | 3.5%), Healthcare Support (51 | 2.4%), Security & Protection (51 | 2.4%), and Law Enforcement (51 | 2.4%).
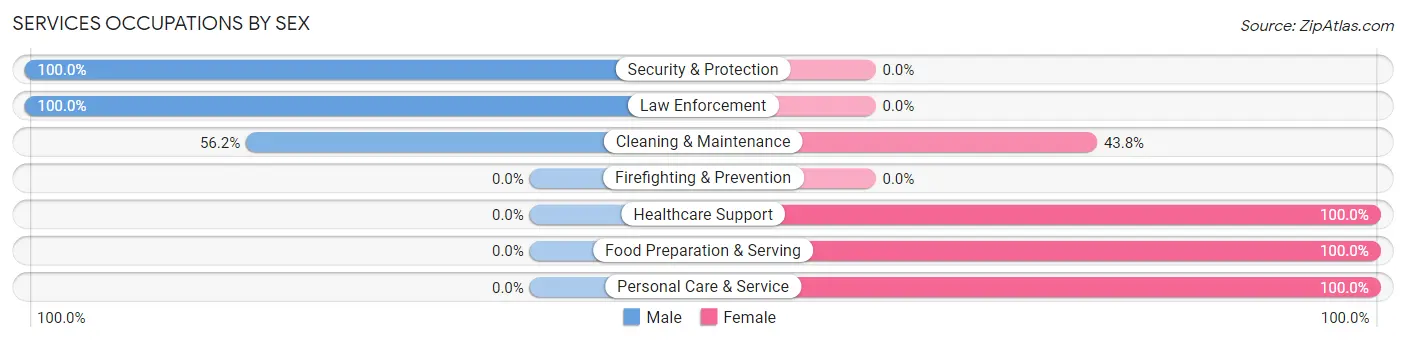
Services Occupations by Sex
Within the Services occupations in Semmes, the most male-oriented occupations are Security & Protection (100.0%), Law Enforcement (100.0%), and Cleaning & Maintenance (56.2%), while the most female-oriented occupations are Healthcare Support (100.0%), Food Preparation & Serving (100.0%), and Personal Care & Service (100.0%).
| Occupation | Male | Female |
| Healthcare Support | 0 (0.0%) | 51 (100.0%) |
| Security & Protection | 51 (100.0%) | 0 (0.0%) |
| Firefighting & Prevention | 0 (0.0%) | 0 (0.0%) |
| Law Enforcement | 51 (100.0%) | 0 (0.0%) |
| Food Preparation & Serving | 0 (0.0%) | 10 (100.0%) |
| Cleaning & Maintenance | 41 (56.2%) | 32 (43.8%) |
| Personal Care & Service | 0 (0.0%) | 91 (100.0%) |
| Total (Category) | 92 (33.3%) | 184 (66.7%) |
| Total (Overall) | 1,161 (55.1%) | 946 (44.9%) |
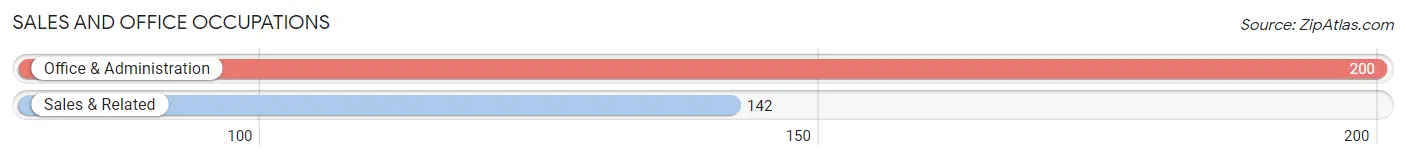
Sales and Office Occupations
The most common Sales and Office occupations in Semmes are Office & Administration (200 | 9.5%), and Sales & Related (142 | 6.7%).
Sales and Office Occupations by Sex
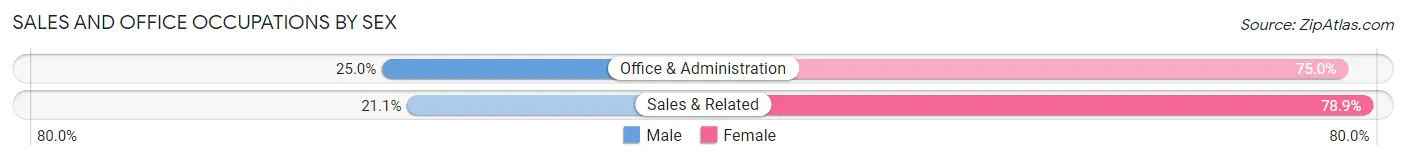
| Occupation | Male | Female |
| Sales & Related | 30 (21.1%) | 112 (78.9%) |
| Office & Administration | 50 (25.0%) | 150 (75.0%) |
| Total (Category) | 80 (23.4%) | 262 (76.6%) |
| Total (Overall) | 1,161 (55.1%) | 946 (44.9%) |
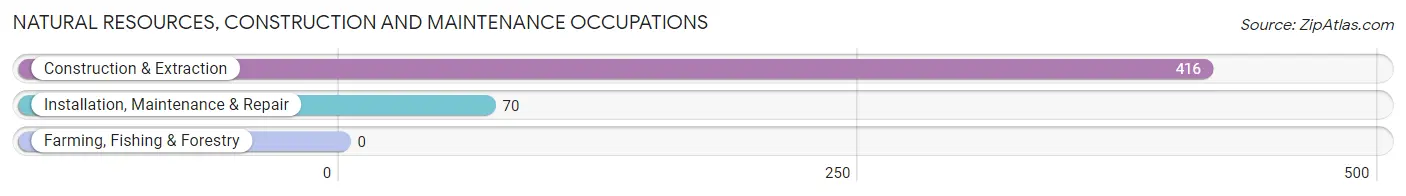
Natural Resources, Construction and Maintenance Occupations
The most common Natural Resources, Construction and Maintenance occupations in Semmes are Construction & Extraction (416 | 19.7%), and Installation, Maintenance & Repair (70 | 3.3%).
Natural Resources, Construction and Maintenance Occupations by Sex
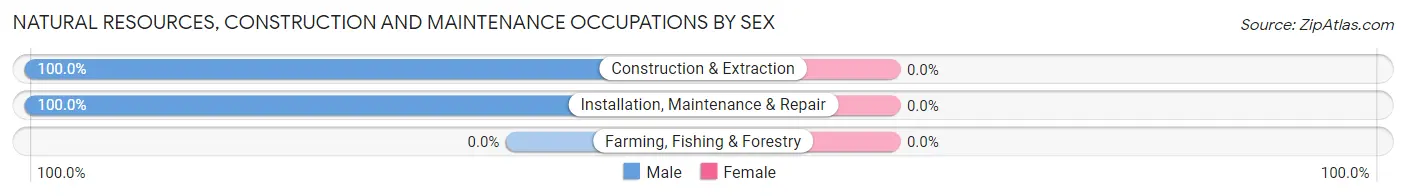
| Occupation | Male | Female |
| Farming, Fishing & Forestry | 0 (0.0%) | 0 (0.0%) |
| Construction & Extraction | 416 (100.0%) | 0 (0.0%) |
| Installation, Maintenance & Repair | 70 (100.0%) | 0 (0.0%) |
| Total (Category) | 486 (100.0%) | 0 (0.0%) |
| Total (Overall) | 1,161 (55.1%) | 946 (44.9%) |
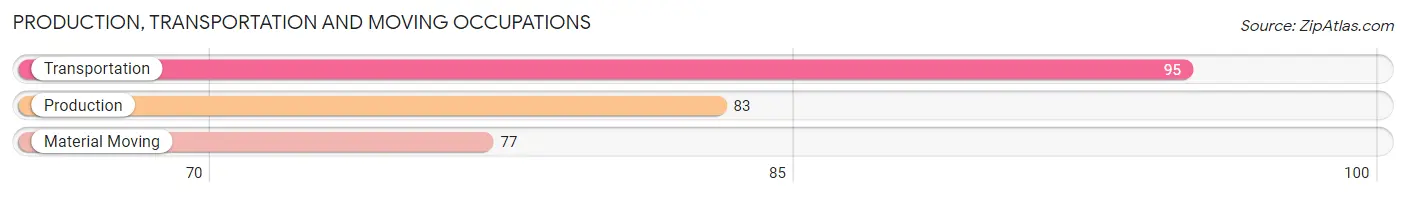
Production, Transportation and Moving Occupations
The most common Production, Transportation and Moving occupations in Semmes are Transportation (95 | 4.5%), Production (83 | 3.9%), and Material Moving (77 | 3.6%).
Production, Transportation and Moving Occupations by Sex
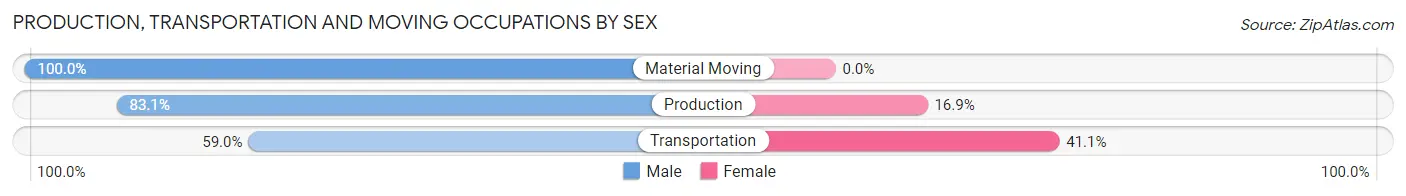
| Occupation | Male | Female |
| Production | 69 (83.1%) | 14 (16.9%) |
| Transportation | 56 (59.0%) | 39 (41.0%) |
| Material Moving | 77 (100.0%) | 0 (0.0%) |
| Total (Category) | 202 (79.2%) | 53 (20.8%) |
| Total (Overall) | 1,161 (55.1%) | 946 (44.9%) |
Employment Industries by Sex in Semmes
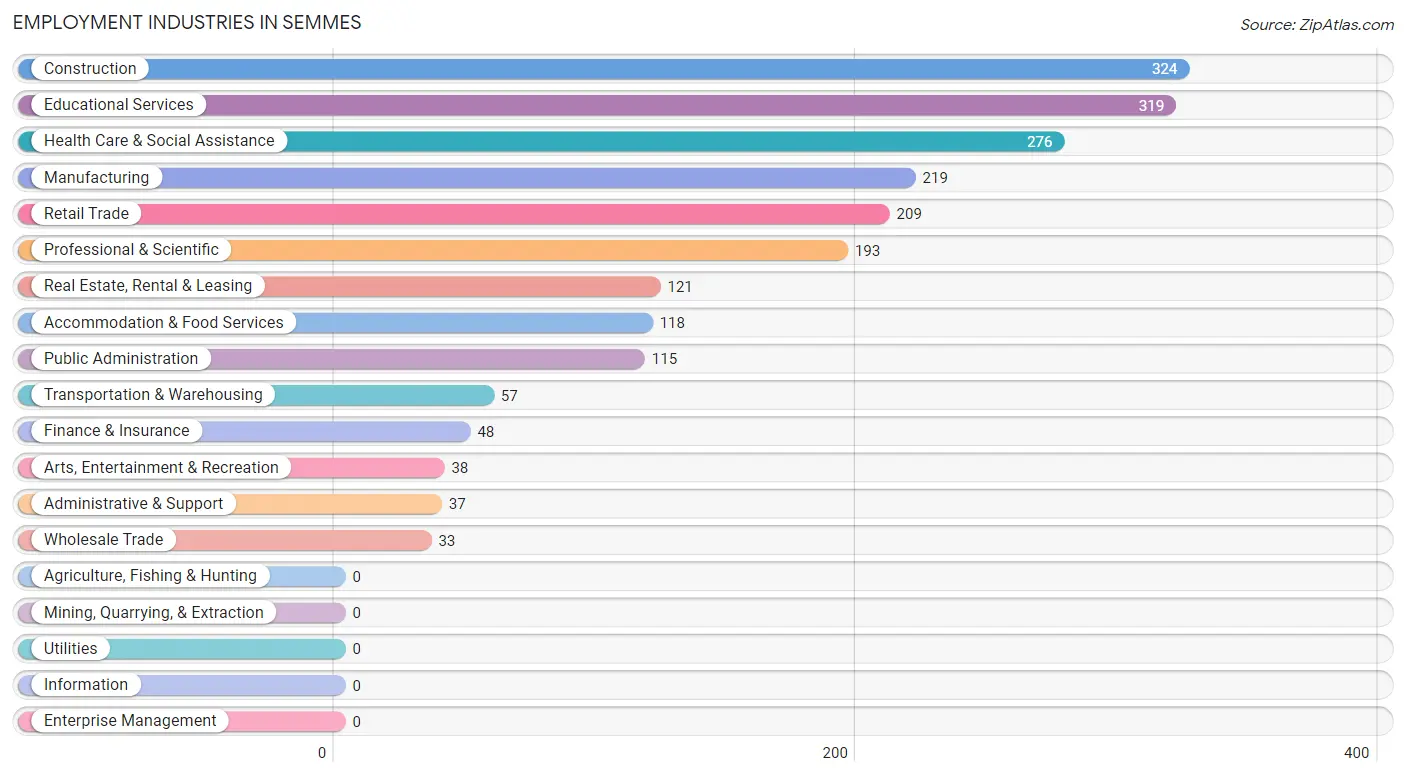
Employment Industries in Semmes
The major employment industries in Semmes include Construction (324 | 15.4%), Educational Services (319 | 15.1%), Health Care & Social Assistance (276 | 13.1%), Manufacturing (219 | 10.4%), and Retail Trade (209 | 9.9%).
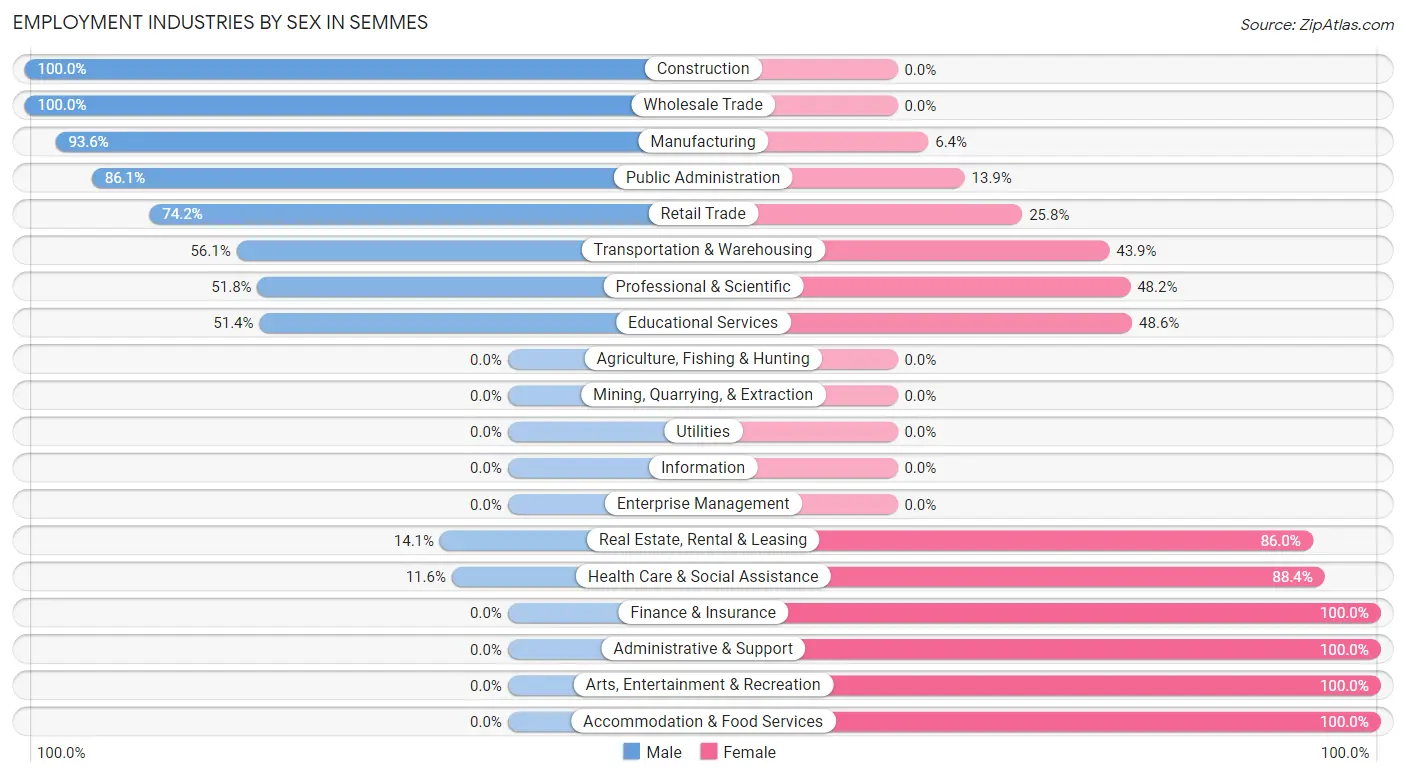
Employment Industries by Sex in Semmes
The Semmes industries that see more men than women are Construction (100.0%), Wholesale Trade (100.0%), and Manufacturing (93.6%), whereas the industries that tend to have a higher number of women are Finance & Insurance (100.0%), Administrative & Support (100.0%), and Arts, Entertainment & Recreation (100.0%).
| Industry | Male | Female |
| Agriculture, Fishing & Hunting | 0 (0.0%) | 0 (0.0%) |
| Mining, Quarrying, & Extraction | 0 (0.0%) | 0 (0.0%) |
| Construction | 324 (100.0%) | 0 (0.0%) |
| Manufacturing | 205 (93.6%) | 14 (6.4%) |
| Wholesale Trade | 33 (100.0%) | 0 (0.0%) |
| Retail Trade | 155 (74.2%) | 54 (25.8%) |
| Transportation & Warehousing | 32 (56.1%) | 25 (43.9%) |
| Utilities | 0 (0.0%) | 0 (0.0%) |
| Information | 0 (0.0%) | 0 (0.0%) |
| Finance & Insurance | 0 (0.0%) | 48 (100.0%) |
| Real Estate, Rental & Leasing | 17 (14.1%) | 104 (86.0%) |
| Professional & Scientific | 100 (51.8%) | 93 (48.2%) |
| Enterprise Management | 0 (0.0%) | 0 (0.0%) |
| Administrative & Support | 0 (0.0%) | 37 (100.0%) |
| Educational Services | 164 (51.4%) | 155 (48.6%) |
| Health Care & Social Assistance | 32 (11.6%) | 244 (88.4%) |
| Arts, Entertainment & Recreation | 0 (0.0%) | 38 (100.0%) |
| Accommodation & Food Services | 0 (0.0%) | 118 (100.0%) |
| Public Administration | 99 (86.1%) | 16 (13.9%) |
| Total | 1,161 (55.1%) | 946 (44.9%) |
Education in Semmes
School Enrollment in Semmes
The most common levels of schooling among the 1,059 students in Semmes are high school (301 | 28.4%), middle school (186 | 17.6%), and college / undergraduate (175 | 16.5%).
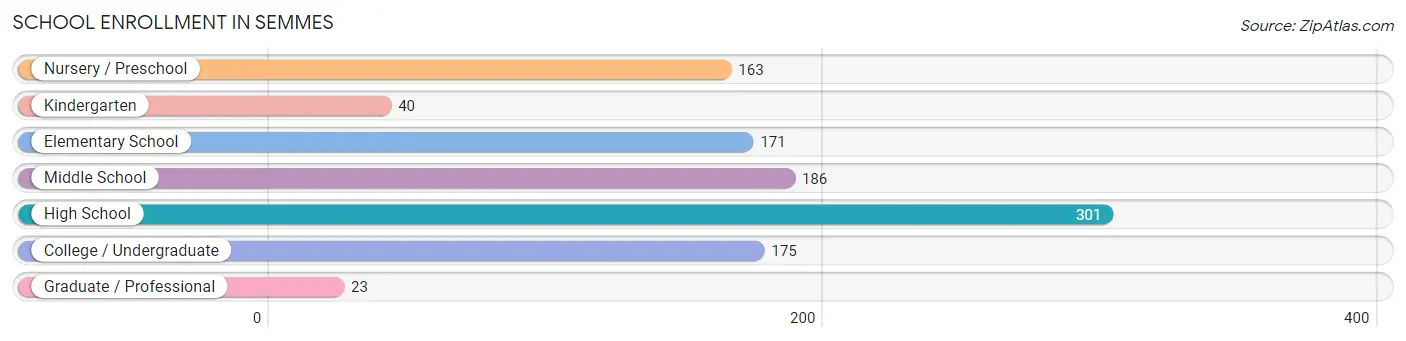
| School Level | # Students | % Students |
| Nursery / Preschool | 163 | 15.4% |
| Kindergarten | 40 | 3.8% |
| Elementary School | 171 | 16.2% |
| Middle School | 186 | 17.6% |
| High School | 301 | 28.4% |
| College / Undergraduate | 175 | 16.5% |
| Graduate / Professional | 23 | 2.2% |
| Total | 1,059 | 100.0% |
School Enrollment by Age by Funding Source in Semmes
Out of a total of 1,059 students who are enrolled in schools in Semmes, 196 (18.5%) attend a private institution, while the remaining 863 (81.5%) are enrolled in public schools. The age group of 5 to 9 year old has the highest likelihood of being enrolled in private schools, with 128 (45.6% in the age bracket) enrolled. Conversely, the age group of 18 to 19 year olds has the lowest likelihood of being enrolled in a private school, with 120 (100.0% in the age bracket) attending a public institution.
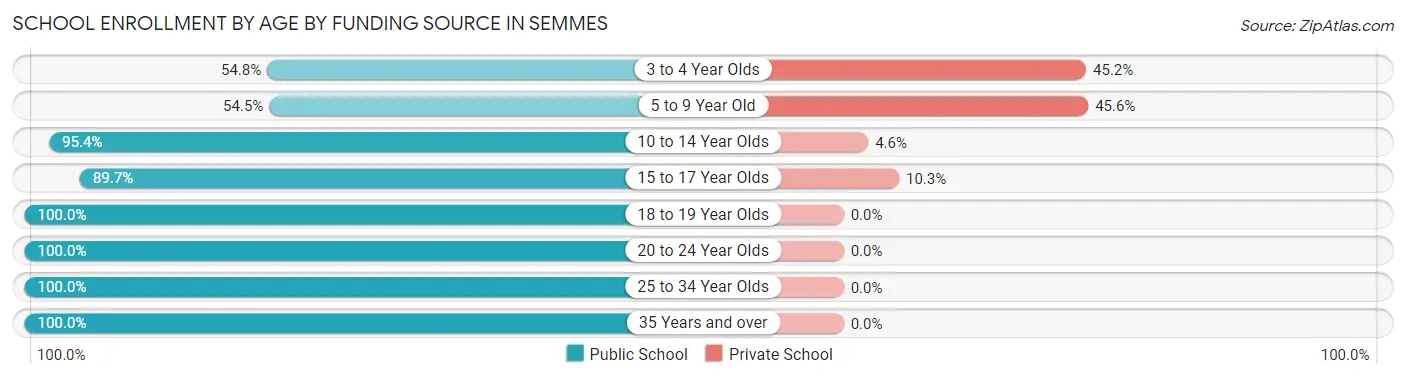
| Age Bracket | Public School | Private School |
| 3 to 4 Year Olds | 51 (54.8%) | 42 (45.2%) |
| 5 to 9 Year Old | 153 (54.4%) | 128 (45.6%) |
| 10 to 14 Year Olds | 333 (95.4%) | 16 (4.6%) |
| 15 to 17 Year Olds | 87 (89.7%) | 10 (10.3%) |
| 18 to 19 Year Olds | 120 (100.0%) | 0 (0.0%) |
| 20 to 24 Year Olds | 57 (100.0%) | 0 (0.0%) |
| 25 to 34 Year Olds | 23 (100.0%) | 0 (0.0%) |
| 35 Years and over | 39 (100.0%) | 0 (0.0%) |
| Total | 863 (81.5%) | 196 (18.5%) |
Educational Attainment by Field of Study in Semmes
Business (262 | 30.5%), education (196 | 22.8%), science & technology (129 | 15.0%), social sciences (73 | 8.5%), and arts & humanities (69 | 8.0%) are the most common fields of study among 859 individuals in Semmes who have obtained a bachelor's degree or higher.
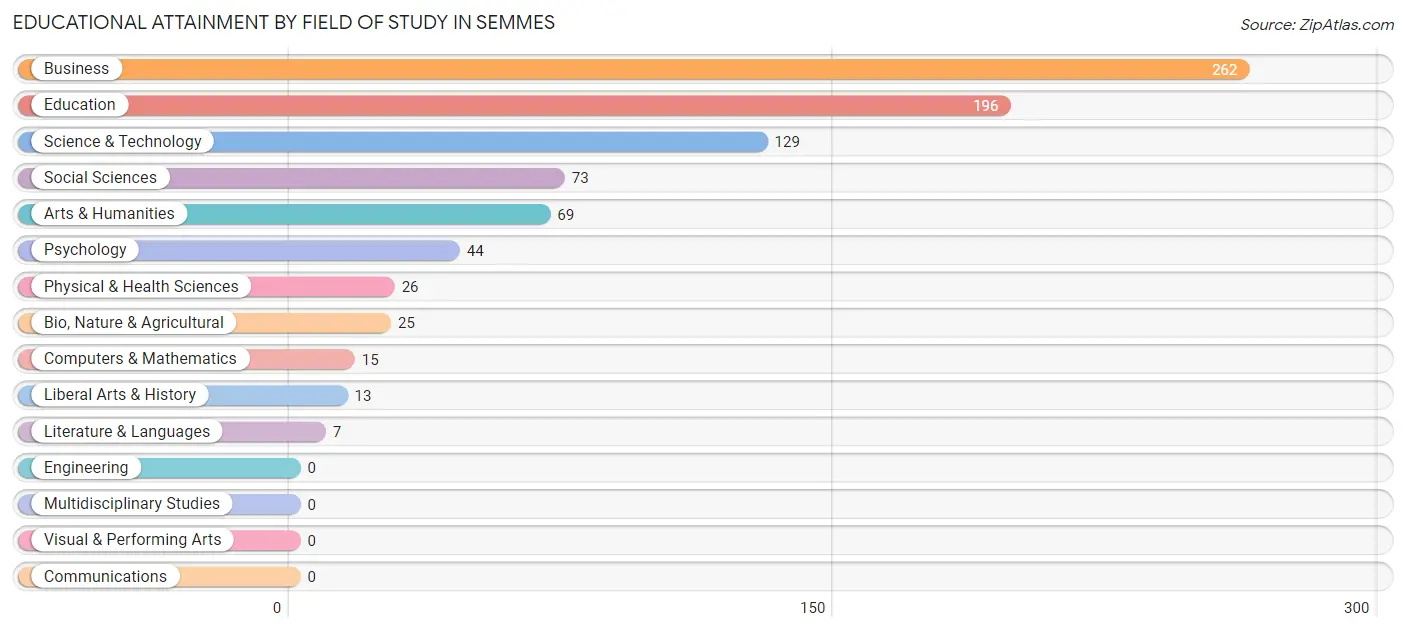
| Field of Study | # Graduates | % Graduates |
| Computers & Mathematics | 15 | 1.8% |
| Bio, Nature & Agricultural | 25 | 2.9% |
| Physical & Health Sciences | 26 | 3.0% |
| Psychology | 44 | 5.1% |
| Social Sciences | 73 | 8.5% |
| Engineering | 0 | 0.0% |
| Multidisciplinary Studies | 0 | 0.0% |
| Science & Technology | 129 | 15.0% |
| Business | 262 | 30.5% |
| Education | 196 | 22.8% |
| Literature & Languages | 7 | 0.8% |
| Liberal Arts & History | 13 | 1.5% |
| Visual & Performing Arts | 0 | 0.0% |
| Communications | 0 | 0.0% |
| Arts & Humanities | 69 | 8.0% |
| Total | 859 | 100.0% |
Transportation & Commute in Semmes
Vehicle Availability by Sex in Semmes
The most prevalent vehicle ownership categories in Semmes are males with 2 vehicles (604, accounting for 52.4%) and females with 2 vehicles (550, making up 63.8%).
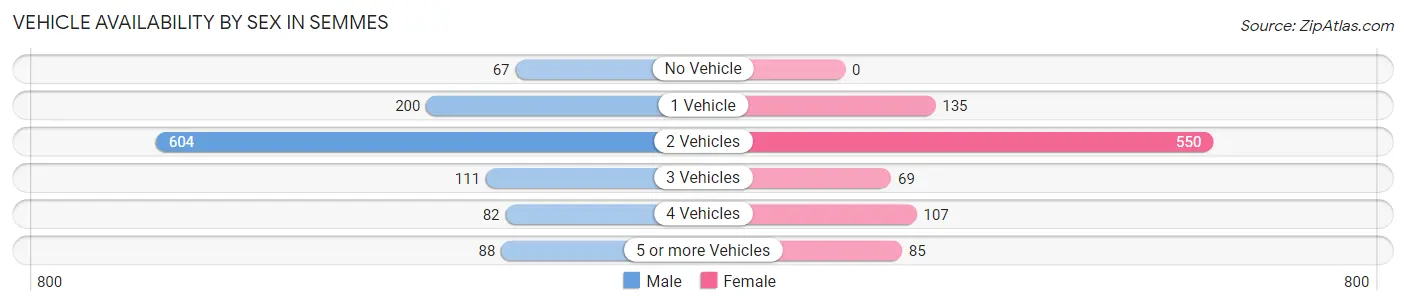
| Vehicles Available | Male | Female |
| No Vehicle | 67 (5.8%) | 0 (0.0%) |
| 1 Vehicle | 200 (17.4%) | 135 (14.3%) |
| 2 Vehicles | 604 (52.4%) | 550 (58.1%) |
| 3 Vehicles | 111 (9.6%) | 69 (7.3%) |
| 4 Vehicles | 82 (7.1%) | 107 (11.3%) |
| 5 or more Vehicles | 88 (7.6%) | 85 (9.0%) |
| Total | 1,152 (100.0%) | 946 (100.0%) |
Commute Time in Semmes
The most frequently occuring commute durations in Semmes are 45 to 59 minutes (355 commuters, 19.1%), 20 to 24 minutes (329 commuters, 17.7%), and 10 to 14 minutes (294 commuters, 15.8%).
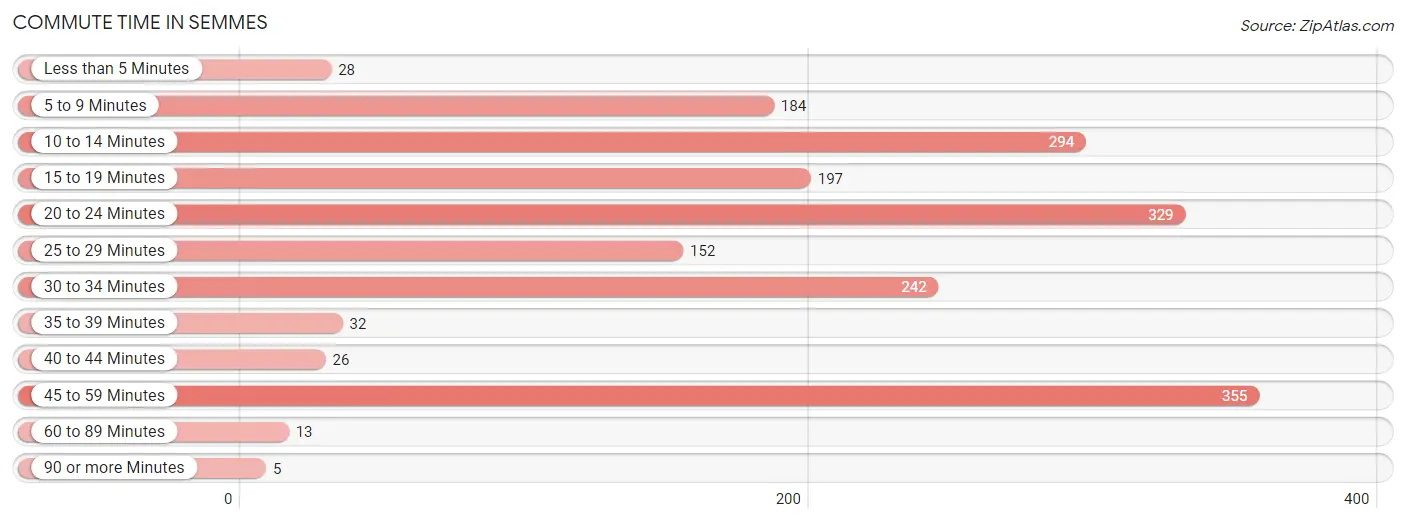
| Commute Time | # Commuters | % Commuters |
| Less than 5 Minutes | 28 | 1.5% |
| 5 to 9 Minutes | 184 | 9.9% |
| 10 to 14 Minutes | 294 | 15.8% |
| 15 to 19 Minutes | 197 | 10.6% |
| 20 to 24 Minutes | 329 | 17.7% |
| 25 to 29 Minutes | 152 | 8.2% |
| 30 to 34 Minutes | 242 | 13.0% |
| 35 to 39 Minutes | 32 | 1.7% |
| 40 to 44 Minutes | 26 | 1.4% |
| 45 to 59 Minutes | 355 | 19.1% |
| 60 to 89 Minutes | 13 | 0.7% |
| 90 or more Minutes | 5 | 0.3% |
Commute Time by Sex in Semmes
The most common commute times in Semmes are 45 to 59 minutes (217 commuters, 21.7%) for males and 10 to 14 minutes (169 commuters, 19.7%) for females.
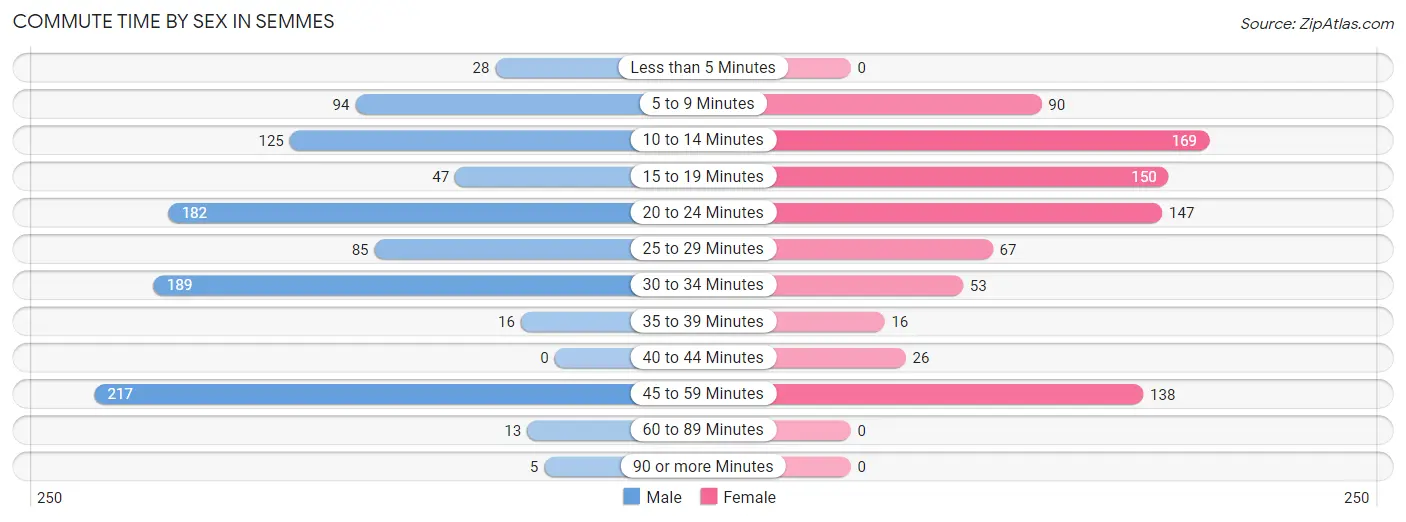
| Commute Time | Male | Female |
| Less than 5 Minutes | 28 (2.8%) | 0 (0.0%) |
| 5 to 9 Minutes | 94 (9.4%) | 90 (10.5%) |
| 10 to 14 Minutes | 125 (12.5%) | 169 (19.7%) |
| 15 to 19 Minutes | 47 (4.7%) | 150 (17.5%) |
| 20 to 24 Minutes | 182 (18.2%) | 147 (17.2%) |
| 25 to 29 Minutes | 85 (8.5%) | 67 (7.8%) |
| 30 to 34 Minutes | 189 (18.9%) | 53 (6.2%) |
| 35 to 39 Minutes | 16 (1.6%) | 16 (1.9%) |
| 40 to 44 Minutes | 0 (0.0%) | 26 (3.0%) |
| 45 to 59 Minutes | 217 (21.7%) | 138 (16.1%) |
| 60 to 89 Minutes | 13 (1.3%) | 0 (0.0%) |
| 90 or more Minutes | 5 (0.5%) | 0 (0.0%) |
Time of Departure to Work by Sex in Semmes
The most frequent times of departure to work in Semmes are 6:00 AM to 6:29 AM (335, 33.5%) for males and 7:00 AM to 7:29 AM (201, 23.5%) for females.
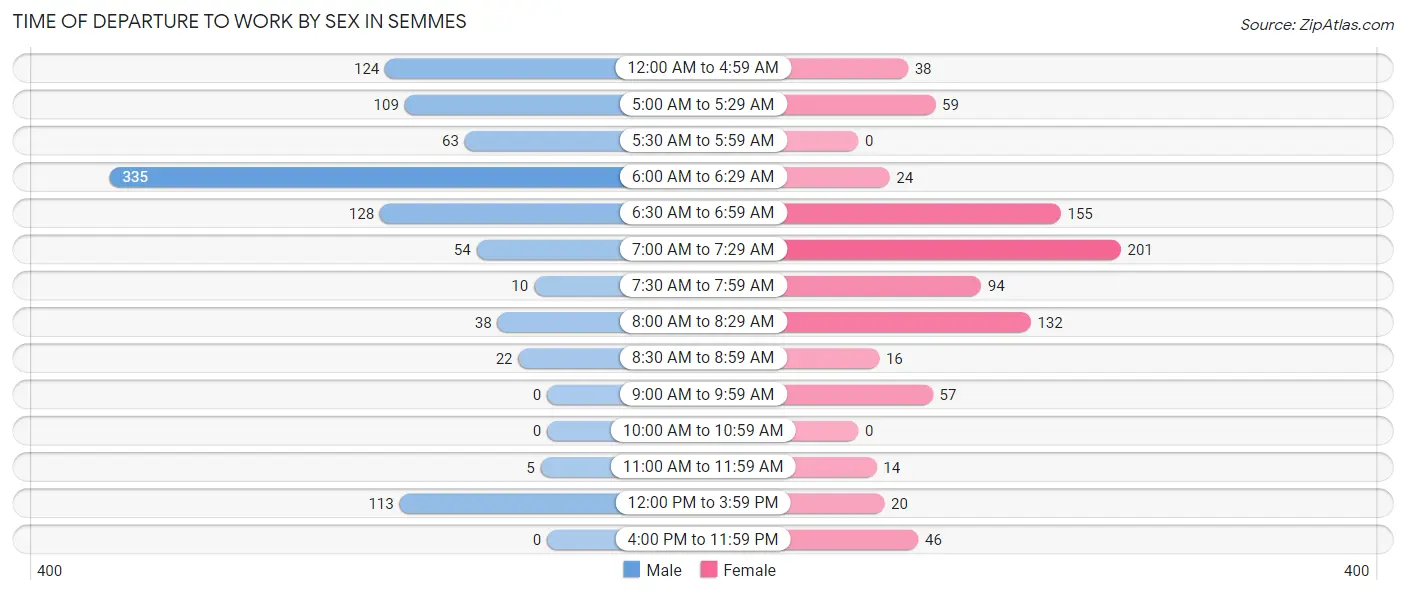
| Time of Departure | Male | Female |
| 12:00 AM to 4:59 AM | 124 (12.4%) | 38 (4.4%) |
| 5:00 AM to 5:29 AM | 109 (10.9%) | 59 (6.9%) |
| 5:30 AM to 5:59 AM | 63 (6.3%) | 0 (0.0%) |
| 6:00 AM to 6:29 AM | 335 (33.5%) | 24 (2.8%) |
| 6:30 AM to 6:59 AM | 128 (12.8%) | 155 (18.1%) |
| 7:00 AM to 7:29 AM | 54 (5.4%) | 201 (23.5%) |
| 7:30 AM to 7:59 AM | 10 (1.0%) | 94 (11.0%) |
| 8:00 AM to 8:29 AM | 38 (3.8%) | 132 (15.4%) |
| 8:30 AM to 8:59 AM | 22 (2.2%) | 16 (1.9%) |
| 9:00 AM to 9:59 AM | 0 (0.0%) | 57 (6.7%) |
| 10:00 AM to 10:59 AM | 0 (0.0%) | 0 (0.0%) |
| 11:00 AM to 11:59 AM | 5 (0.5%) | 14 (1.6%) |
| 12:00 PM to 3:59 PM | 113 (11.3%) | 20 (2.3%) |
| 4:00 PM to 11:59 PM | 0 (0.0%) | 46 (5.4%) |
| Total | 1,001 (100.0%) | 856 (100.0%) |
Housing Occupancy in Semmes
Occupancy by Ownership in Semmes
Of the total 2,209 dwellings in Semmes, owner-occupied units account for 1,646 (74.5%), while renter-occupied units make up 563 (25.5%).
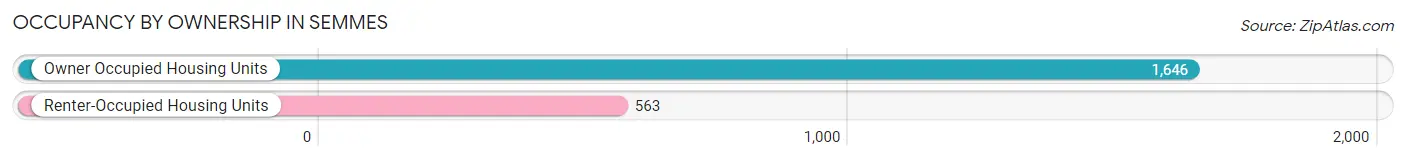
| Occupancy | # Housing Units | % Housing Units |
| Owner Occupied Housing Units | 1,646 | 74.5% |
| Renter-Occupied Housing Units | 563 | 25.5% |
| Total Occupied Housing Units | 2,209 | 100.0% |
Occupancy by Household Size in Semmes
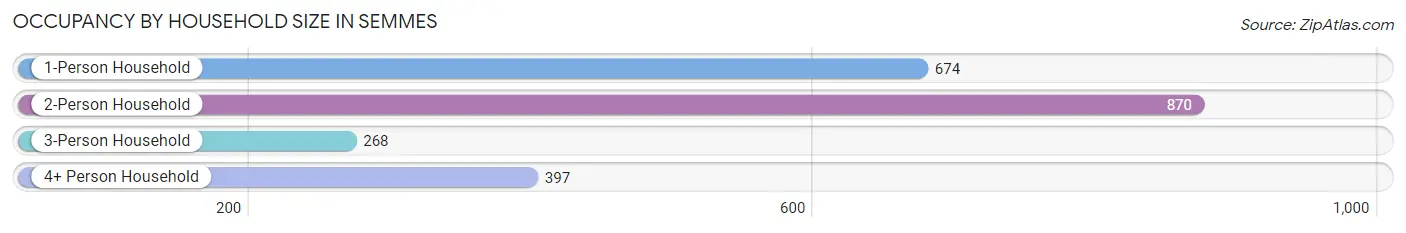
| Household Size | # Housing Units | % Housing Units |
| 1-Person Household | 674 | 30.5% |
| 2-Person Household | 870 | 39.4% |
| 3-Person Household | 268 | 12.1% |
| 4+ Person Household | 397 | 18.0% |
| Total Housing Units | 2,209 | 100.0% |
Occupancy by Ownership by Household Size in Semmes
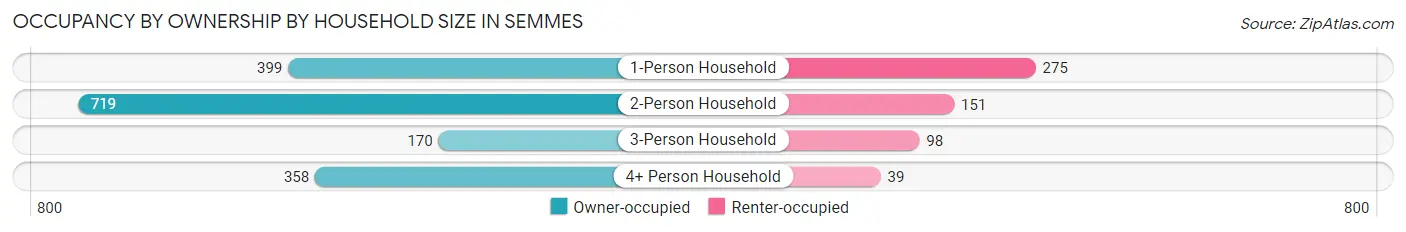
| Household Size | Owner-occupied | Renter-occupied |
| 1-Person Household | 399 (59.2%) | 275 (40.8%) |
| 2-Person Household | 719 (82.6%) | 151 (17.4%) |
| 3-Person Household | 170 (63.4%) | 98 (36.6%) |
| 4+ Person Household | 358 (90.2%) | 39 (9.8%) |
| Total Housing Units | 1,646 (74.5%) | 563 (25.5%) |
Occupancy by Educational Attainment in Semmes
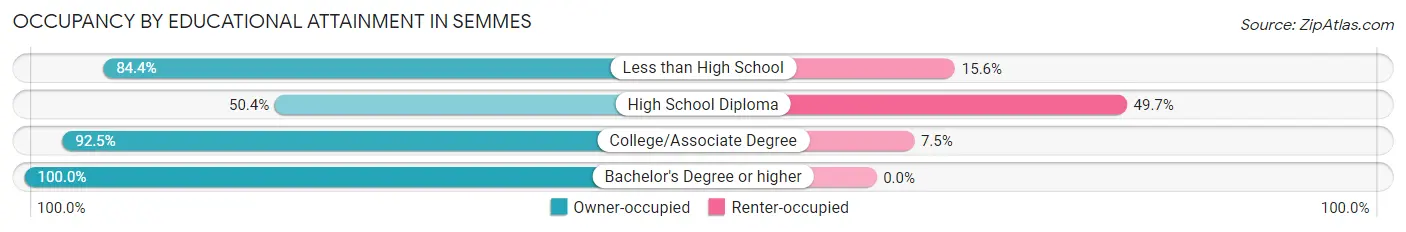
| Household Size | Owner-occupied | Renter-occupied |
| Less than High School | 184 (84.4%) | 34 (15.6%) |
| High School Diploma | 497 (50.3%) | 490 (49.6%) |
| College/Associate Degree | 482 (92.5%) | 39 (7.5%) |
| Bachelor's Degree or higher | 483 (100.0%) | 0 (0.0%) |
Occupancy by Age of Householder in Semmes
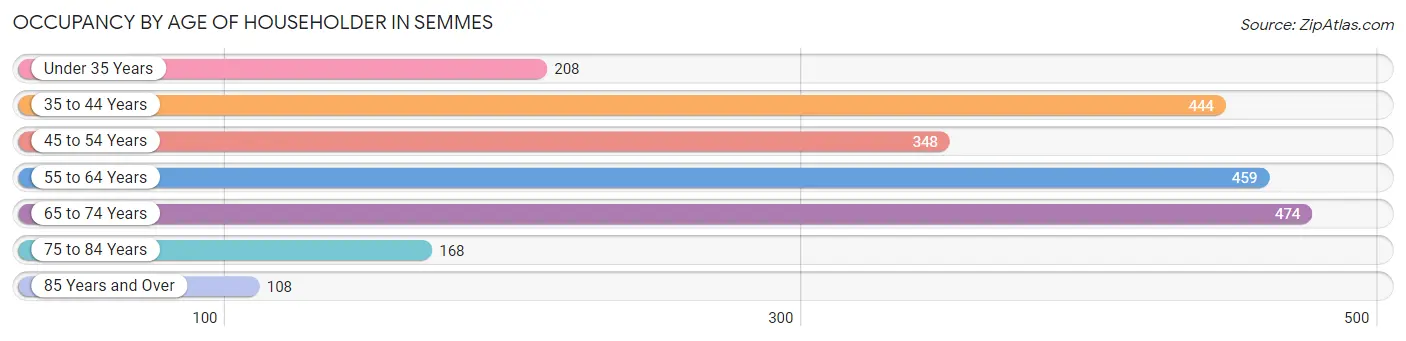
| Age Bracket | # Households | % Households |
| Under 35 Years | 208 | 9.4% |
| 35 to 44 Years | 444 | 20.1% |
| 45 to 54 Years | 348 | 15.8% |
| 55 to 64 Years | 459 | 20.8% |
| 65 to 74 Years | 474 | 21.5% |
| 75 to 84 Years | 168 | 7.6% |
| 85 Years and Over | 108 | 4.9% |
| Total | 2,209 | 100.0% |
Housing Finances in Semmes
Median Income by Occupancy in Semmes
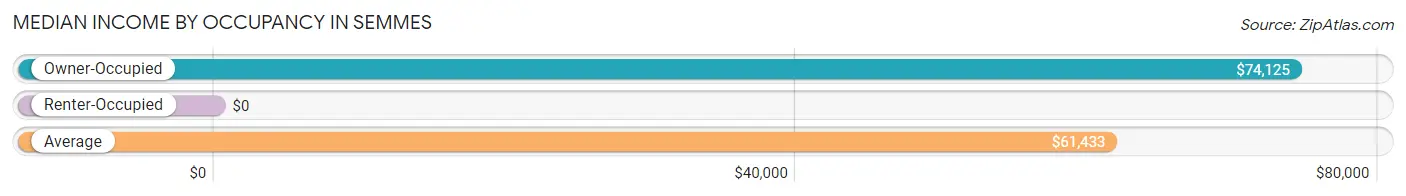
| Occupancy Type | # Households | Median Income |
| Owner-Occupied | 1,646 (74.5%) | $74,125 |
| Renter-Occupied | 563 (25.5%) | $0 |
| Average | 2,209 (100.0%) | $61,433 |
Occupancy by Householder Income Bracket in Semmes
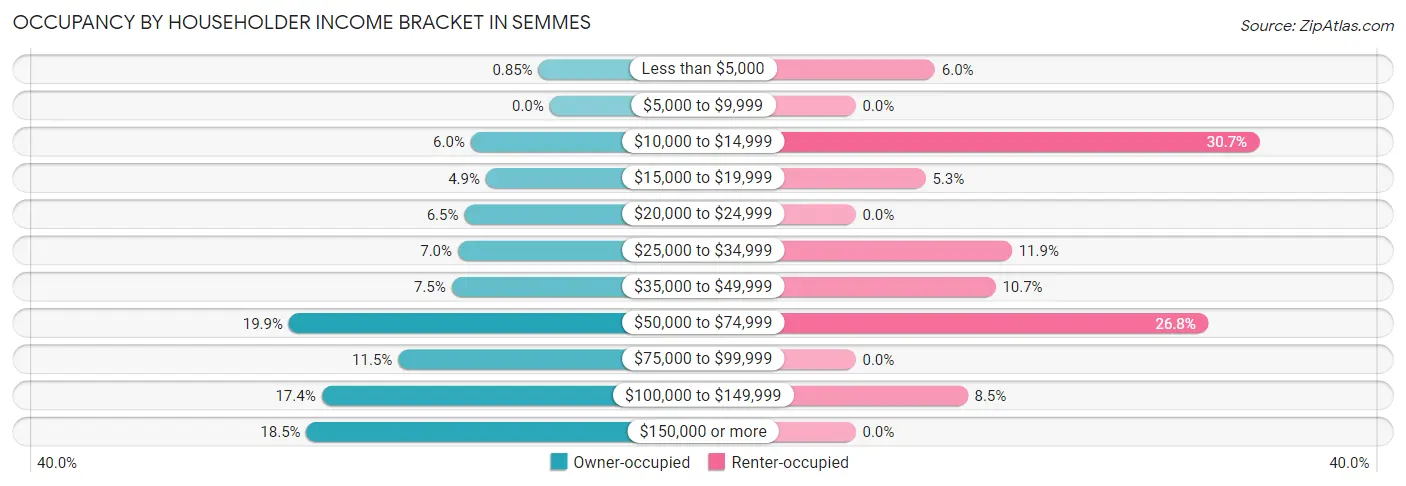
| Income Bracket | Owner-occupied | Renter-occupied |
| Less than $5,000 | 14 (0.9%) | 34 (6.0%) |
| $5,000 to $9,999 | 0 (0.0%) | 0 (0.0%) |
| $10,000 to $14,999 | 99 (6.0%) | 173 (30.7%) |
| $15,000 to $19,999 | 80 (4.9%) | 30 (5.3%) |
| $20,000 to $24,999 | 107 (6.5%) | 0 (0.0%) |
| $25,000 to $34,999 | 115 (7.0%) | 67 (11.9%) |
| $35,000 to $49,999 | 123 (7.5%) | 60 (10.7%) |
| $50,000 to $74,999 | 327 (19.9%) | 151 (26.8%) |
| $75,000 to $99,999 | 190 (11.5%) | 0 (0.0%) |
| $100,000 to $149,999 | 286 (17.4%) | 48 (8.5%) |
| $150,000 or more | 305 (18.5%) | 0 (0.0%) |
| Total | 1,646 (100.0%) | 563 (100.0%) |
Monthly Housing Cost Tiers in Semmes
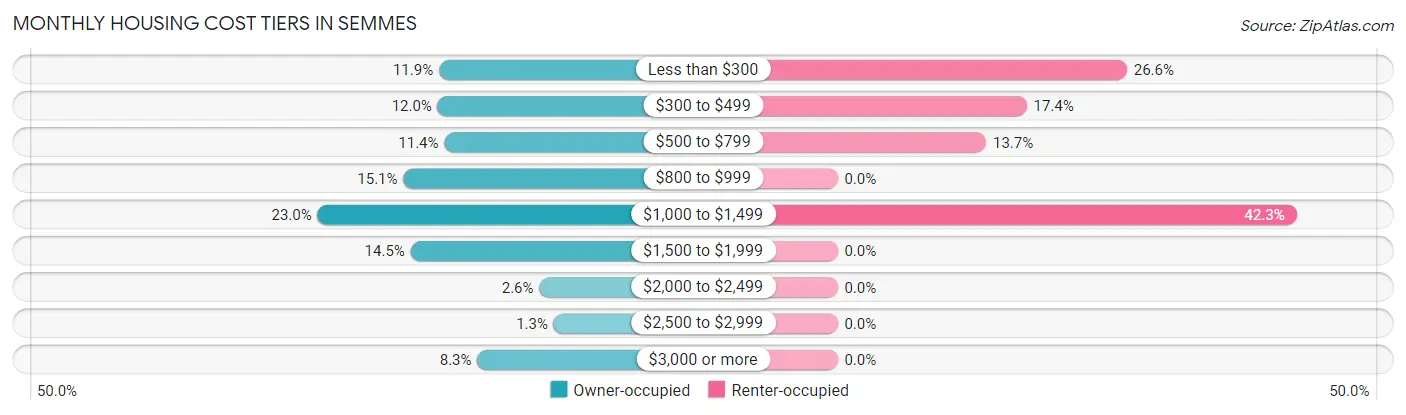
| Monthly Cost | Owner-occupied | Renter-occupied |
| Less than $300 | 195 (11.8%) | 150 (26.6%) |
| $300 to $499 | 197 (12.0%) | 98 (17.4%) |
| $500 to $799 | 187 (11.4%) | 77 (13.7%) |
| $800 to $999 | 249 (15.1%) | 0 (0.0%) |
| $1,000 to $1,499 | 379 (23.0%) | 238 (42.3%) |
| $1,500 to $1,999 | 238 (14.5%) | 0 (0.0%) |
| $2,000 to $2,499 | 43 (2.6%) | 0 (0.0%) |
| $2,500 to $2,999 | 21 (1.3%) | 0 (0.0%) |
| $3,000 or more | 137 (8.3%) | 0 (0.0%) |
| Total | 1,646 (100.0%) | 563 (100.0%) |
Physical Housing Characteristics in Semmes
Housing Structures in Semmes
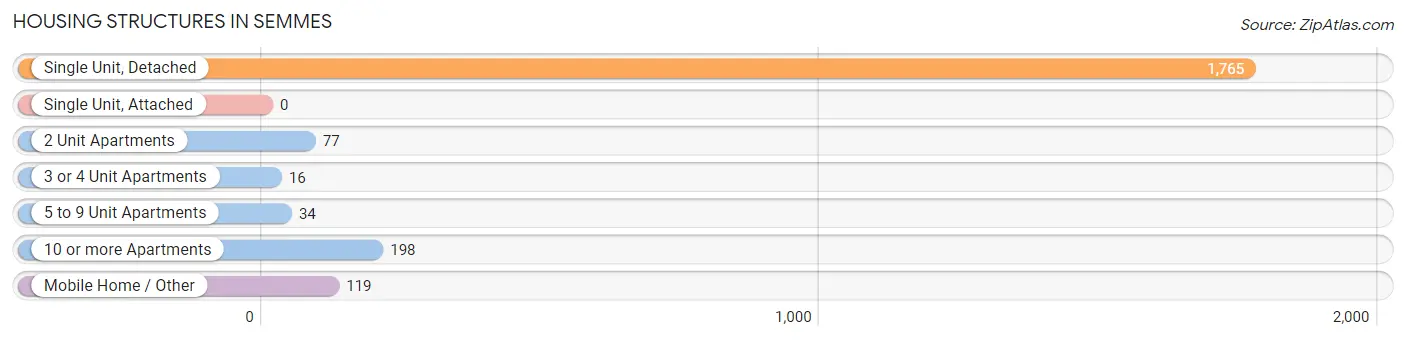
| Structure Type | # Housing Units | % Housing Units |
| Single Unit, Detached | 1,765 | 79.9% |
| Single Unit, Attached | 0 | 0.0% |
| 2 Unit Apartments | 77 | 3.5% |
| 3 or 4 Unit Apartments | 16 | 0.7% |
| 5 to 9 Unit Apartments | 34 | 1.5% |
| 10 or more Apartments | 198 | 9.0% |
| Mobile Home / Other | 119 | 5.4% |
| Total | 2,209 | 100.0% |
Housing Structures by Occupancy in Semmes
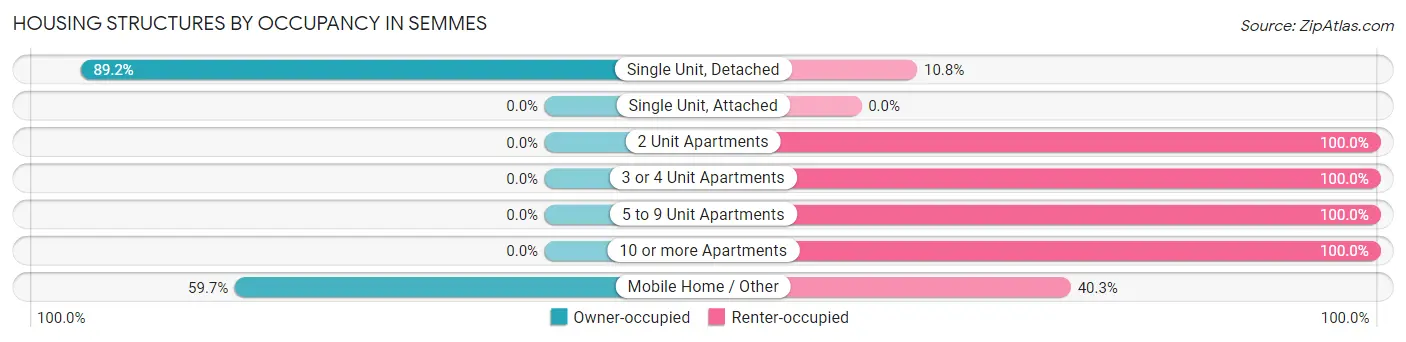
| Structure Type | Owner-occupied | Renter-occupied |
| Single Unit, Detached | 1,575 (89.2%) | 190 (10.8%) |
| Single Unit, Attached | 0 (0.0%) | 0 (0.0%) |
| 2 Unit Apartments | 0 (0.0%) | 77 (100.0%) |
| 3 or 4 Unit Apartments | 0 (0.0%) | 16 (100.0%) |
| 5 to 9 Unit Apartments | 0 (0.0%) | 34 (100.0%) |
| 10 or more Apartments | 0 (0.0%) | 198 (100.0%) |
| Mobile Home / Other | 71 (59.7%) | 48 (40.3%) |
| Total | 1,646 (74.5%) | 563 (25.5%) |
Housing Structures by Number of Rooms in Semmes
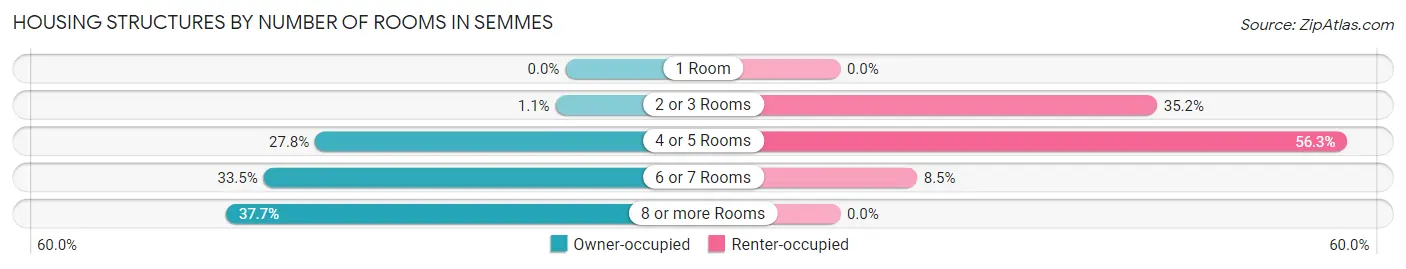
| Number of Rooms | Owner-occupied | Renter-occupied |
| 1 Room | 0 (0.0%) | 0 (0.0%) |
| 2 or 3 Rooms | 18 (1.1%) | 198 (35.2%) |
| 4 or 5 Rooms | 457 (27.8%) | 317 (56.3%) |
| 6 or 7 Rooms | 551 (33.5%) | 48 (8.5%) |
| 8 or more Rooms | 620 (37.7%) | 0 (0.0%) |
| Total | 1,646 (100.0%) | 563 (100.0%) |
Housing Structure by Heating Type in Semmes
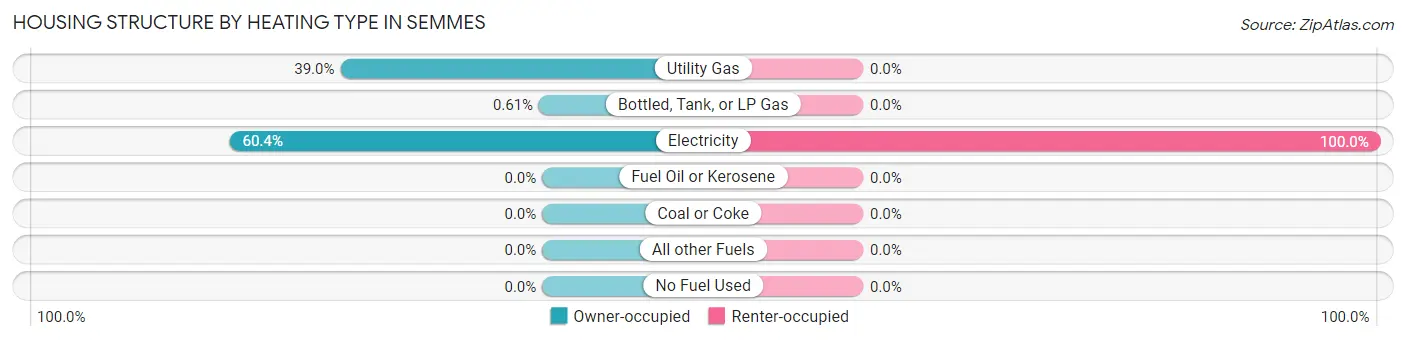
| Heating Type | Owner-occupied | Renter-occupied |
| Utility Gas | 642 (39.0%) | 0 (0.0%) |
| Bottled, Tank, or LP Gas | 10 (0.6%) | 0 (0.0%) |
| Electricity | 994 (60.4%) | 563 (100.0%) |
| Fuel Oil or Kerosene | 0 (0.0%) | 0 (0.0%) |
| Coal or Coke | 0 (0.0%) | 0 (0.0%) |
| All other Fuels | 0 (0.0%) | 0 (0.0%) |
| No Fuel Used | 0 (0.0%) | 0 (0.0%) |
| Total | 1,646 (100.0%) | 563 (100.0%) |
Household Vehicle Usage in Semmes
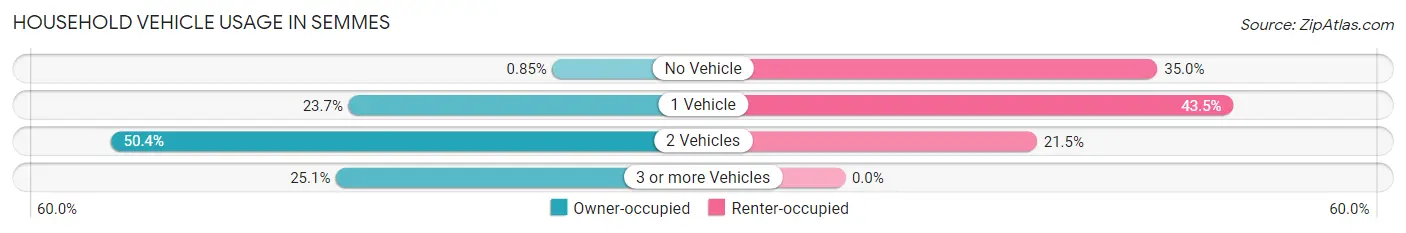
| Vehicles per Household | Owner-occupied | Renter-occupied |
| No Vehicle | 14 (0.9%) | 197 (35.0%) |
| 1 Vehicle | 390 (23.7%) | 245 (43.5%) |
| 2 Vehicles | 829 (50.4%) | 121 (21.5%) |
| 3 or more Vehicles | 413 (25.1%) | 0 (0.0%) |
| Total | 1,646 (100.0%) | 563 (100.0%) |
Real Estate & Mortgages in Semmes
Real Estate and Mortgage Overview in Semmes
| Characteristic | Without Mortgage | With Mortgage |
| Housing Units | 512 | 1,134 |
| Median Property Value | $183,000 | $204,800 |
| Median Household Income | $39,457 | $269 |
| Monthly Housing Costs | $348 | $123 |
| Real Estate Taxes | $736 | $72 |
Property Value by Mortgage Status in Semmes
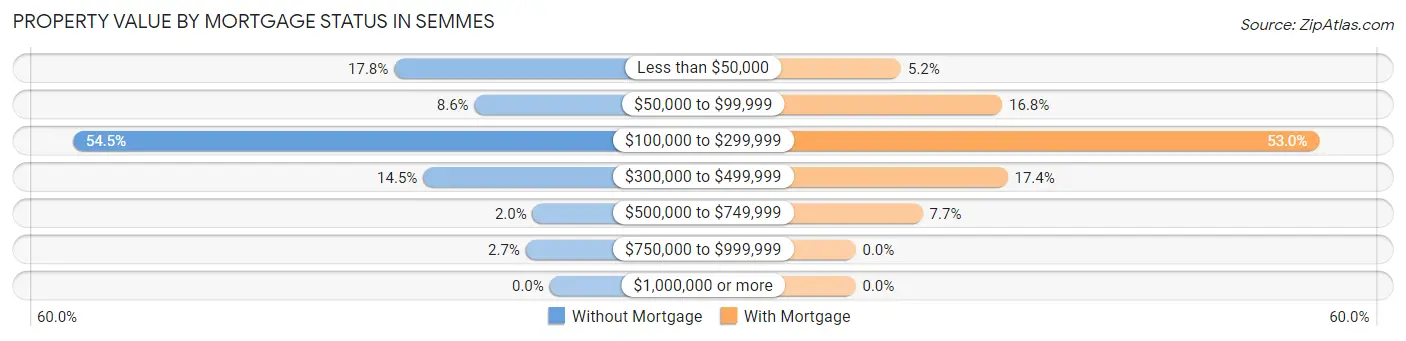
| Property Value | Without Mortgage | With Mortgage |
| Less than $50,000 | 91 (17.8%) | 59 (5.2%) |
| $50,000 to $99,999 | 44 (8.6%) | 190 (16.8%) |
| $100,000 to $299,999 | 279 (54.5%) | 601 (53.0%) |
| $300,000 to $499,999 | 74 (14.4%) | 197 (17.4%) |
| $500,000 to $749,999 | 10 (1.9%) | 87 (7.7%) |
| $750,000 to $999,999 | 14 (2.7%) | 0 (0.0%) |
| $1,000,000 or more | 0 (0.0%) | 0 (0.0%) |
| Total | 512 (100.0%) | 1,134 (100.0%) |
Household Income by Mortgage Status in Semmes
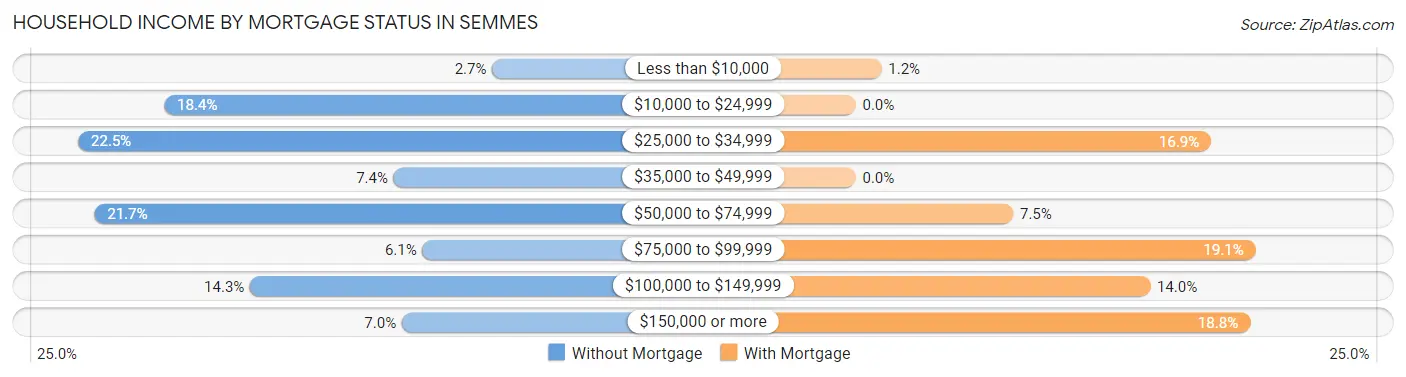
| Household Income | Without Mortgage | With Mortgage |
| Less than $10,000 | 14 (2.7%) | 14 (1.2%) |
| $10,000 to $24,999 | 94 (18.4%) | 0 (0.0%) |
| $25,000 to $34,999 | 115 (22.5%) | 192 (16.9%) |
| $35,000 to $49,999 | 38 (7.4%) | 0 (0.0%) |
| $50,000 to $74,999 | 111 (21.7%) | 85 (7.5%) |
| $75,000 to $99,999 | 31 (6.0%) | 216 (19.1%) |
| $100,000 to $149,999 | 73 (14.3%) | 159 (14.0%) |
| $150,000 or more | 36 (7.0%) | 213 (18.8%) |
| Total | 512 (100.0%) | 1,134 (100.0%) |
Property Value to Household Income Ratio in Semmes
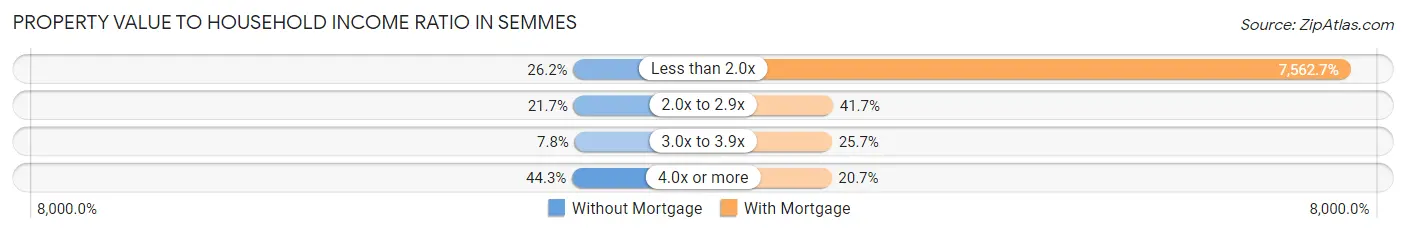
| Value-to-Income Ratio | Without Mortgage | With Mortgage |
| Less than 2.0x | 134 (26.2%) | 85,761 (7,562.7%) |
| 2.0x to 2.9x | 111 (21.7%) | 473 (41.7%) |
| 3.0x to 3.9x | 40 (7.8%) | 291 (25.7%) |
| 4.0x or more | 227 (44.3%) | 235 (20.7%) |
| Total | 512 (100.0%) | 1,134 (100.0%) |
Real Estate Taxes by Mortgage Status in Semmes
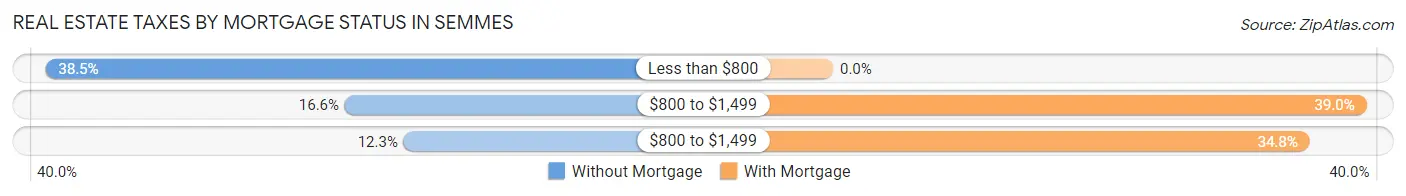
| Property Taxes | Without Mortgage | With Mortgage |
| Less than $800 | 197 (38.5%) | 0 (0.0%) |
| $800 to $1,499 | 85 (16.6%) | 442 (39.0%) |
| $800 to $1,499 | 63 (12.3%) | 395 (34.8%) |
| Total | 512 (100.0%) | 1,134 (100.0%) |
Health & Disability in Semmes
Health Insurance Coverage by Age in Semmes
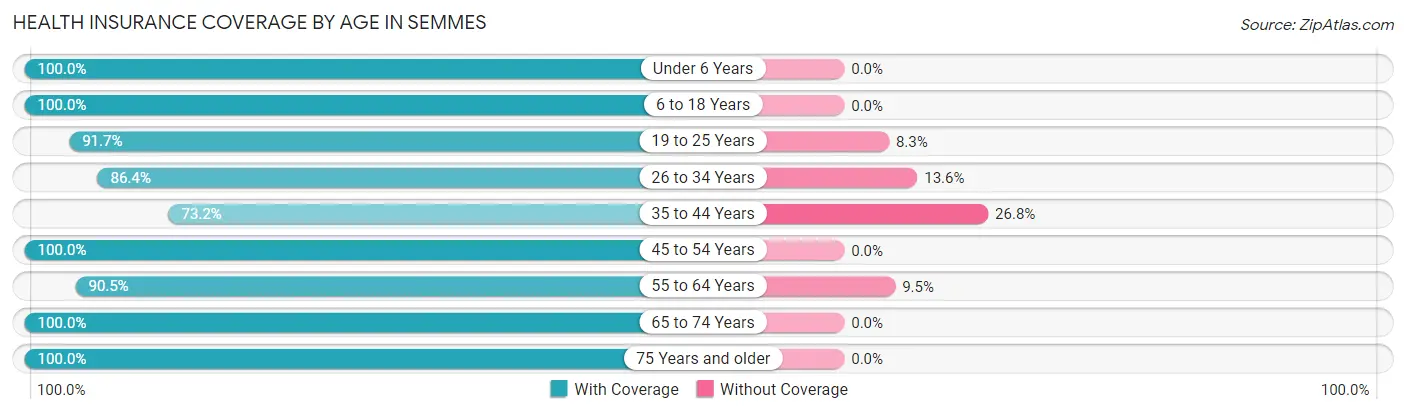
| Age Bracket | With Coverage | Without Coverage |
| Under 6 Years | 275 (100.0%) | 0 (0.0%) |
| 6 to 18 Years | 777 (100.0%) | 0 (0.0%) |
| 19 to 25 Years | 198 (91.7%) | 18 (8.3%) |
| 26 to 34 Years | 419 (86.4%) | 66 (13.6%) |
| 35 to 44 Years | 581 (73.2%) | 213 (26.8%) |
| 45 to 54 Years | 536 (100.0%) | 0 (0.0%) |
| 55 to 64 Years | 687 (90.5%) | 72 (9.5%) |
| 65 to 74 Years | 927 (100.0%) | 0 (0.0%) |
| 75 Years and older | 354 (100.0%) | 0 (0.0%) |
| Total | 4,754 (92.8%) | 369 (7.2%) |
Health Insurance Coverage by Citizenship Status in Semmes
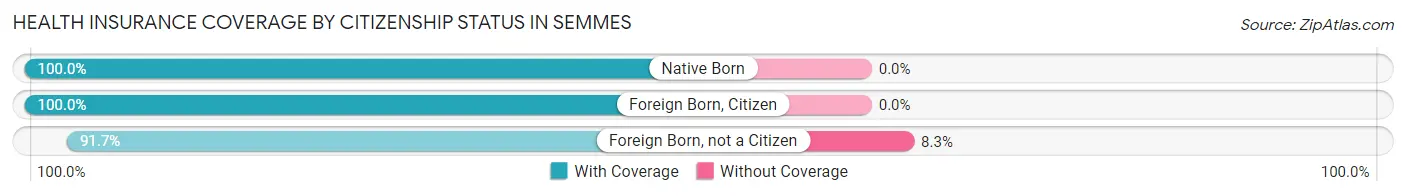
| Citizenship Status | With Coverage | Without Coverage |
| Native Born | 275 (100.0%) | 0 (0.0%) |
| Foreign Born, Citizen | 777 (100.0%) | 0 (0.0%) |
| Foreign Born, not a Citizen | 198 (91.7%) | 18 (8.3%) |
Health Insurance Coverage by Household Income in Semmes
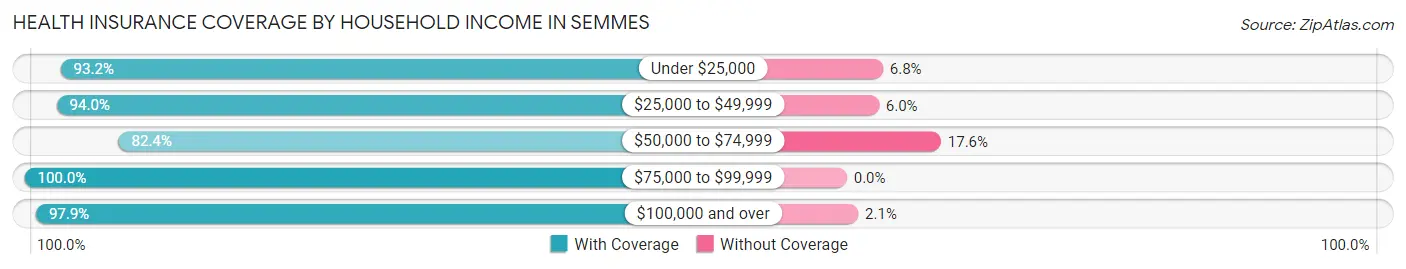
| Household Income | With Coverage | Without Coverage |
| Under $25,000 | 855 (93.2%) | 62 (6.8%) |
| $25,000 to $49,999 | 672 (94.0%) | 43 (6.0%) |
| $50,000 to $74,999 | 968 (82.4%) | 207 (17.6%) |
| $75,000 to $99,999 | 500 (100.0%) | 0 (0.0%) |
| $100,000 and over | 1,749 (97.9%) | 38 (2.1%) |
Public vs Private Health Insurance Coverage by Age in Semmes
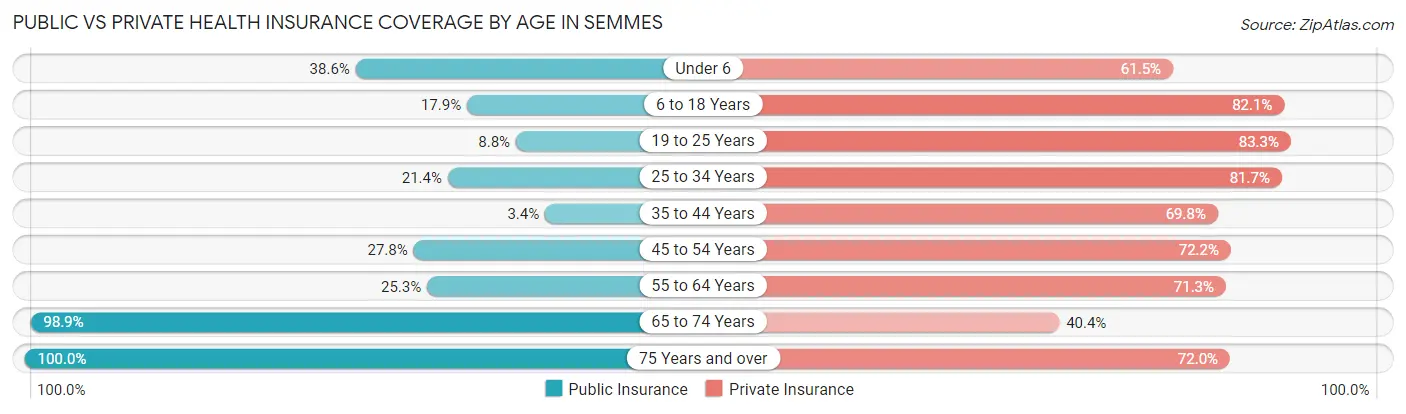
| Age Bracket | Public Insurance | Private Insurance |
| Under 6 | 106 (38.6%) | 169 (61.5%) |
| 6 to 18 Years | 139 (17.9%) | 638 (82.1%) |
| 19 to 25 Years | 19 (8.8%) | 180 (83.3%) |
| 25 to 34 Years | 104 (21.4%) | 396 (81.7%) |
| 35 to 44 Years | 27 (3.4%) | 554 (69.8%) |
| 45 to 54 Years | 149 (27.8%) | 387 (72.2%) |
| 55 to 64 Years | 192 (25.3%) | 541 (71.3%) |
| 65 to 74 Years | 917 (98.9%) | 374 (40.4%) |
| 75 Years and over | 354 (100.0%) | 255 (72.0%) |
| Total | 2,007 (39.2%) | 3,494 (68.2%) |
Disability Status by Sex by Age in Semmes
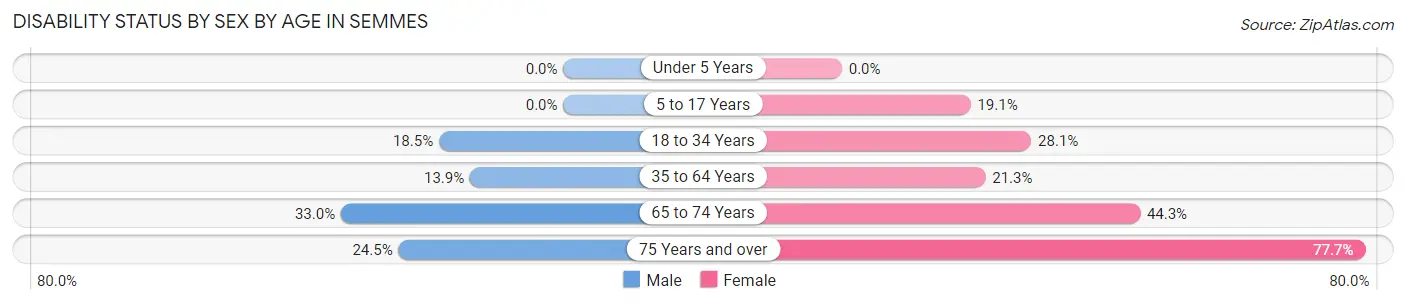
| Age Bracket | Male | Female |
| Under 5 Years | 0 (0.0%) | 0 (0.0%) |
| 5 to 17 Years | 0 (0.0%) | 82 (19.1%) |
| 18 to 34 Years | 82 (18.5%) | 106 (28.1%) |
| 35 to 64 Years | 125 (13.9%) | 253 (21.3%) |
| 65 to 74 Years | 142 (33.0%) | 220 (44.3%) |
| 75 Years and over | 35 (24.5%) | 164 (77.7%) |
Disability Class by Sex by Age in Semmes
Disability Class: Hearing Difficulty
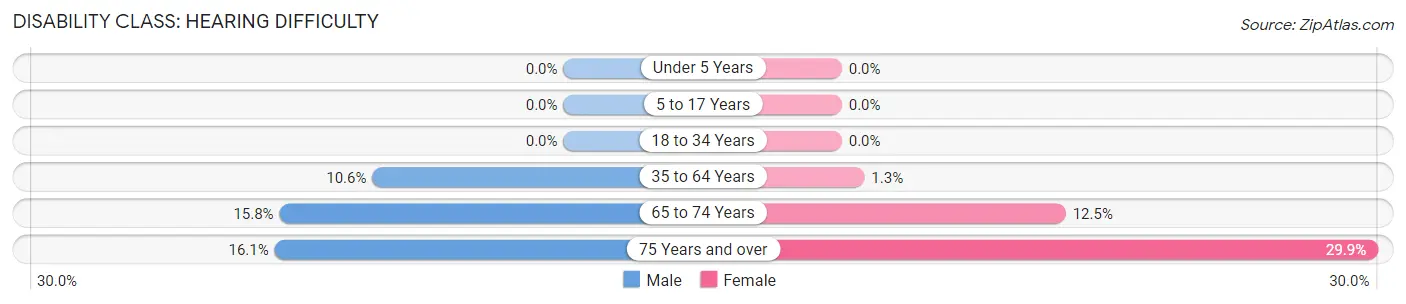
| Age Bracket | Male | Female |
| Under 5 Years | 0 (0.0%) | 0 (0.0%) |
| 5 to 17 Years | 0 (0.0%) | 0 (0.0%) |
| 18 to 34 Years | 0 (0.0%) | 0 (0.0%) |
| 35 to 64 Years | 96 (10.6%) | 15 (1.3%) |
| 65 to 74 Years | 68 (15.8%) | 62 (12.5%) |
| 75 Years and over | 23 (16.1%) | 63 (29.9%) |
Disability Class: Vision Difficulty
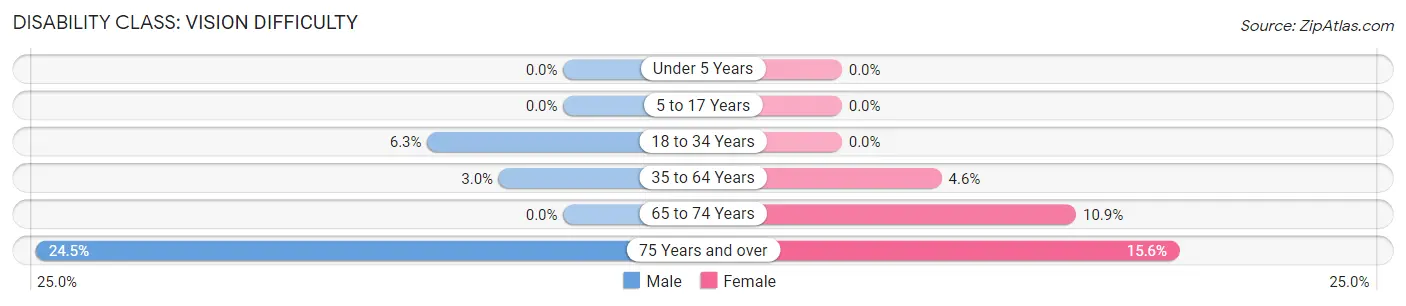
| Age Bracket | Male | Female |
| Under 5 Years | 0 (0.0%) | 0 (0.0%) |
| 5 to 17 Years | 0 (0.0%) | 0 (0.0%) |
| 18 to 34 Years | 28 (6.3%) | 0 (0.0%) |
| 35 to 64 Years | 27 (3.0%) | 55 (4.6%) |
| 65 to 74 Years | 0 (0.0%) | 54 (10.9%) |
| 75 Years and over | 35 (24.5%) | 33 (15.6%) |
Disability Class: Cognitive Difficulty
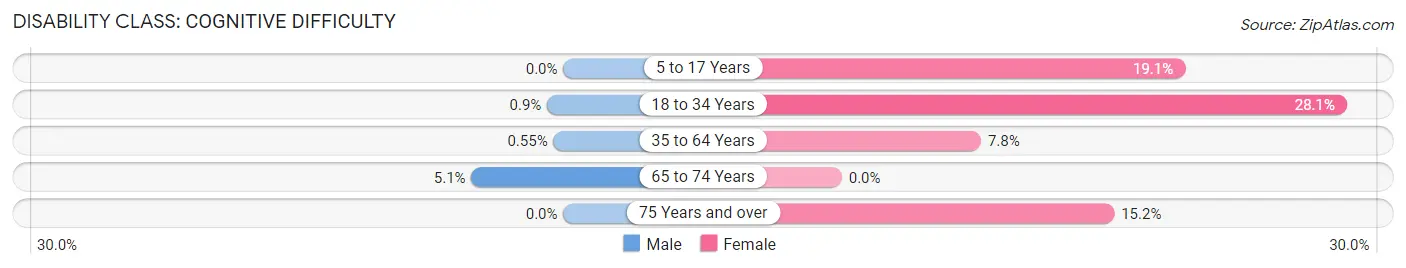
| Age Bracket | Male | Female |
| 5 to 17 Years | 0 (0.0%) | 82 (19.1%) |
| 18 to 34 Years | 4 (0.9%) | 106 (28.1%) |
| 35 to 64 Years | 5 (0.5%) | 92 (7.7%) |
| 65 to 74 Years | 22 (5.1%) | 0 (0.0%) |
| 75 Years and over | 0 (0.0%) | 32 (15.2%) |
Disability Class: Ambulatory Difficulty
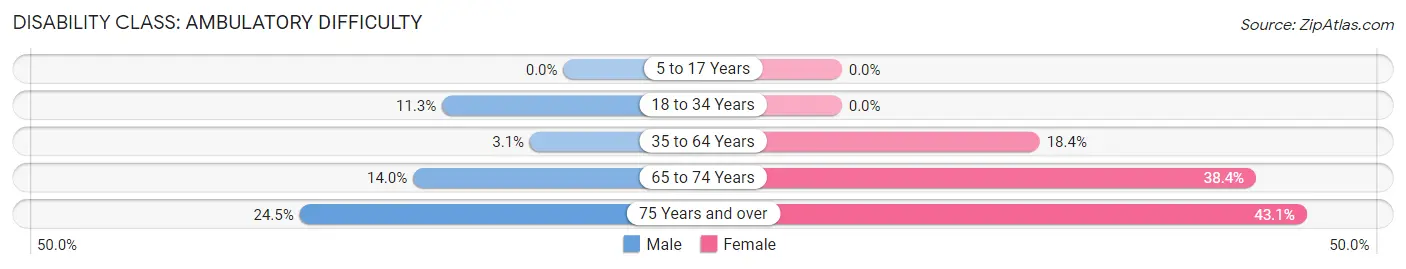
| Age Bracket | Male | Female |
| 5 to 17 Years | 0 (0.0%) | 0 (0.0%) |
| 18 to 34 Years | 50 (11.3%) | 0 (0.0%) |
| 35 to 64 Years | 28 (3.1%) | 218 (18.4%) |
| 65 to 74 Years | 60 (14.0%) | 191 (38.4%) |
| 75 Years and over | 35 (24.5%) | 91 (43.1%) |
Disability Class: Self-Care Difficulty
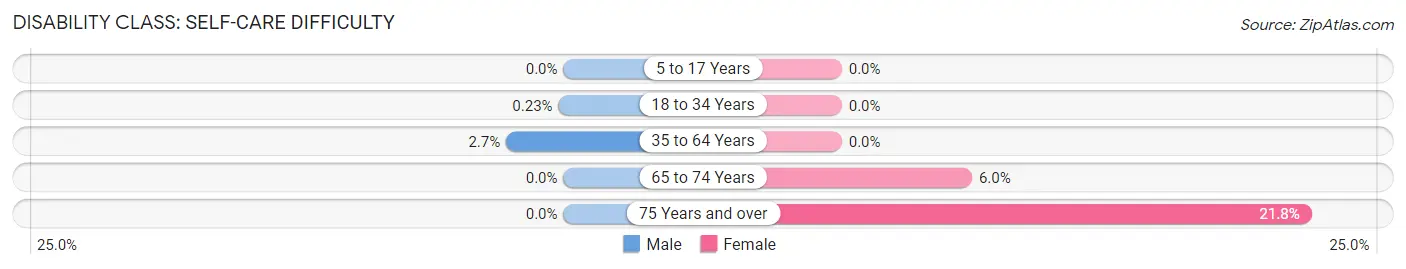
| Age Bracket | Male | Female |
| 5 to 17 Years | 0 (0.0%) | 0 (0.0%) |
| 18 to 34 Years | 1 (0.2%) | 0 (0.0%) |
| 35 to 64 Years | 24 (2.7%) | 0 (0.0%) |
| 65 to 74 Years | 0 (0.0%) | 30 (6.0%) |
| 75 Years and over | 0 (0.0%) | 46 (21.8%) |
Technology Access in Semmes
Computing Device Access in Semmes
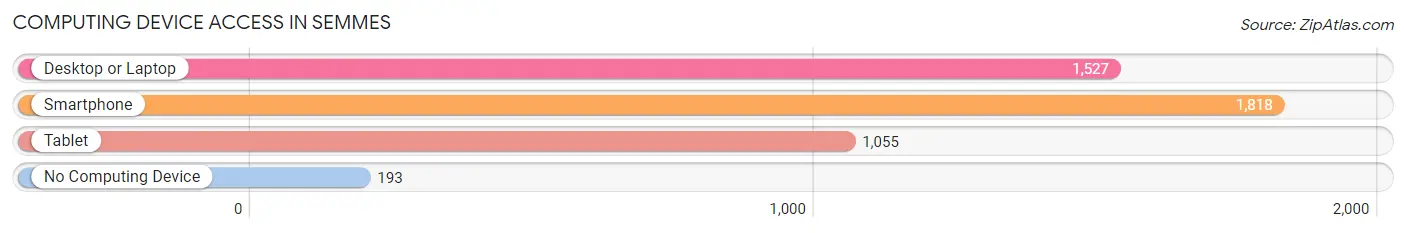
| Device Type | # Households | % Households |
| Desktop or Laptop | 1,527 | 69.1% |
| Smartphone | 1,818 | 82.3% |
| Tablet | 1,055 | 47.8% |
| No Computing Device | 193 | 8.7% |
| Total | 2,209 | 100.0% |
Internet Access in Semmes
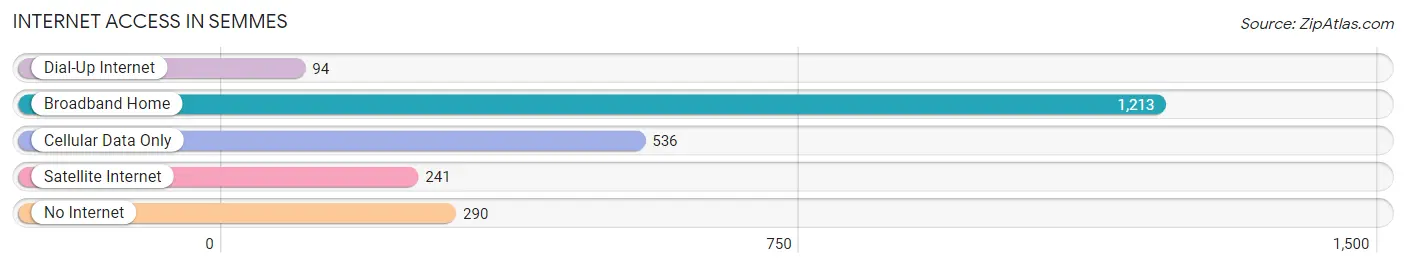
| Internet Type | # Households | % Households |
| Dial-Up Internet | 94 | 4.3% |
| Broadband Home | 1,213 | 54.9% |
| Cellular Data Only | 536 | 24.3% |
| Satellite Internet | 241 | 10.9% |
| No Internet | 290 | 13.1% |
| Total | 2,209 | 100.0% |
Semmes Summary
Semmes is a small town located in Mobile County, Alabama. It is situated about 15 miles northwest of Mobile and is part of the Mobile metropolitan area. The town has a population of approximately 5,000 people and covers an area of about 8.5 square miles.
History
Semmes was founded in 1866 by the Semmes family, who had moved to the area from Georgia. The town was named after Confederate Admiral Raphael Semmes, who was born in nearby Mobile. The town was incorporated in 1887 and was initially a farming community. In the early 1900s, the town began to grow as the lumber industry began to take off in the area. The town was also home to a number of sawmills and other wood-related businesses.
In the 1950s, the town began to experience a population boom as people moved to the area from other parts of the state. This growth was largely due to the expansion of the nearby Mobile Naval Air Station. The town continued to grow throughout the 1960s and 1970s, and by the 1980s, the population had reached its peak of around 8,000 people.
Geography
Semmes is located in Mobile County, Alabama, about 15 miles northwest of Mobile. The town is situated on the Mobile River and is bordered by the cities of Mobile, Prichard, and Saraland. The town covers an area of about 8.5 square miles and has a total population of around 5,000 people.
The town is located in a humid subtropical climate zone and experiences hot, humid summers and mild winters. The average annual temperature is around 70 degrees Fahrenheit, and the average annual precipitation is around 55 inches.
Economy
The economy of Semmes is largely based on the lumber industry. The town is home to a number of sawmills and other wood-related businesses. The town is also home to a number of retail stores, restaurants, and other businesses.
The town is also home to a number of manufacturing companies, including a paper mill, a plastics factory, and a metal fabrication plant. The town is also home to a number of government offices, including the Mobile County Courthouse and the Mobile County Sheriff's Office.
Demographics
As of the 2010 census, the population of Semmes was 5,037. The racial makeup of the town was 79.3% White, 17.2% African American, 0.7% Native American, 0.7% Asian, 0.2% Pacific Islander, and 1.9% from other races. Hispanic or Latino of any race were 2.3% of the population.
The median household income in Semmes was $41,944, and the median family income was $50,917. The per capita income was $20,945. About 16.2% of the population was below the poverty line.
Semmes is served by the Mobile County Public School System. The town is home to a number of public schools, including Semmes Elementary School, Semmes Middle School, and Semmes High School. The town is also home to a number of private schools, including Semmes Christian Academy and Semmes Baptist Academy.
Common Questions
What is the Total Population of Semmes?
Total Population of Semmes is 5,123.
What is the Total Male Population of Semmes?
Total Male Population of Semmes is 2,387.
What is the Total Female Population of Semmes?
Total Female Population of Semmes is 2,736.
What is the Ratio of Males per 100 Females in Semmes?
There are 87.24 Males per 100 Females in Semmes.
What is the Ratio of Females per 100 Males in Semmes?
There are 114.62 Females per 100 Males in Semmes.
What is the Median Population Age in Semmes?
Median Population Age in Semmes is 45.1 Years.
What is the Average Family Size in Semmes
Average Family Size in Semmes is 2.9 People.
What is the Average Household Size in Semmes
Average Household Size in Semmes is 2.3 People.
What is Per Capita Income in Semmes?
Per Capita income in Semmes is $34,792.
What is the Median Family Income in Semmes?
Median Family Income in Semmes is $74,291.
What is the Median Household income in Semmes?
Median Household Income in Semmes is $61,433.
What is Income or Wage Gap in Semmes?
Income or Wage Gap in Semmes is 16.5%.
Women in Semmes earn 83.5 cents for every dollar earned by a man.
What is Inequality or Gini Index in Semmes?
Inequality or Gini Index in Semmes is 0.46.
How Large is the Labor Force in Semmes?
There are 2,156 People in the Labor Forcein in Semmes.
What is the Percentage of People in the Labor Force in Semmes?
50.4% of People are in the Labor Force in Semmes.
What is the Unemployment Rate in Semmes?
Unemployment Rate in Semmes is 2.3%.