Pisgah, AL Map & Demographics
Pisgah Map
Pisgah Overview
$31,147
PER CAPITA INCOME
$67,344
AVG FAMILY INCOME
$51,667
AVG HOUSEHOLD INCOME
57.4%
WAGE / INCOME GAP [ % ]
42.6¢/ $1
WAGE / INCOME GAP [ $ ]
$12,672
FAMILY INCOME DEFICIT
0.46
INEQUALITY / GINI INDEX
1,053
TOTAL POPULATION
618
MALE POPULATION
435
FEMALE POPULATION
142.07
MALES / 100 FEMALES
70.39
FEMALES / 100 MALES
57.0
MEDIAN AGE
3.9
AVG FAMILY SIZE
3.0
AVG HOUSEHOLD SIZE
414
LABOR FORCE [ PEOPLE ]
44.7%
PERCENT IN LABOR FORCE
5.3%
UNEMPLOYMENT RATE
Pisgah Zip Codes
Pisgah Area Codes
Income in Pisgah
Income Overview in Pisgah
Per Capita Income in Pisgah is $31,147, while median incomes of families and households are $67,344 and $51,667 respectively.
| Characteristic | Number | Measure |
| Per Capita Income | 1,053 | $31,147 |
| Median Family Income | 237 | $67,344 |
| Mean Family Income | 237 | $83,216 |
| Median Household Income | 346 | $51,667 |
| Mean Household Income | 346 | $68,260 |
| Income Deficit | 237 | $12,672 |
| Wage / Income Gap (%) | 1,053 | 57.38% |
| Wage / Income Gap ($) | 1,053 | 42.62¢ per $1 |
| Gini / Inequality Index | 1,053 | 0.46 |
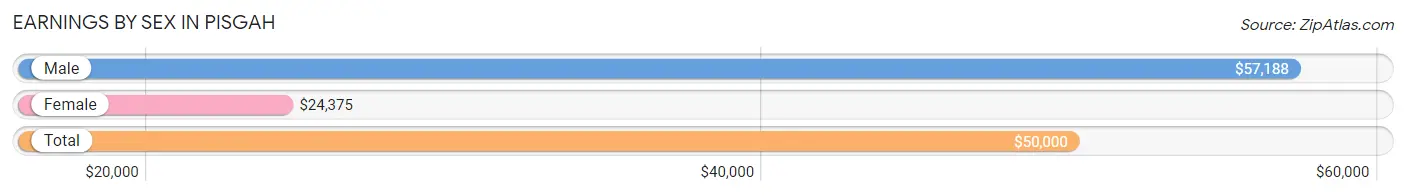
Earnings by Sex in Pisgah
Average Earnings in Pisgah are $50,000, $57,188 for men and $24,375 for women, a difference of 57.4%.
| Sex | Number | Average Earnings |
| Male | 281 (69.9%) | $57,188 |
| Female | 121 (30.1%) | $24,375 |
| Total | 402 (100.0%) | $50,000 |
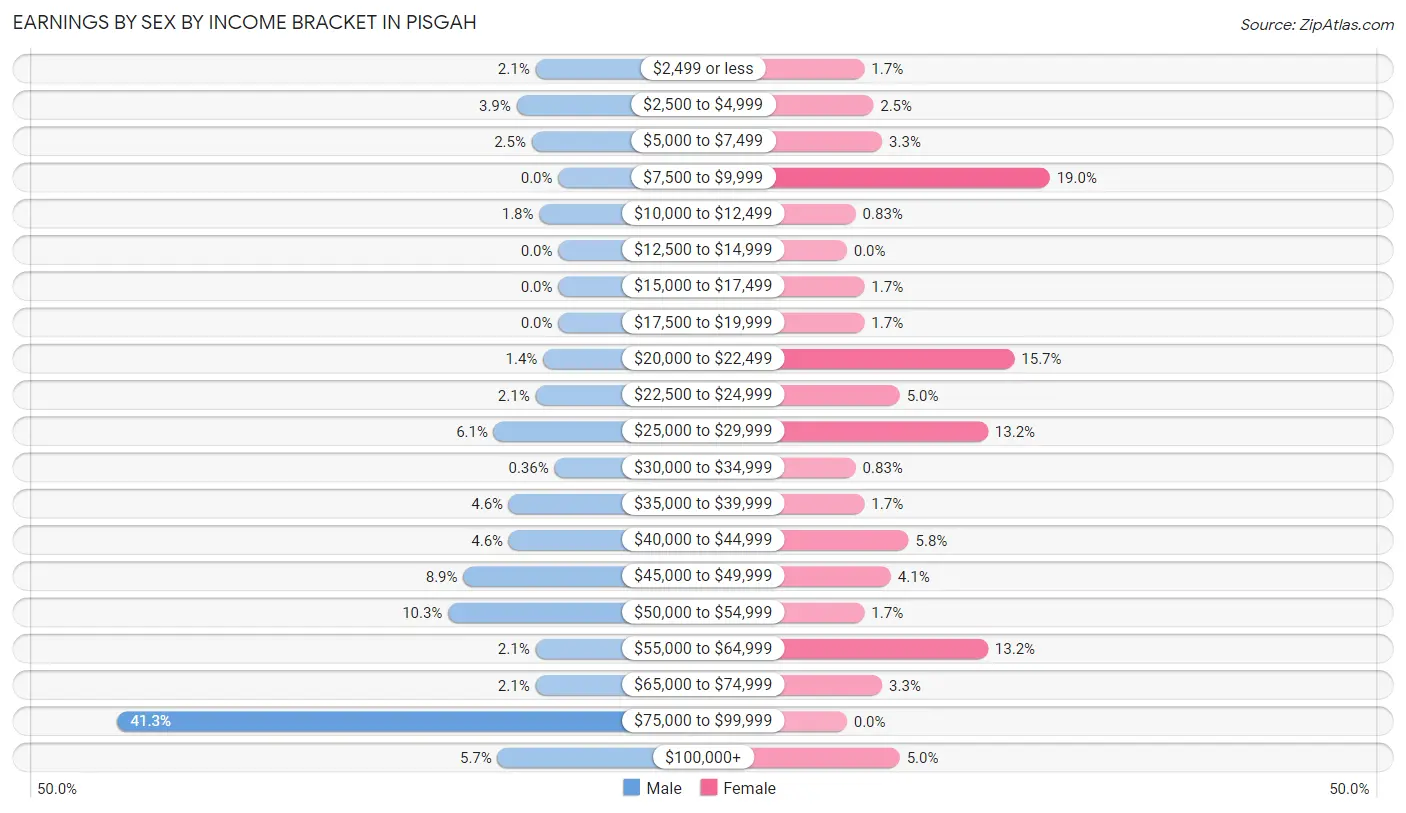
Earnings by Sex by Income Bracket in Pisgah
The most common earnings brackets in Pisgah are $75,000 to $99,999 for men (116 | 41.3%) and $7,500 to $9,999 for women (23 | 19.0%).
| Income | Male | Female |
| $2,499 or less | 6 (2.1%) | 2 (1.7%) |
| $2,500 to $4,999 | 11 (3.9%) | 3 (2.5%) |
| $5,000 to $7,499 | 7 (2.5%) | 4 (3.3%) |
| $7,500 to $9,999 | 0 (0.0%) | 23 (19.0%) |
| $10,000 to $12,499 | 5 (1.8%) | 1 (0.8%) |
| $12,500 to $14,999 | 0 (0.0%) | 0 (0.0%) |
| $15,000 to $17,499 | 0 (0.0%) | 2 (1.7%) |
| $17,500 to $19,999 | 0 (0.0%) | 2 (1.7%) |
| $20,000 to $22,499 | 4 (1.4%) | 19 (15.7%) |
| $22,500 to $24,999 | 6 (2.1%) | 6 (5.0%) |
| $25,000 to $29,999 | 17 (6.0%) | 16 (13.2%) |
| $30,000 to $34,999 | 1 (0.4%) | 1 (0.8%) |
| $35,000 to $39,999 | 13 (4.6%) | 2 (1.7%) |
| $40,000 to $44,999 | 13 (4.6%) | 7 (5.8%) |
| $45,000 to $49,999 | 25 (8.9%) | 5 (4.1%) |
| $50,000 to $54,999 | 29 (10.3%) | 2 (1.7%) |
| $55,000 to $64,999 | 6 (2.1%) | 16 (13.2%) |
| $65,000 to $74,999 | 6 (2.1%) | 4 (3.3%) |
| $75,000 to $99,999 | 116 (41.3%) | 0 (0.0%) |
| $100,000+ | 16 (5.7%) | 6 (5.0%) |
| Total | 281 (100.0%) | 121 (100.0%) |
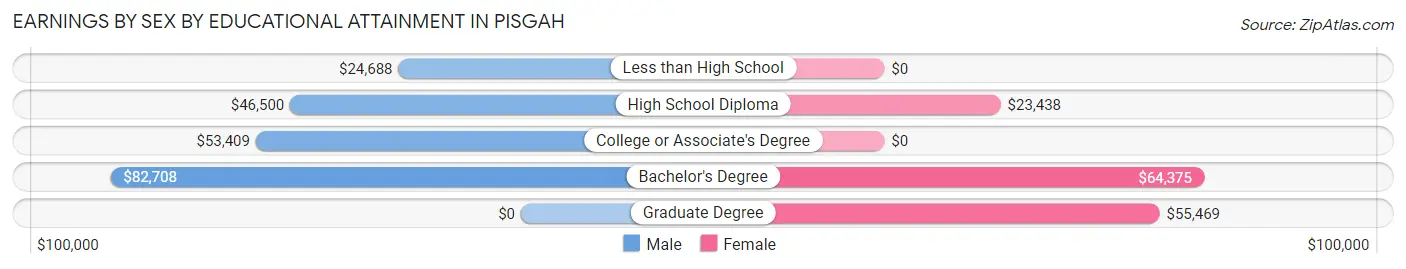
Earnings by Sex by Educational Attainment in Pisgah
Average earnings in Pisgah are $80,161 for men and $29,375 for women, a difference of 63.3%. Men with an educational attainment of bachelor's degree enjoy the highest average annual earnings of $82,708, while those with less than high school education earn the least with $24,688. Women with an educational attainment of bachelor's degree earn the most with the average annual earnings of $64,375, while those with high school diploma education have the smallest earnings of $23,438.
| Educational Attainment | Male Income | Female Income |
| Less than High School | $24,688 | $0 |
| High School Diploma | $46,500 | $23,438 |
| College or Associate's Degree | $53,409 | $0 |
| Bachelor's Degree | $82,708 | $64,375 |
| Graduate Degree | - | - |
| Total | $80,161 | $29,375 |
Family Income in Pisgah
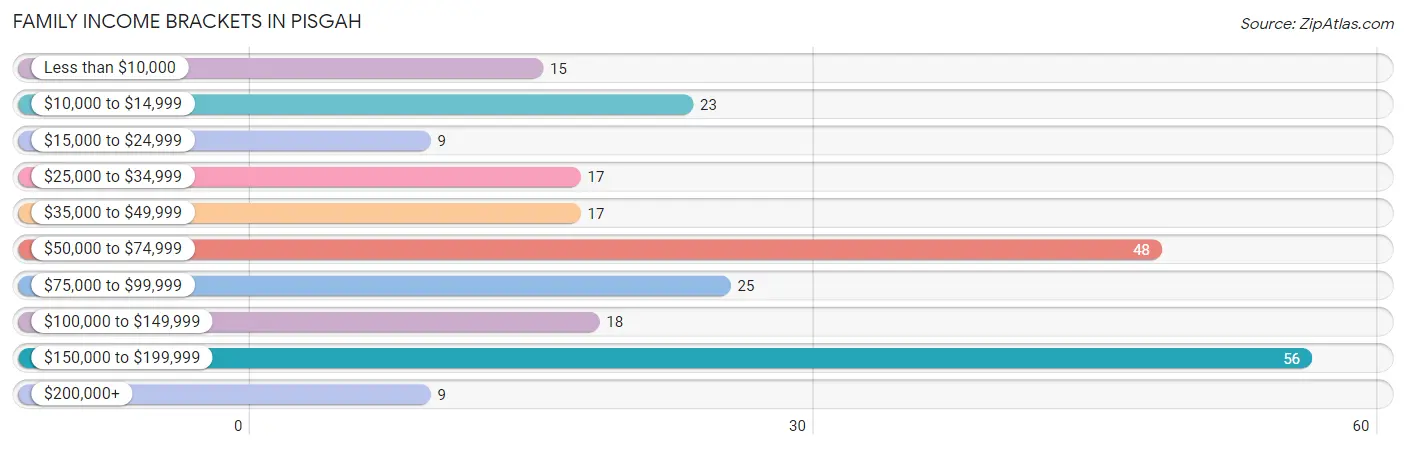
Family Income Brackets in Pisgah
According to the Pisgah family income data, there are 56 families falling into the $150,000 to $199,999 income range, which is the most common income bracket and makes up 23.6% of all families. Conversely, the $15,000 to $24,999 income bracket is the least frequent group with only 9 families (3.8%) belonging to this category.
| Income Bracket | # Families | % Families |
| Less than $10,000 | 15 | 6.3% |
| $10,000 to $14,999 | 23 | 9.7% |
| $15,000 to $24,999 | 9 | 3.8% |
| $25,000 to $34,999 | 17 | 7.2% |
| $35,000 to $49,999 | 17 | 7.2% |
| $50,000 to $74,999 | 48 | 20.3% |
| $75,000 to $99,999 | 25 | 10.5% |
| $100,000 to $149,999 | 18 | 7.6% |
| $150,000 to $199,999 | 56 | 23.6% |
| $200,000+ | 9 | 3.8% |
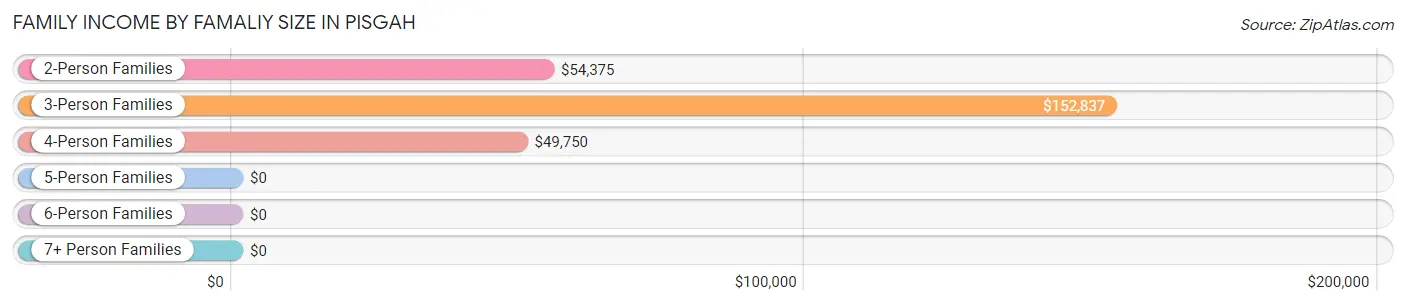
Family Income by Famaliy Size in Pisgah
3-person families (102 | 43.0%) account for the highest median family income in Pisgah with $152,837 per family, while 3-person families (102 | 43.0%) have the highest median income of $50,946 per family member.
| Income Bracket | # Families | Median Income |
| 2-Person Families | 91 (38.4%) | $54,375 |
| 3-Person Families | 102 (43.0%) | $152,837 |
| 4-Person Families | 35 (14.8%) | $49,750 |
| 5-Person Families | 9 (3.8%) | $0 |
| 6-Person Families | 0 (0.0%) | $0 |
| 7+ Person Families | 0 (0.0%) | $0 |
| Total | 237 (100.0%) | $67,344 |
Family Income by Number of Earners in Pisgah
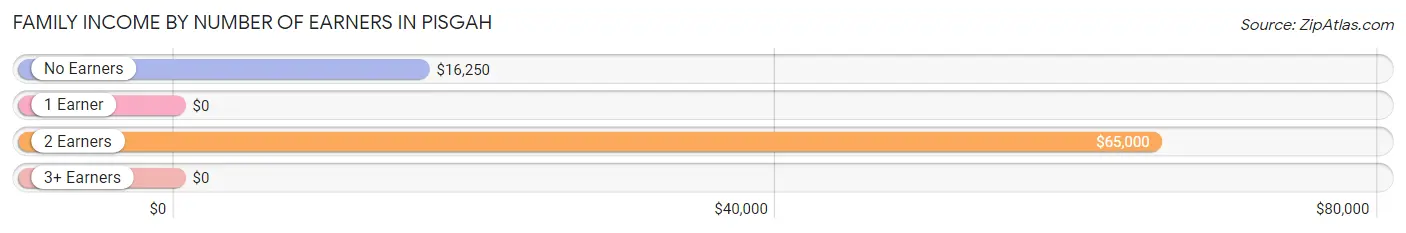
| Number of Earners | # Families | Median Income |
| No Earners | 40 (16.9%) | $16,250 |
| 1 Earner | 129 (54.4%) | $0 |
| 2 Earners | 64 (27.0%) | $65,000 |
| 3+ Earners | 4 (1.7%) | $0 |
| Total | 237 (100.0%) | $67,344 |
Household Income in Pisgah
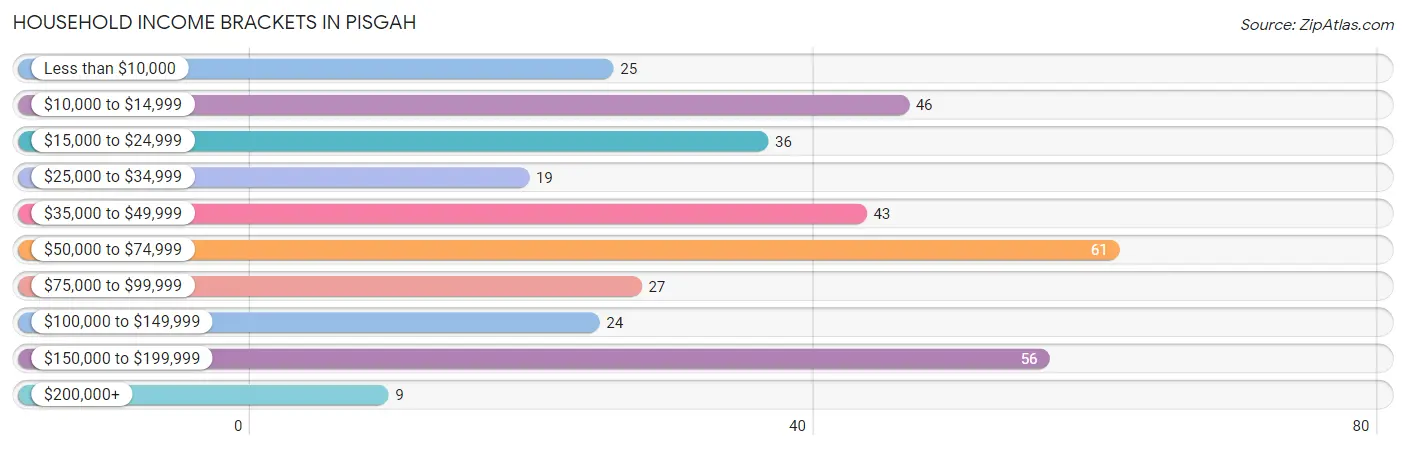
Household Income Brackets in Pisgah
With 61 households falling in the category, the $50,000 to $74,999 income range is the most frequent in Pisgah, accounting for 17.6% of all households. In contrast, only 9 households (2.6%) fall into the $200,000+ income bracket, making it the least populous group.
| Income Bracket | # Households | % Households |
| Less than $10,000 | 25 | 7.2% |
| $10,000 to $14,999 | 46 | 13.3% |
| $15,000 to $24,999 | 36 | 10.4% |
| $25,000 to $34,999 | 19 | 5.5% |
| $35,000 to $49,999 | 43 | 12.4% |
| $50,000 to $74,999 | 61 | 17.6% |
| $75,000 to $99,999 | 27 | 7.8% |
| $100,000 to $149,999 | 24 | 6.9% |
| $150,000 to $199,999 | 56 | 16.2% |
| $200,000+ | 9 | 2.6% |
Household Income by Householder Age in Pisgah
The median household income in Pisgah is $51,667, with the highest median household income of $49,464 found in the 25 to 44 years age bracket for the primary householder. A total of 69 households (19.9%) fall into this category. Meanwhile, the 15 to 24 years age bracket for the primary householder has the lowest median household income of $0, with 18 households (5.2%) in this group.
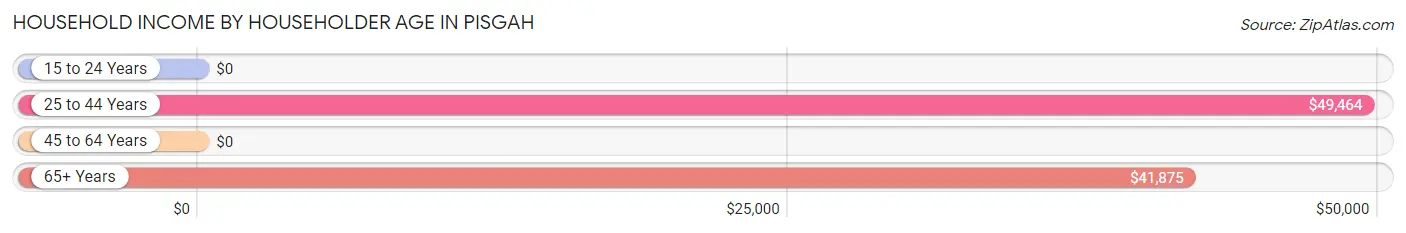
| Income Bracket | # Households | Median Income |
| 15 to 24 Years | 18 (5.2%) | $0 |
| 25 to 44 Years | 69 (19.9%) | $49,464 |
| 45 to 64 Years | 182 (52.6%) | $0 |
| 65+ Years | 77 (22.3%) | $41,875 |
| Total | 346 (100.0%) | $51,667 |
Poverty in Pisgah
Income Below Poverty by Sex and Age in Pisgah
With 13.6% poverty level for males and 36.3% for females among the residents of Pisgah, 18 to 24 year old males and 15 year old females are the most vulnerable to poverty, with 22 males (42.3%) and 4 females (100.0%) in their respective age groups living below the poverty level.
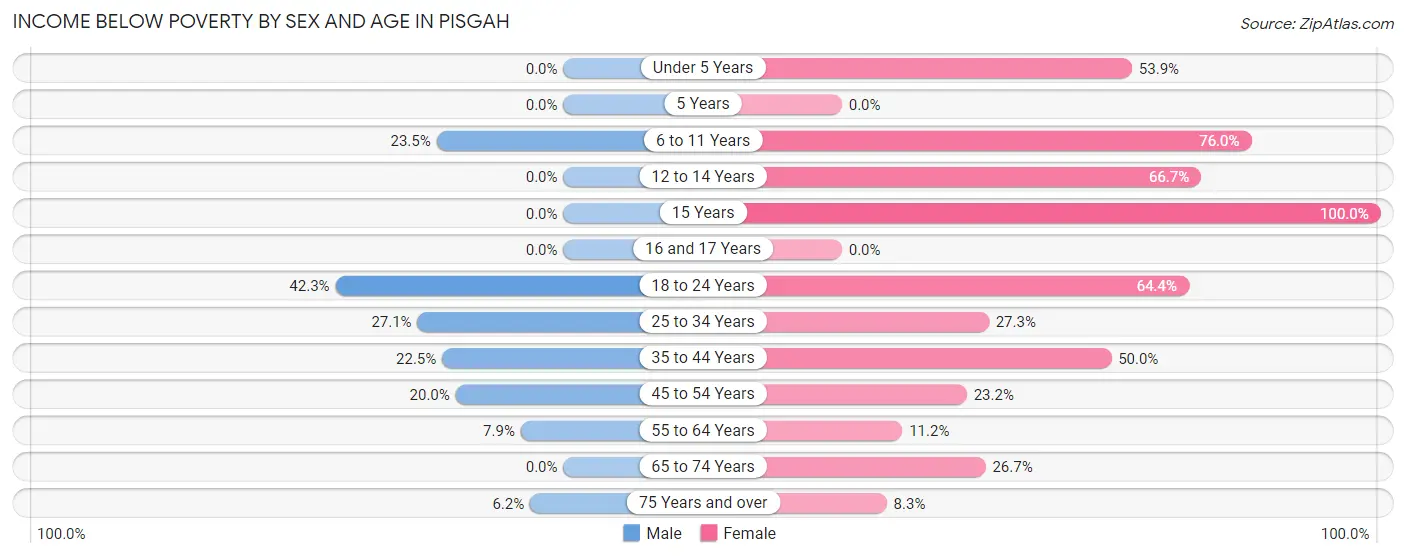
| Age Bracket | Male | Female |
| Under 5 Years | 0 (0.0%) | 14 (53.8%) |
| 5 Years | 0 (0.0%) | 0 (0.0%) |
| 6 to 11 Years | 4 (23.5%) | 19 (76.0%) |
| 12 to 14 Years | 0 (0.0%) | 18 (66.7%) |
| 15 Years | 0 (0.0%) | 4 (100.0%) |
| 16 and 17 Years | 0 (0.0%) | 0 (0.0%) |
| 18 to 24 Years | 22 (42.3%) | 38 (64.4%) |
| 25 to 34 Years | 13 (27.1%) | 6 (27.3%) |
| 35 to 44 Years | 9 (22.5%) | 21 (50.0%) |
| 45 to 54 Years | 11 (20.0%) | 16 (23.2%) |
| 55 to 64 Years | 14 (7.9%) | 11 (11.2%) |
| 65 to 74 Years | 0 (0.0%) | 8 (26.7%) |
| 75 Years and over | 11 (6.2%) | 2 (8.3%) |
| Total | 84 (13.6%) | 157 (36.3%) |
Income Above Poverty by Sex and Age in Pisgah
According to the poverty statistics in Pisgah, males aged under 5 years and females aged 5 years are the age groups that are most secure financially, with 100.0% of males and 100.0% of females in these age groups living above the poverty line.
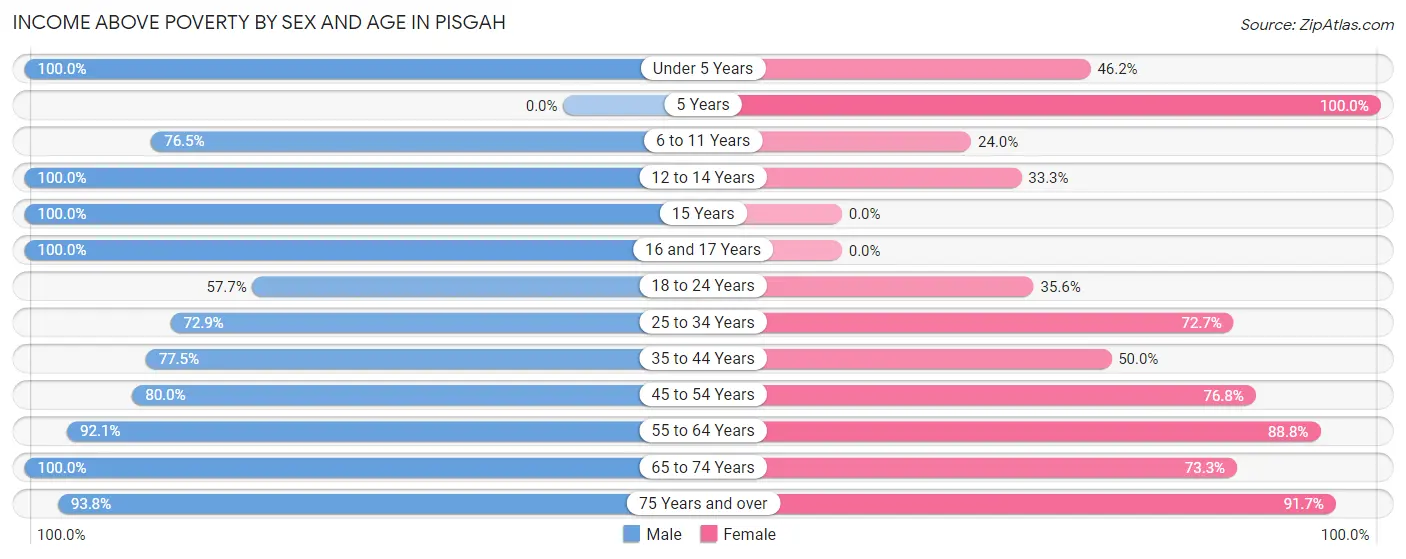
| Age Bracket | Male | Female |
| Under 5 Years | 11 (100.0%) | 12 (46.2%) |
| 5 Years | 0 (0.0%) | 7 (100.0%) |
| 6 to 11 Years | 13 (76.5%) | 6 (24.0%) |
| 12 to 14 Years | 5 (100.0%) | 9 (33.3%) |
| 15 Years | 2 (100.0%) | 0 (0.0%) |
| 16 and 17 Years | 4 (100.0%) | 0 (0.0%) |
| 18 to 24 Years | 30 (57.7%) | 21 (35.6%) |
| 25 to 34 Years | 35 (72.9%) | 16 (72.7%) |
| 35 to 44 Years | 31 (77.5%) | 21 (50.0%) |
| 45 to 54 Years | 44 (80.0%) | 53 (76.8%) |
| 55 to 64 Years | 163 (92.1%) | 87 (88.8%) |
| 65 to 74 Years | 29 (100.0%) | 22 (73.3%) |
| 75 Years and over | 167 (93.8%) | 22 (91.7%) |
| Total | 534 (86.4%) | 276 (63.7%) |
Income Below Poverty Among Married-Couple Families in Pisgah
The poverty statistics for married-couple families in Pisgah show that 14.7% or 28 of the total 190 families live below the poverty line. Families with 1 or 2 children have the highest poverty rate of 17.5%, comprising of 7 families. On the other hand, families with 3 or 4 children have the lowest poverty rate of 0.0%, which includes 0 families.
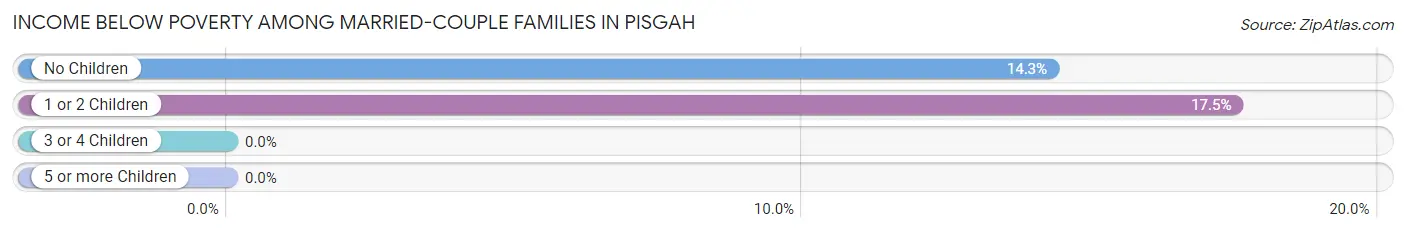
| Children | Above Poverty | Below Poverty |
| No Children | 126 (85.7%) | 21 (14.3%) |
| 1 or 2 Children | 33 (82.5%) | 7 (17.5%) |
| 3 or 4 Children | 3 (100.0%) | 0 (0.0%) |
| 5 or more Children | 0 (0.0%) | 0 (0.0%) |
| Total | 162 (85.3%) | 28 (14.7%) |
Income Below Poverty Among Single-Parent Households in Pisgah
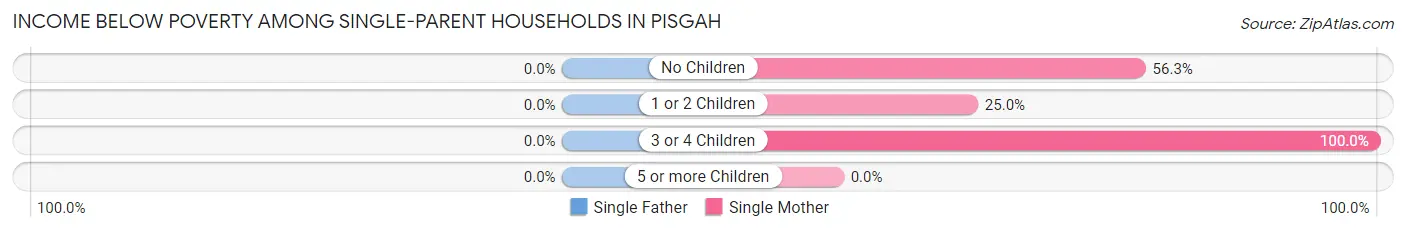
| Children | Single Father | Single Mother |
| No Children | 0 (0.0%) | 9 (56.2%) |
| 1 or 2 Children | 0 (0.0%) | 4 (25.0%) |
| 3 or 4 Children | 0 (0.0%) | 9 (100.0%) |
| 5 or more Children | 0 (0.0%) | 0 (0.0%) |
| Total | 0 (0.0%) | 22 (53.7%) |
Income Below Poverty Among Married-Couple vs Single-Parent Households in Pisgah
The poverty data for Pisgah shows that 28 of the married-couple family households (14.7%) and 22 of the single-parent households (46.8%) are living below the poverty level. Within the married-couple family households, those with 1 or 2 children have the highest poverty rate, with 7 households (17.5%) falling below the poverty line. Among the single-parent households, those with 3 or 4 children have the highest poverty rate, with 9 household (100.0%) living below poverty.
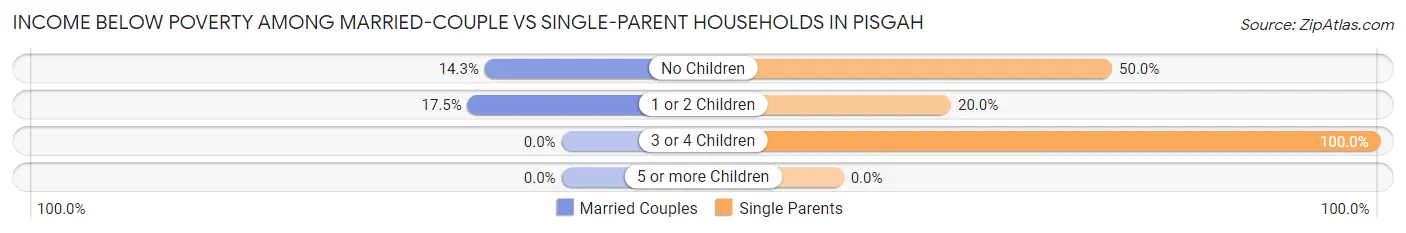
| Children | Married-Couple Families | Single-Parent Households |
| No Children | 21 (14.3%) | 9 (50.0%) |
| 1 or 2 Children | 7 (17.5%) | 4 (20.0%) |
| 3 or 4 Children | 0 (0.0%) | 9 (100.0%) |
| 5 or more Children | 0 (0.0%) | 0 (0.0%) |
| Total | 28 (14.7%) | 22 (46.8%) |
Race in Pisgah
The most populous races in Pisgah are White / Caucasian (972 | 92.3%), Two or more Races (58 | 5.5%), and Black / African American (13 | 1.2%).
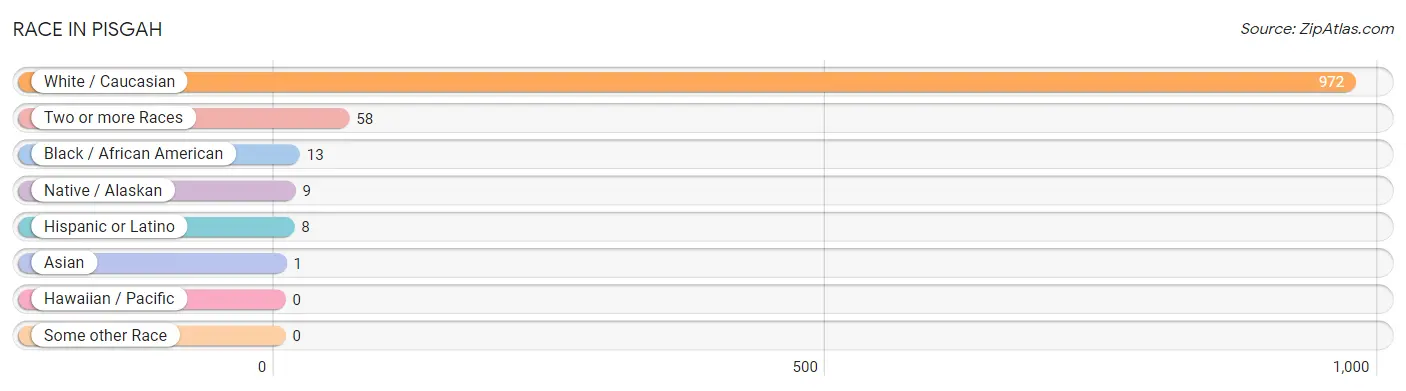
| Race | # Population | % Population |
| Asian | 1 | 0.1% |
| Black / African American | 13 | 1.2% |
| Hawaiian / Pacific | 0 | 0.0% |
| Hispanic or Latino | 8 | 0.8% |
| Native / Alaskan | 9 | 0.9% |
| White / Caucasian | 972 | 92.3% |
| Two or more Races | 58 | 5.5% |
| Some other Race | 0 | 0.0% |
| Total | 1,053 | 100.0% |
Ancestry in Pisgah
The most populous ancestries reported in Pisgah are English (406 | 38.6%), American (118 | 11.2%), German (59 | 5.6%), Scottish (50 | 4.8%), and Irish (41 | 3.9%), together accounting for 64.0% of all Pisgah residents.
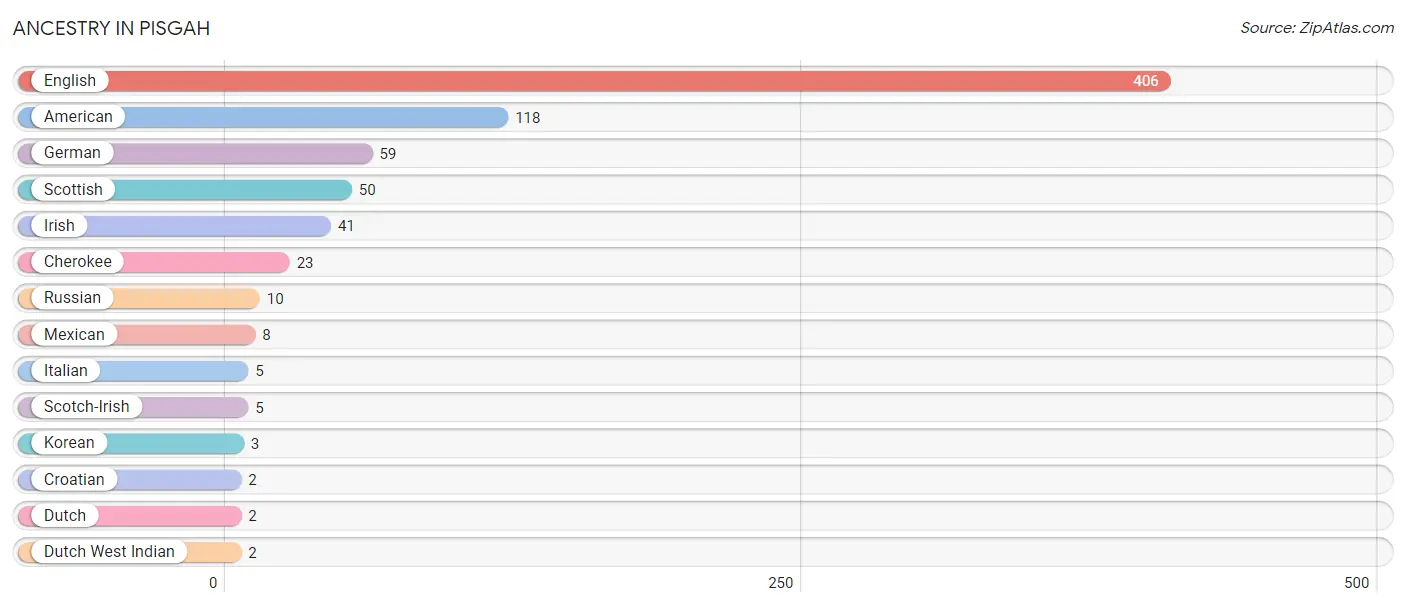
| Ancestry | # Population | % Population |
| American | 118 | 11.2% |
| Cherokee | 23 | 2.2% |
| Croatian | 2 | 0.2% |
| Dutch | 2 | 0.2% |
| Dutch West Indian | 2 | 0.2% |
| English | 406 | 38.6% |
| German | 59 | 5.6% |
| Irish | 41 | 3.9% |
| Italian | 5 | 0.5% |
| Korean | 3 | 0.3% |
| Mexican | 8 | 0.8% |
| Russian | 10 | 0.9% |
| Scotch-Irish | 5 | 0.5% |
| Scottish | 50 | 4.8% | View All 14 Rows |
Immigrants in Pisgah
The most numerous immigrant groups reported in Pisgah came from Asia (3 | 0.3%), Eastern Asia (2 | 0.2%), Japan (2 | 0.2%), Philippines (1 | 0.1%), and South Eastern Asia (1 | 0.1%), together accounting for 0.8% of all Pisgah residents.
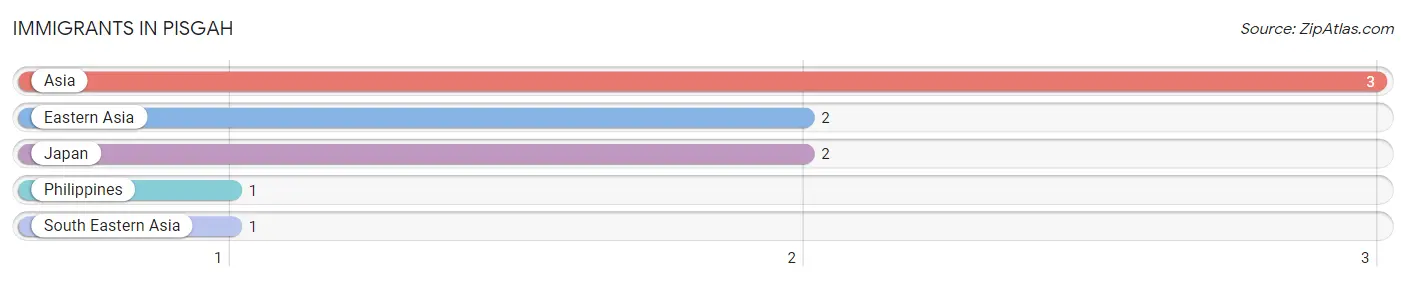
| Immigration Origin | # Population | % Population |
| Asia | 3 | 0.3% |
| Eastern Asia | 2 | 0.2% |
| Japan | 2 | 0.2% |
| Philippines | 1 | 0.1% |
| South Eastern Asia | 1 | 0.1% | View All 5 Rows |
Sex and Age in Pisgah
Sex and Age in Pisgah
The most populous age groups in Pisgah are 80 to 84 Years (169 | 27.4%) for men and 55 to 59 Years (75 | 17.2%) for women.
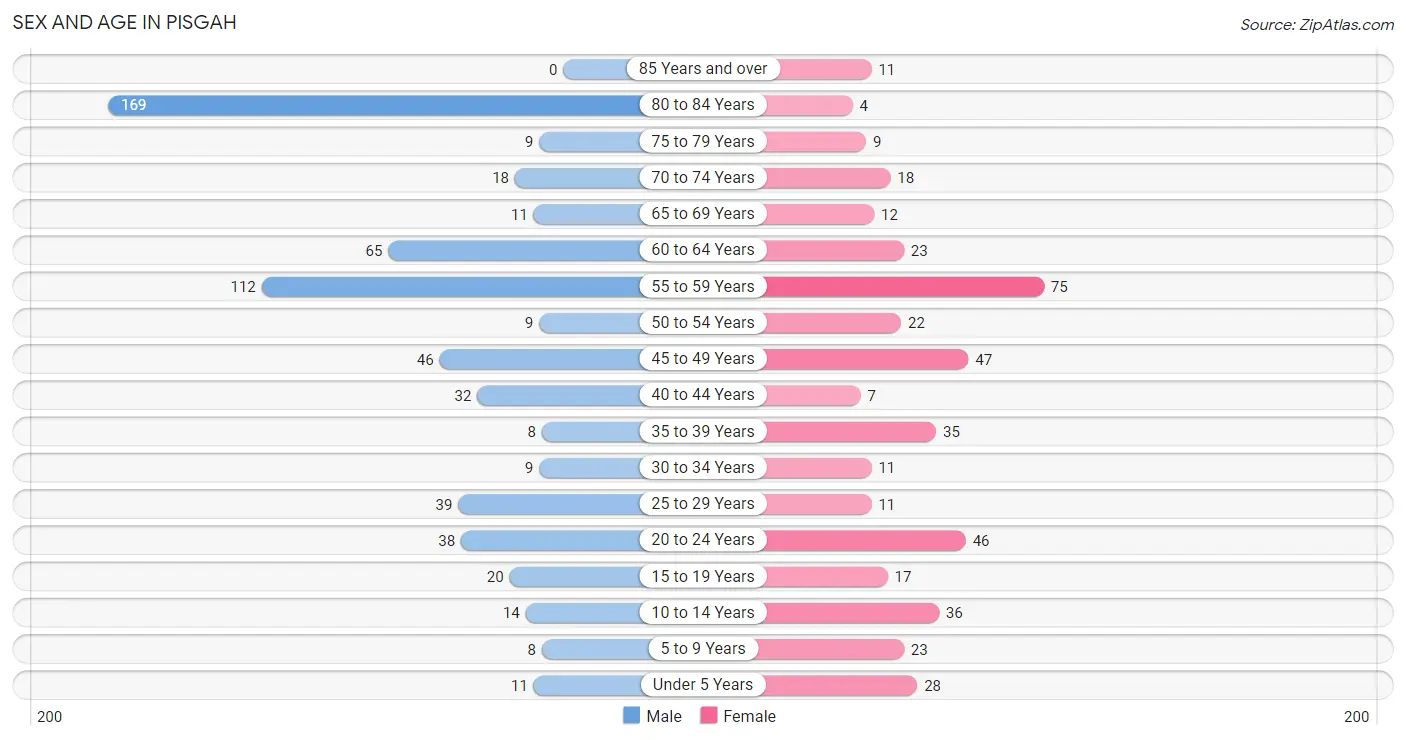
| Age Bracket | Male | Female |
| Under 5 Years | 11 (1.8%) | 28 (6.4%) |
| 5 to 9 Years | 8 (1.3%) | 23 (5.3%) |
| 10 to 14 Years | 14 (2.3%) | 36 (8.3%) |
| 15 to 19 Years | 20 (3.2%) | 17 (3.9%) |
| 20 to 24 Years | 38 (6.1%) | 46 (10.6%) |
| 25 to 29 Years | 39 (6.3%) | 11 (2.5%) |
| 30 to 34 Years | 9 (1.5%) | 11 (2.5%) |
| 35 to 39 Years | 8 (1.3%) | 35 (8.1%) |
| 40 to 44 Years | 32 (5.2%) | 7 (1.6%) |
| 45 to 49 Years | 46 (7.4%) | 47 (10.8%) |
| 50 to 54 Years | 9 (1.5%) | 22 (5.1%) |
| 55 to 59 Years | 112 (18.1%) | 75 (17.2%) |
| 60 to 64 Years | 65 (10.5%) | 23 (5.3%) |
| 65 to 69 Years | 11 (1.8%) | 12 (2.8%) |
| 70 to 74 Years | 18 (2.9%) | 18 (4.1%) |
| 75 to 79 Years | 9 (1.5%) | 9 (2.1%) |
| 80 to 84 Years | 169 (27.4%) | 4 (0.9%) |
| 85 Years and over | 0 (0.0%) | 11 (2.5%) |
| Total | 618 (100.0%) | 435 (100.0%) |
Families and Households in Pisgah
Median Family Size in Pisgah
The median family size in Pisgah is 3.87 persons per family, with single female/mother families (41 | 17.3%) accounting for the largest median family size of 4.78 persons per family. On the other hand, single male/father families (6 | 2.5%) represent the smallest median family size with 3.17 persons per family.
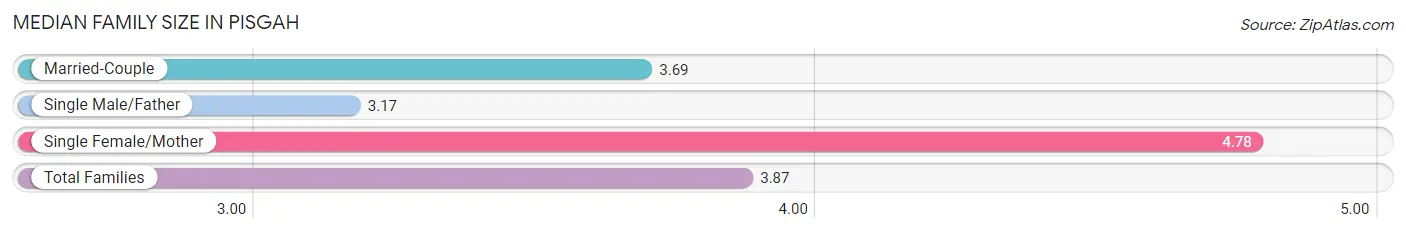
| Family Type | # Families | Family Size |
| Married-Couple | 190 (80.2%) | 3.69 |
| Single Male/Father | 6 (2.5%) | 3.17 |
| Single Female/Mother | 41 (17.3%) | 4.78 |
| Total Families | 237 (100.0%) | 3.87 |
Median Household Size in Pisgah
The median household size in Pisgah is 3.04 persons per household, with single female/mother households (41 | 11.8%) accounting for the largest median household size of 5.07 persons per household. non-family households (109 | 31.5%) represent the smallest median household size with 1.10 persons per household.
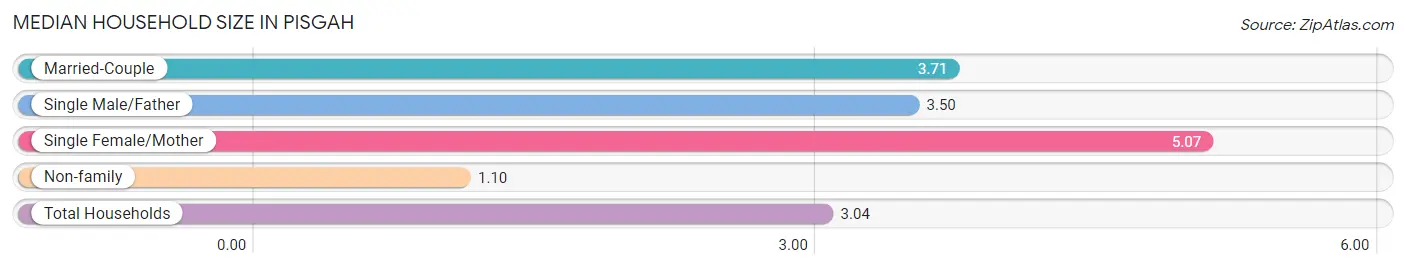
| Household Type | # Households | Household Size |
| Married-Couple | 190 (54.9%) | 3.71 |
| Single Male/Father | 6 (1.7%) | 3.50 |
| Single Female/Mother | 41 (11.8%) | 5.07 |
| Non-family | 109 (31.5%) | 1.10 |
| Total Households | 346 (100.0%) | 3.04 |
Household Size by Marriage Status in Pisgah
Out of a total of 346 households in Pisgah, 237 (68.5%) are family households, while 109 (31.5%) are nonfamily households. The most numerous type of family households are 3-person households, comprising 104, and the most common type of nonfamily households are 1-person households, comprising 101.
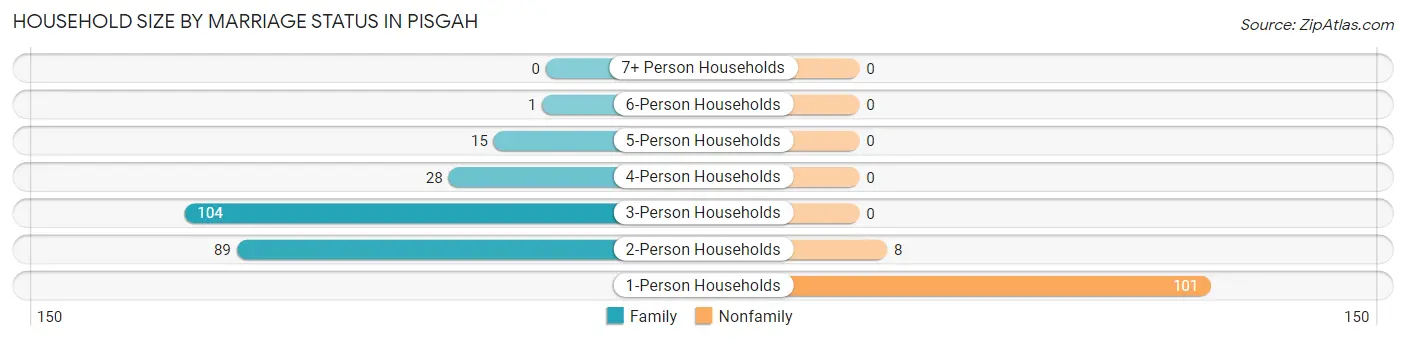
| Household Size | Family Households | Nonfamily Households |
| 1-Person Households | - | 101 (29.2%) |
| 2-Person Households | 89 (25.7%) | 8 (2.3%) |
| 3-Person Households | 104 (30.1%) | 0 (0.0%) |
| 4-Person Households | 28 (8.1%) | 0 (0.0%) |
| 5-Person Households | 15 (4.3%) | 0 (0.0%) |
| 6-Person Households | 1 (0.3%) | 0 (0.0%) |
| 7+ Person Households | 0 (0.0%) | 0 (0.0%) |
| Total | 237 (68.5%) | 109 (31.5%) |
Female Fertility in Pisgah
Fertility by Age in Pisgah
Average fertility rate in Pisgah is 70.0 births per 1,000 women. Women in the age bracket of 20 to 34 years have the highest fertility rate with 191.0 births per 1,000 women. Women in the age bracket of 20 to 34 years acount for 100.0% of all women with births.
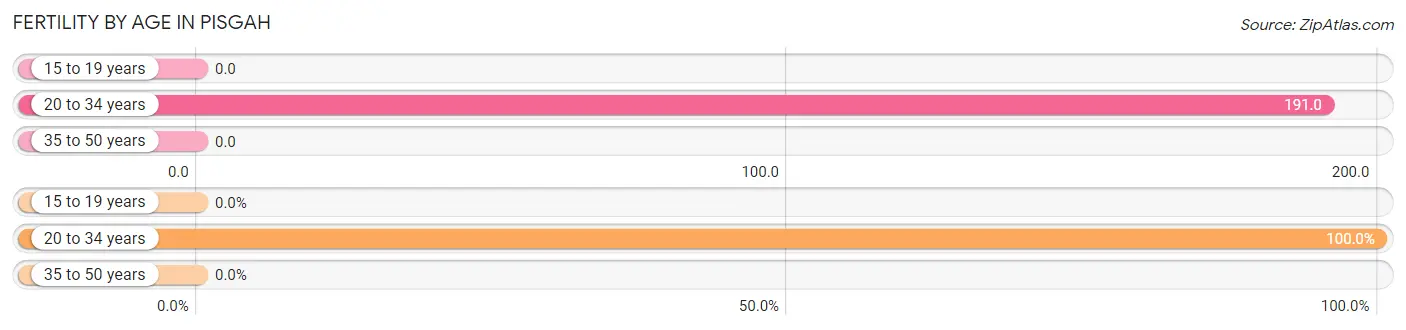
| Age Bracket | Women with Births | Births / 1,000 Women |
| 15 to 19 years | 0 (0.0%) | 0.0 |
| 20 to 34 years | 13 (100.0%) | 191.0 |
| 35 to 50 years | 0 (0.0%) | 0.0 |
| Total | 13 (100.0%) | 70.0 |
Fertility by Age by Marriage Status in Pisgah
53.8% of women with births (13) in Pisgah are married. The highest percentage of unmarried women with births falls into 20 to 34 years age bracket with 46.2% of them unmarried at the time of birth, while the lowest percentage of unmarried women with births belong to 20 to 34 years age bracket with 46.2% of them unmarried.
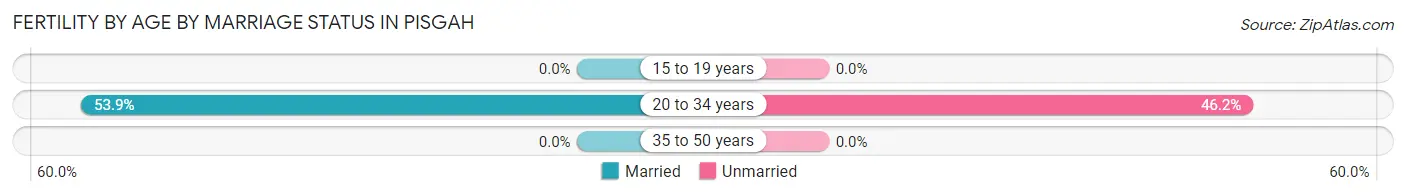
| Age Bracket | Married | Unmarried |
| 15 to 19 years | 0 (0.0%) | 0 (0.0%) |
| 20 to 34 years | 7 (53.8%) | 6 (46.2%) |
| 35 to 50 years | 0 (0.0%) | 0 (0.0%) |
| Total | 7 (53.8%) | 6 (46.2%) |
Fertility by Education in Pisgah
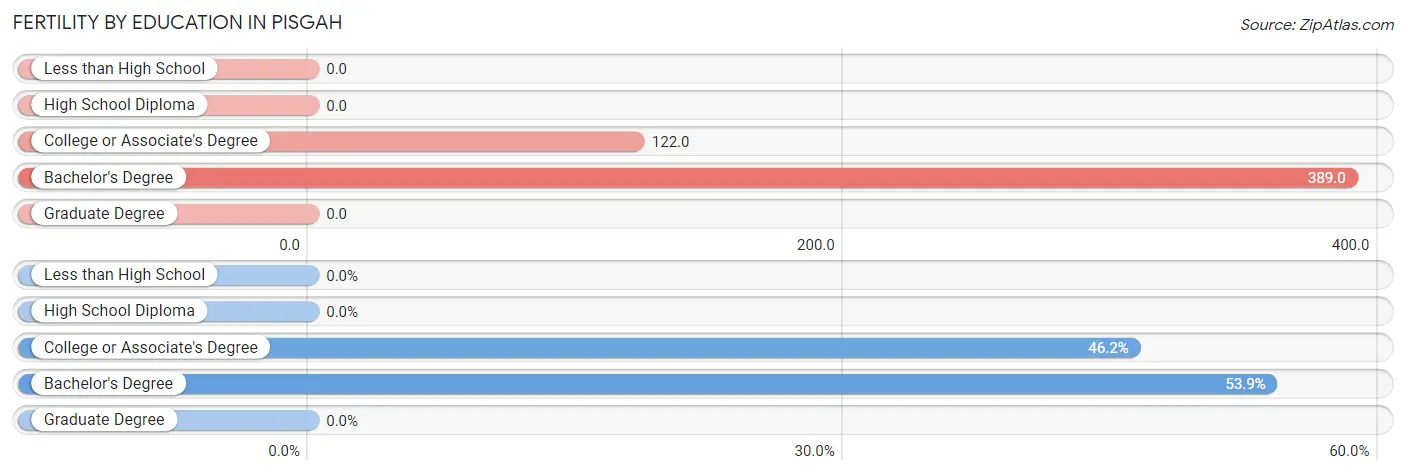
| Educational Attainment | Women with Births | Births / 1,000 Women |
| Less than High School | 0 (0.0%) | 0.0 |
| High School Diploma | 0 (0.0%) | 0.0 |
| College or Associate's Degree | 6 (46.2%) | 122.0 |
| Bachelor's Degree | 7 (53.8%) | 389.0 |
| Graduate Degree | 0 (0.0%) | 0.0 |
| Total | 13 (100.0%) | 70.0 |
Fertility by Education by Marriage Status in Pisgah
46.2% of women with births in Pisgah are unmarried. Women with the educational attainment of bachelor's degree are most likely to be married with 100.0% of them married at childbirth, while women with the educational attainment of college or associate's degree are least likely to be married with 100.0% of them unmarried at childbirth.
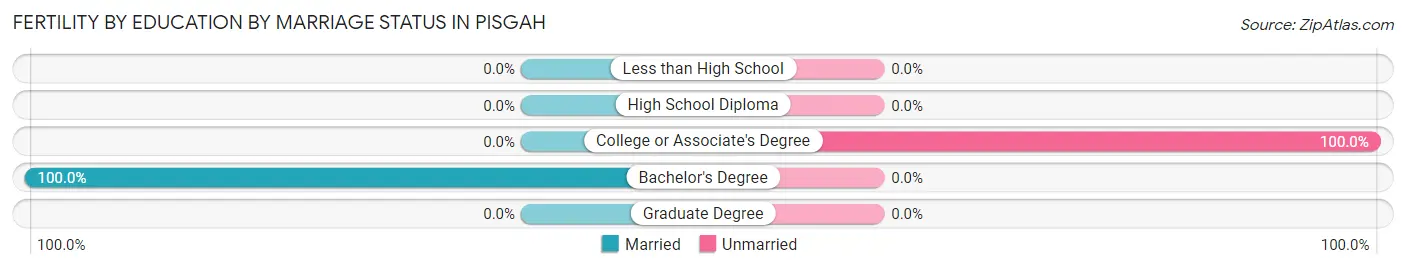
| Educational Attainment | Married | Unmarried |
| Less than High School | 0 (0.0%) | 0 (0.0%) |
| High School Diploma | 0 (0.0%) | 0 (0.0%) |
| College or Associate's Degree | 0 (0.0%) | 6 (100.0%) |
| Bachelor's Degree | 7 (100.0%) | 0 (0.0%) |
| Graduate Degree | 0 (0.0%) | 0 (0.0%) |
| Total | 7 (53.8%) | 6 (46.2%) |
Employment Characteristics in Pisgah
Employment by Class of Employer in Pisgah
Among the 392 employed individuals in Pisgah, private company employees (183 | 46.7%), local government employees (154 | 39.3%), and state government employees (27 | 6.9%) make up the most common classes of employment.
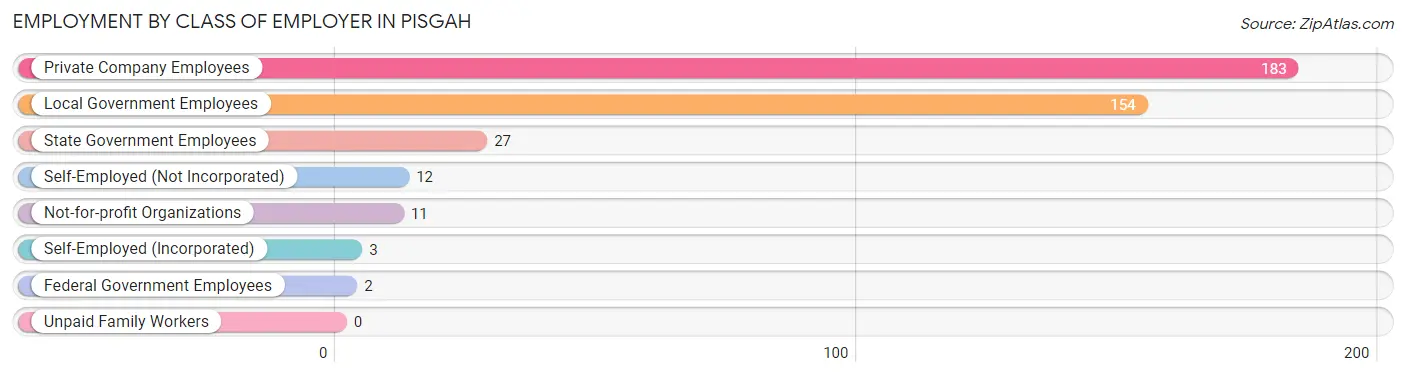
| Employer Class | # Employees | % Employees |
| Private Company Employees | 183 | 46.7% |
| Self-Employed (Incorporated) | 3 | 0.8% |
| Self-Employed (Not Incorporated) | 12 | 3.1% |
| Not-for-profit Organizations | 11 | 2.8% |
| Local Government Employees | 154 | 39.3% |
| State Government Employees | 27 | 6.9% |
| Federal Government Employees | 2 | 0.5% |
| Unpaid Family Workers | 0 | 0.0% |
| Total | 392 | 100.0% |
Employment Status by Age in Pisgah
According to the labor force statistics for Pisgah, out of the total population over 16 years of age (927), 44.7% or 414 individuals are in the labor force, with 5.3% or 22 of them unemployed. The age group with the highest labor force participation rate is 45 to 54 years, with 72.6% or 90 individuals in the labor force. Within the labor force, the 25 to 29 years age range has the highest percentage of unemployed individuals, with 46.4% or 13 of them being unemployed.
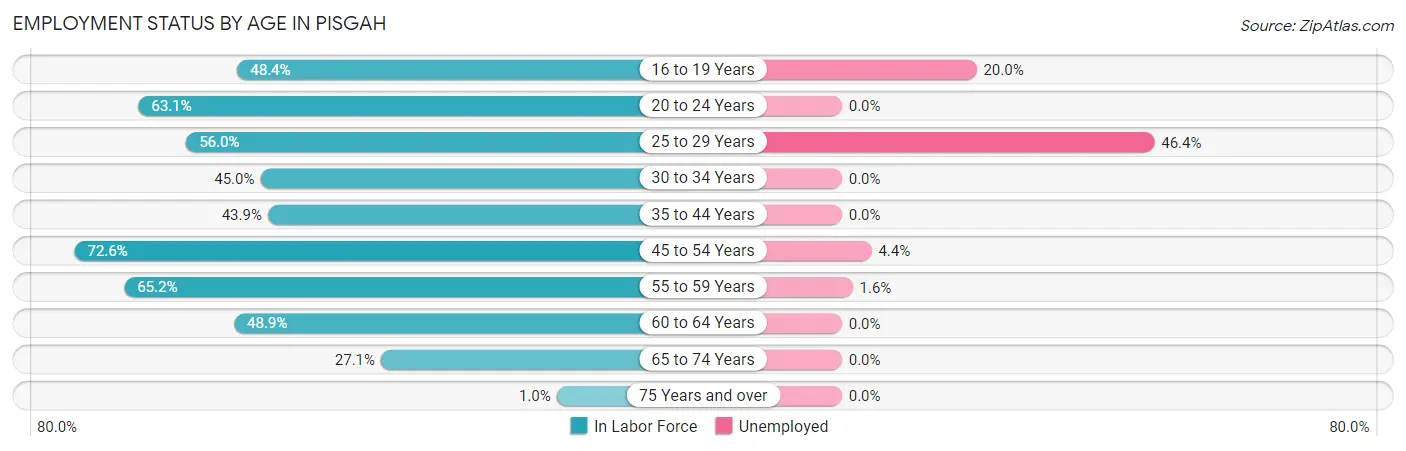
| Age Bracket | In Labor Force | Unemployed |
| 16 to 19 Years | 15 (48.4%) | 3 (20.0%) |
| 20 to 24 Years | 53 (63.1%) | 0 (0.0%) |
| 25 to 29 Years | 28 (56.0%) | 13 (46.4%) |
| 30 to 34 Years | 9 (45.0%) | 0 (0.0%) |
| 35 to 44 Years | 36 (43.9%) | 0 (0.0%) |
| 45 to 54 Years | 90 (72.6%) | 4 (4.4%) |
| 55 to 59 Years | 122 (65.2%) | 2 (1.6%) |
| 60 to 64 Years | 43 (48.9%) | 0 (0.0%) |
| 65 to 74 Years | 16 (27.1%) | 0 (0.0%) |
| 75 Years and over | 2 (1.0%) | 0 (0.0%) |
| Total | 414 (44.7%) | 22 (5.3%) |
Employment Status by Educational Attainment in Pisgah
According to labor force statistics for Pisgah, 59.5% of individuals (328) out of the total population between 25 and 64 years of age (551) are in the labor force, with 5.8% or 19 of them being unemployed. The group with the highest labor force participation rate are those with the educational attainment of bachelor's degree or higher, with 68.1% or 145 individuals in the labor force. Within the labor force, individuals with less than high school education have the highest percentage of unemployment, with 60.7% or 17 of them being unemployed.
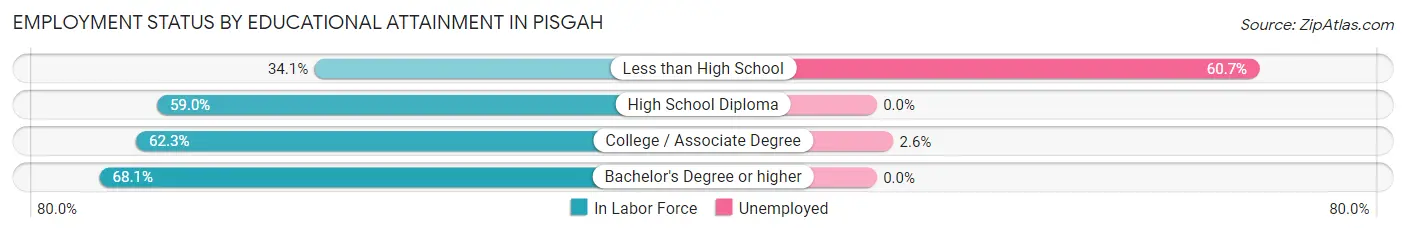
| Educational Attainment | In Labor Force | Unemployed |
| Less than High School | 28 (34.1%) | 50 (60.7%) |
| High School Diploma | 79 (59.0%) | 0 (0.0%) |
| College / Associate Degree | 76 (62.3%) | 3 (2.6%) |
| Bachelor's Degree or higher | 145 (68.1%) | 0 (0.0%) |
| Total | 328 (59.5%) | 32 (5.8%) |
Employment Occupations by Sex in Pisgah
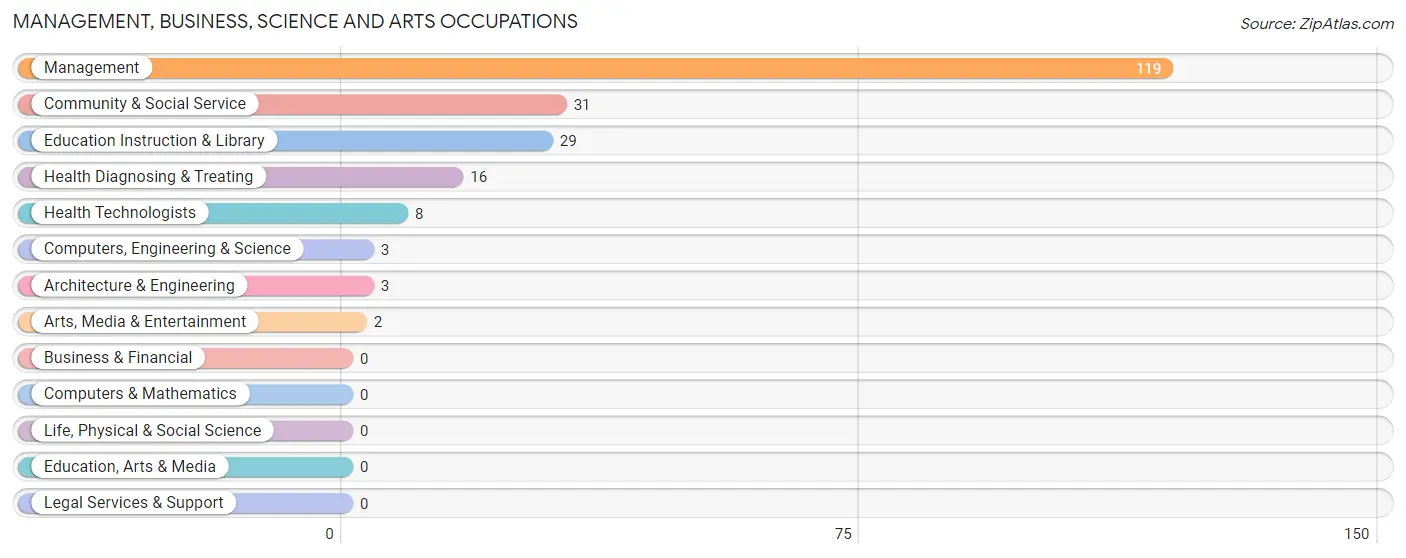
Management, Business, Science and Arts Occupations
The most common Management, Business, Science and Arts occupations in Pisgah are Management (119 | 30.4%), Community & Social Service (31 | 7.9%), Education Instruction & Library (29 | 7.4%), Health Diagnosing & Treating (16 | 4.1%), and Health Technologists (8 | 2.0%).
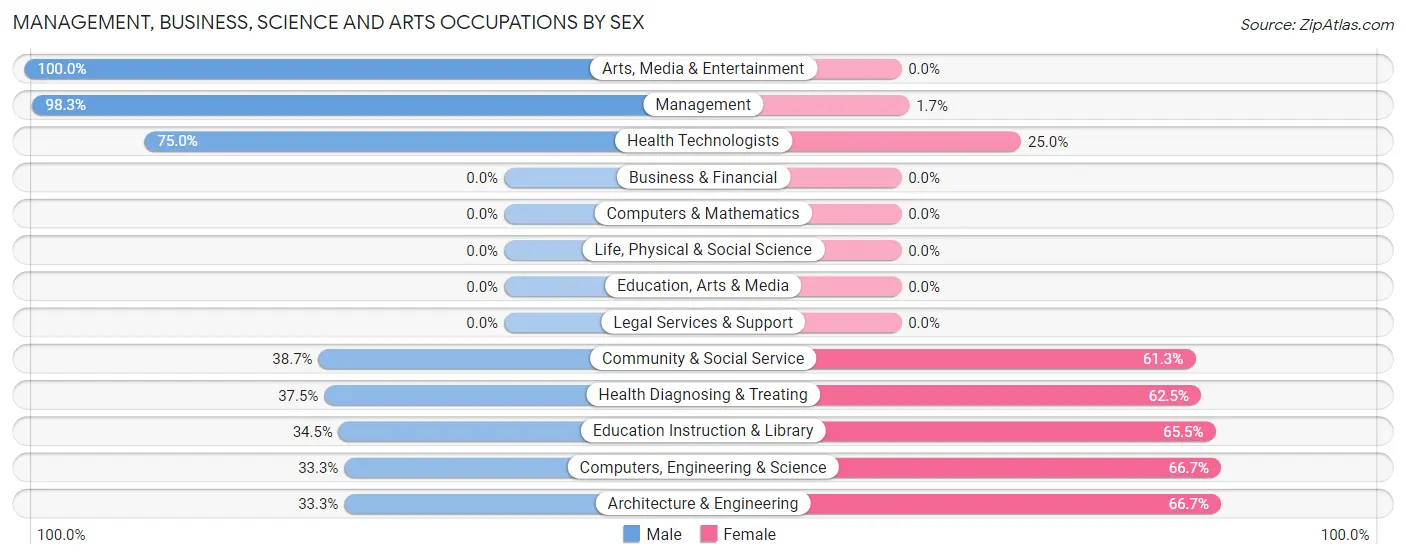
Management, Business, Science and Arts Occupations by Sex
Within the Management, Business, Science and Arts occupations in Pisgah, the most male-oriented occupations are Arts, Media & Entertainment (100.0%), Management (98.3%), and Health Technologists (75.0%), while the most female-oriented occupations are Computers, Engineering & Science (66.7%), Architecture & Engineering (66.7%), and Education Instruction & Library (65.5%).
| Occupation | Male | Female |
| Management | 117 (98.3%) | 2 (1.7%) |
| Business & Financial | 0 (0.0%) | 0 (0.0%) |
| Computers, Engineering & Science | 1 (33.3%) | 2 (66.7%) |
| Computers & Mathematics | 0 (0.0%) | 0 (0.0%) |
| Architecture & Engineering | 1 (33.3%) | 2 (66.7%) |
| Life, Physical & Social Science | 0 (0.0%) | 0 (0.0%) |
| Community & Social Service | 12 (38.7%) | 19 (61.3%) |
| Education, Arts & Media | 0 (0.0%) | 0 (0.0%) |
| Legal Services & Support | 0 (0.0%) | 0 (0.0%) |
| Education Instruction & Library | 10 (34.5%) | 19 (65.5%) |
| Arts, Media & Entertainment | 2 (100.0%) | 0 (0.0%) |
| Health Diagnosing & Treating | 6 (37.5%) | 10 (62.5%) |
| Health Technologists | 6 (75.0%) | 2 (25.0%) |
| Total (Category) | 136 (80.5%) | 33 (19.5%) |
| Total (Overall) | 275 (70.2%) | 117 (29.8%) |
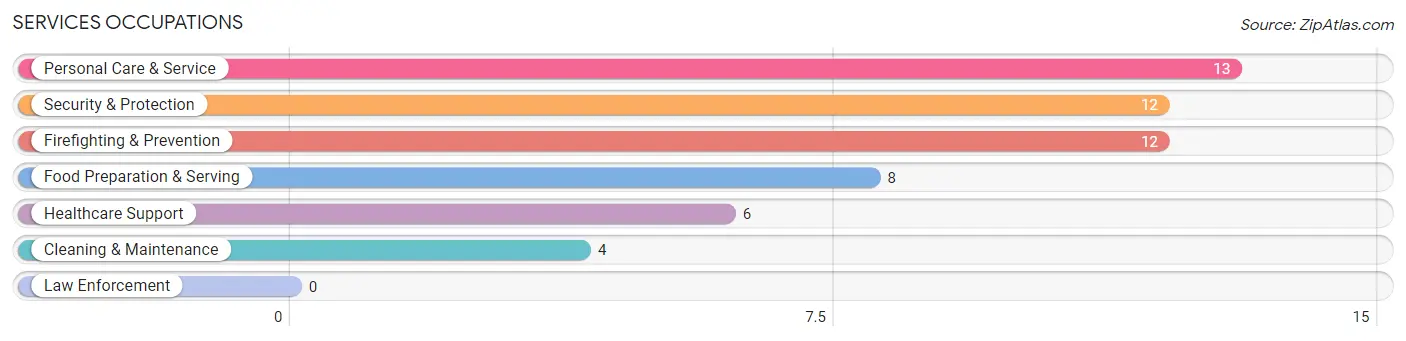
Services Occupations
The most common Services occupations in Pisgah are Personal Care & Service (13 | 3.3%), Security & Protection (12 | 3.1%), Firefighting & Prevention (12 | 3.1%), Food Preparation & Serving (8 | 2.0%), and Healthcare Support (6 | 1.5%).
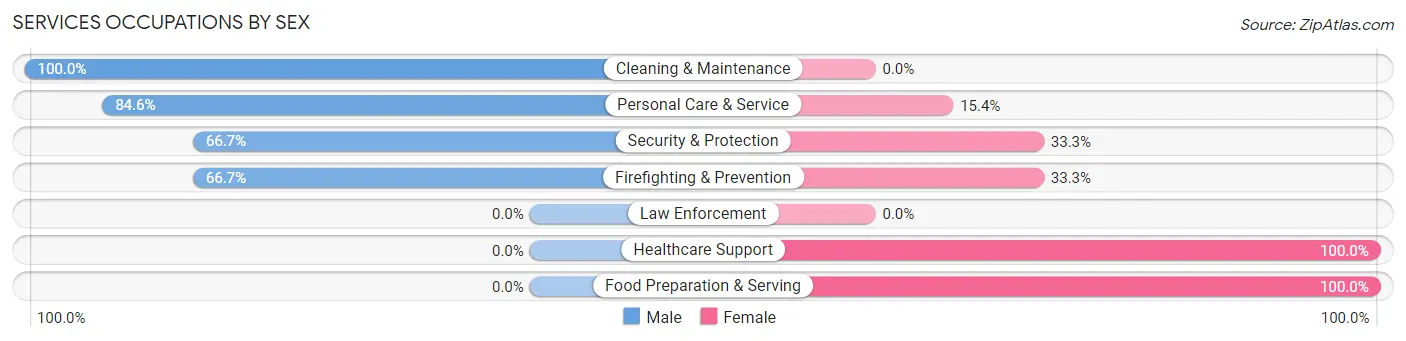
Services Occupations by Sex
Within the Services occupations in Pisgah, the most male-oriented occupations are Cleaning & Maintenance (100.0%), Personal Care & Service (84.6%), and Security & Protection (66.7%), while the most female-oriented occupations are Healthcare Support (100.0%), Food Preparation & Serving (100.0%), and Security & Protection (33.3%).
| Occupation | Male | Female |
| Healthcare Support | 0 (0.0%) | 6 (100.0%) |
| Security & Protection | 8 (66.7%) | 4 (33.3%) |
| Firefighting & Prevention | 8 (66.7%) | 4 (33.3%) |
| Law Enforcement | 0 (0.0%) | 0 (0.0%) |
| Food Preparation & Serving | 0 (0.0%) | 8 (100.0%) |
| Cleaning & Maintenance | 4 (100.0%) | 0 (0.0%) |
| Personal Care & Service | 11 (84.6%) | 2 (15.4%) |
| Total (Category) | 23 (53.5%) | 20 (46.5%) |
| Total (Overall) | 275 (70.2%) | 117 (29.8%) |
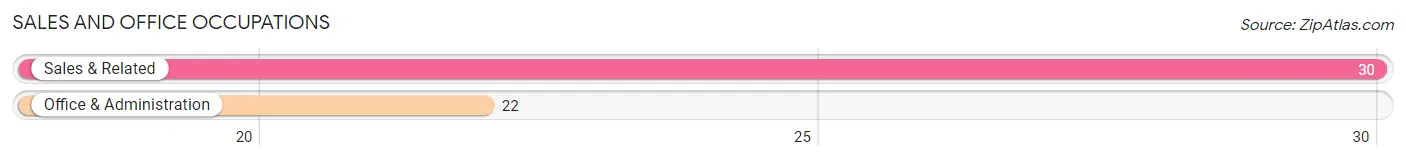
Sales and Office Occupations
The most common Sales and Office occupations in Pisgah are Sales & Related (30 | 7.6%), and Office & Administration (22 | 5.6%).
Sales and Office Occupations by Sex
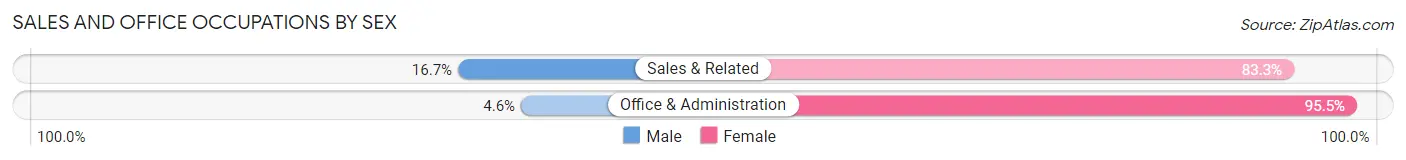
| Occupation | Male | Female |
| Sales & Related | 5 (16.7%) | 25 (83.3%) |
| Office & Administration | 1 (4.5%) | 21 (95.5%) |
| Total (Category) | 6 (11.5%) | 46 (88.5%) |
| Total (Overall) | 275 (70.2%) | 117 (29.8%) |
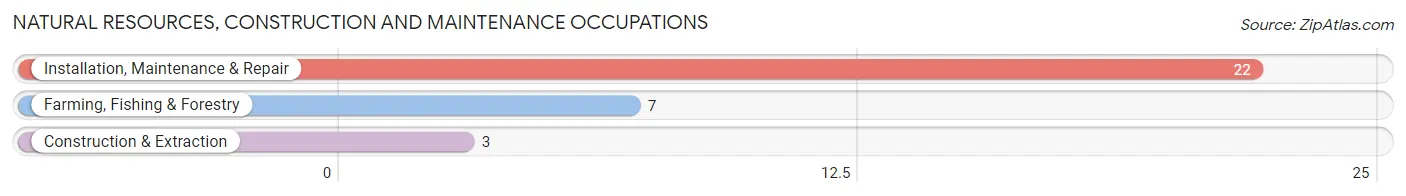
Natural Resources, Construction and Maintenance Occupations
The most common Natural Resources, Construction and Maintenance occupations in Pisgah are Installation, Maintenance & Repair (22 | 5.6%), Farming, Fishing & Forestry (7 | 1.8%), and Construction & Extraction (3 | 0.8%).
Natural Resources, Construction and Maintenance Occupations by Sex
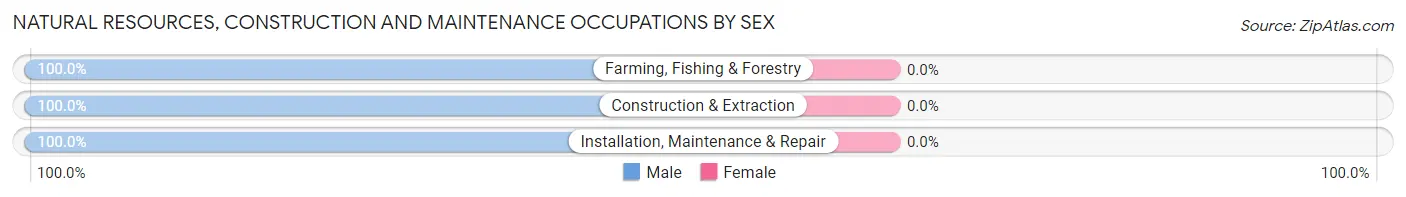
| Occupation | Male | Female |
| Farming, Fishing & Forestry | 7 (100.0%) | 0 (0.0%) |
| Construction & Extraction | 3 (100.0%) | 0 (0.0%) |
| Installation, Maintenance & Repair | 22 (100.0%) | 0 (0.0%) |
| Total (Category) | 32 (100.0%) | 0 (0.0%) |
| Total (Overall) | 275 (70.2%) | 117 (29.8%) |
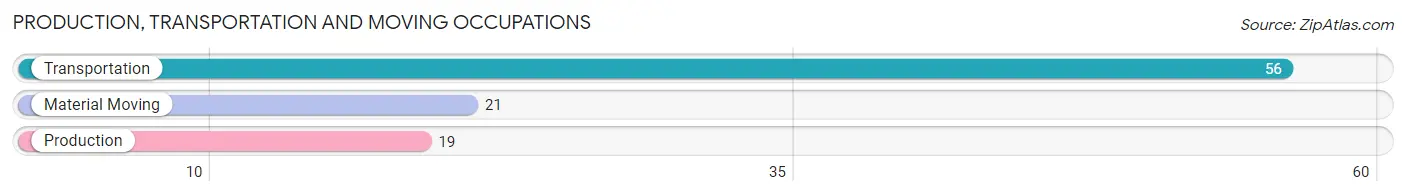
Production, Transportation and Moving Occupations
The most common Production, Transportation and Moving occupations in Pisgah are Transportation (56 | 14.3%), Material Moving (21 | 5.4%), and Production (19 | 4.9%).
Production, Transportation and Moving Occupations by Sex
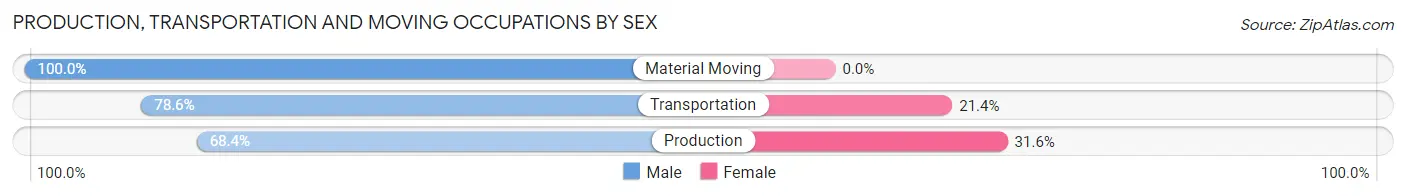
| Occupation | Male | Female |
| Production | 13 (68.4%) | 6 (31.6%) |
| Transportation | 44 (78.6%) | 12 (21.4%) |
| Material Moving | 21 (100.0%) | 0 (0.0%) |
| Total (Category) | 78 (81.2%) | 18 (18.8%) |
| Total (Overall) | 275 (70.2%) | 117 (29.8%) |
Employment Industries by Sex in Pisgah
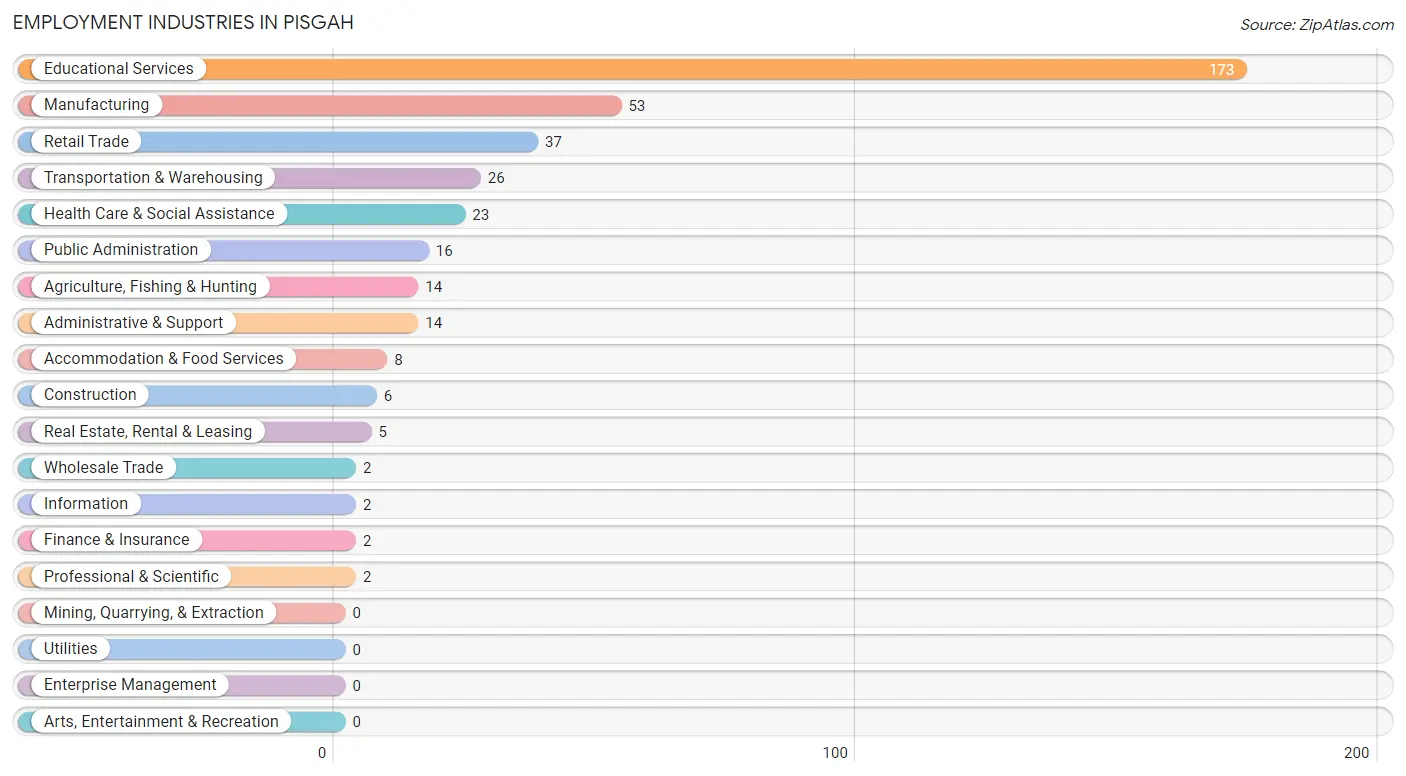
Employment Industries in Pisgah
The major employment industries in Pisgah include Educational Services (173 | 44.1%), Manufacturing (53 | 13.5%), Retail Trade (37 | 9.4%), Transportation & Warehousing (26 | 6.6%), and Health Care & Social Assistance (23 | 5.9%).
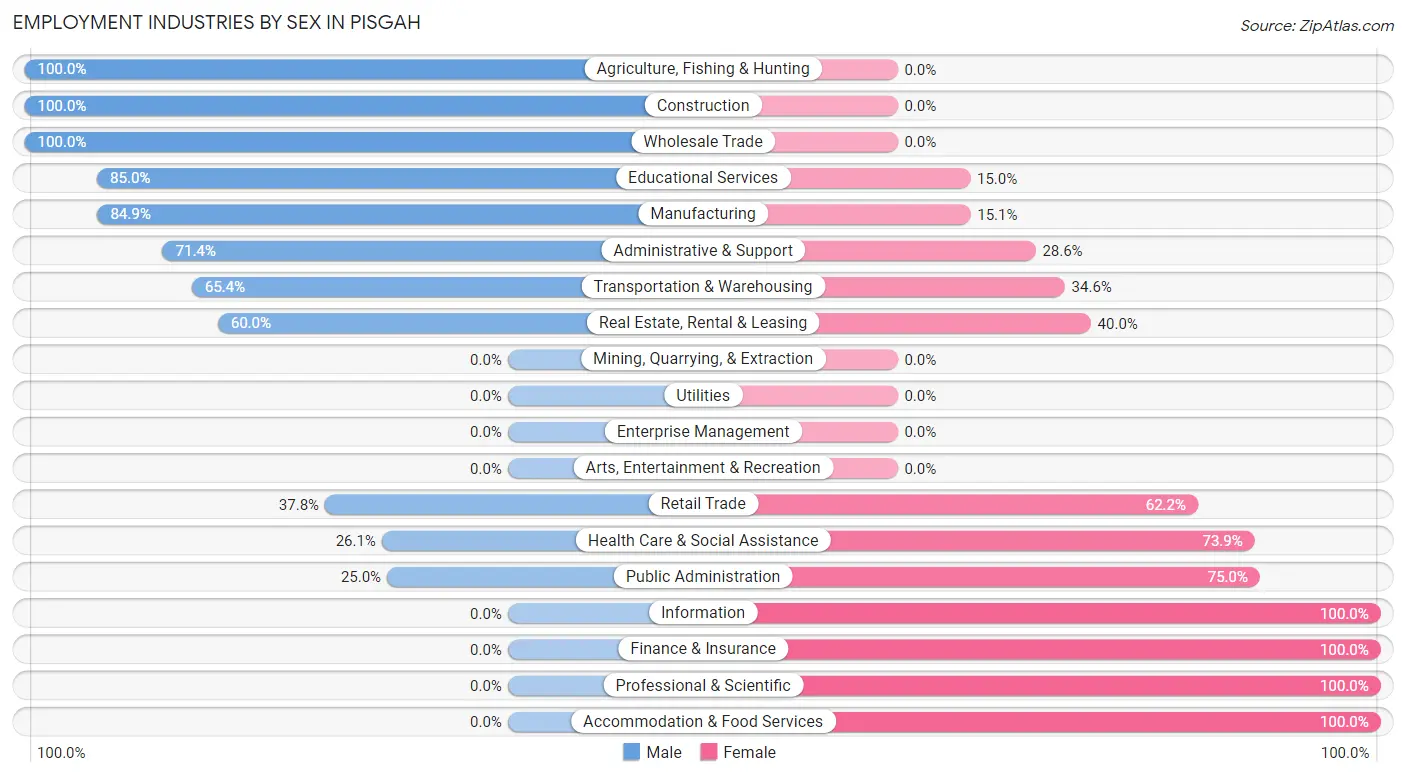
Employment Industries by Sex in Pisgah
The Pisgah industries that see more men than women are Agriculture, Fishing & Hunting (100.0%), Construction (100.0%), and Wholesale Trade (100.0%), whereas the industries that tend to have a higher number of women are Information (100.0%), Finance & Insurance (100.0%), and Professional & Scientific (100.0%).
| Industry | Male | Female |
| Agriculture, Fishing & Hunting | 14 (100.0%) | 0 (0.0%) |
| Mining, Quarrying, & Extraction | 0 (0.0%) | 0 (0.0%) |
| Construction | 6 (100.0%) | 0 (0.0%) |
| Manufacturing | 45 (84.9%) | 8 (15.1%) |
| Wholesale Trade | 2 (100.0%) | 0 (0.0%) |
| Retail Trade | 14 (37.8%) | 23 (62.2%) |
| Transportation & Warehousing | 17 (65.4%) | 9 (34.6%) |
| Utilities | 0 (0.0%) | 0 (0.0%) |
| Information | 0 (0.0%) | 2 (100.0%) |
| Finance & Insurance | 0 (0.0%) | 2 (100.0%) |
| Real Estate, Rental & Leasing | 3 (60.0%) | 2 (40.0%) |
| Professional & Scientific | 0 (0.0%) | 2 (100.0%) |
| Enterprise Management | 0 (0.0%) | 0 (0.0%) |
| Administrative & Support | 10 (71.4%) | 4 (28.6%) |
| Educational Services | 147 (85.0%) | 26 (15.0%) |
| Health Care & Social Assistance | 6 (26.1%) | 17 (73.9%) |
| Arts, Entertainment & Recreation | 0 (0.0%) | 0 (0.0%) |
| Accommodation & Food Services | 0 (0.0%) | 8 (100.0%) |
| Public Administration | 4 (25.0%) | 12 (75.0%) |
| Total | 275 (70.2%) | 117 (29.8%) |
Education in Pisgah
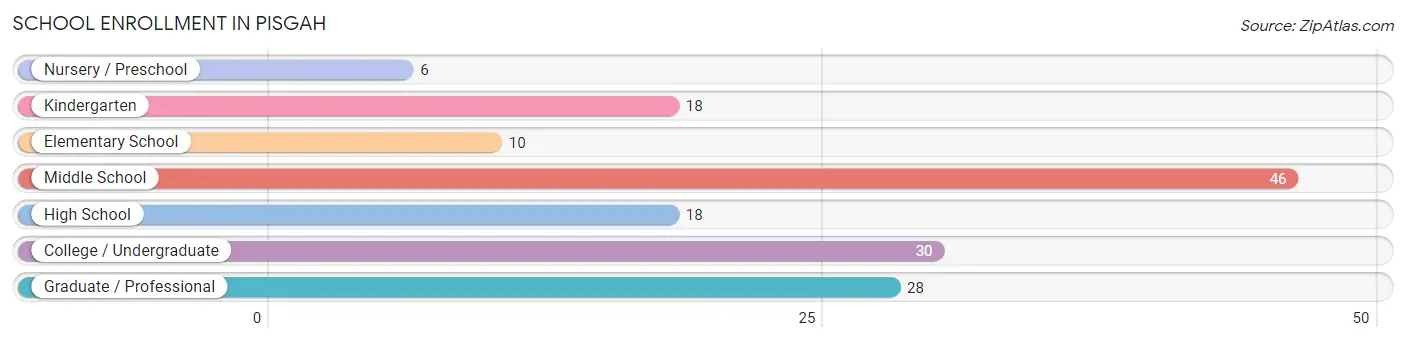
School Enrollment in Pisgah
The most common levels of schooling among the 156 students in Pisgah are middle school (46 | 29.5%), college / undergraduate (30 | 19.2%), and graduate / professional (28 | 17.9%).
| School Level | # Students | % Students |
| Nursery / Preschool | 6 | 3.8% |
| Kindergarten | 18 | 11.5% |
| Elementary School | 10 | 6.4% |
| Middle School | 46 | 29.5% |
| High School | 18 | 11.5% |
| College / Undergraduate | 30 | 19.2% |
| Graduate / Professional | 28 | 17.9% |
| Total | 156 | 100.0% |
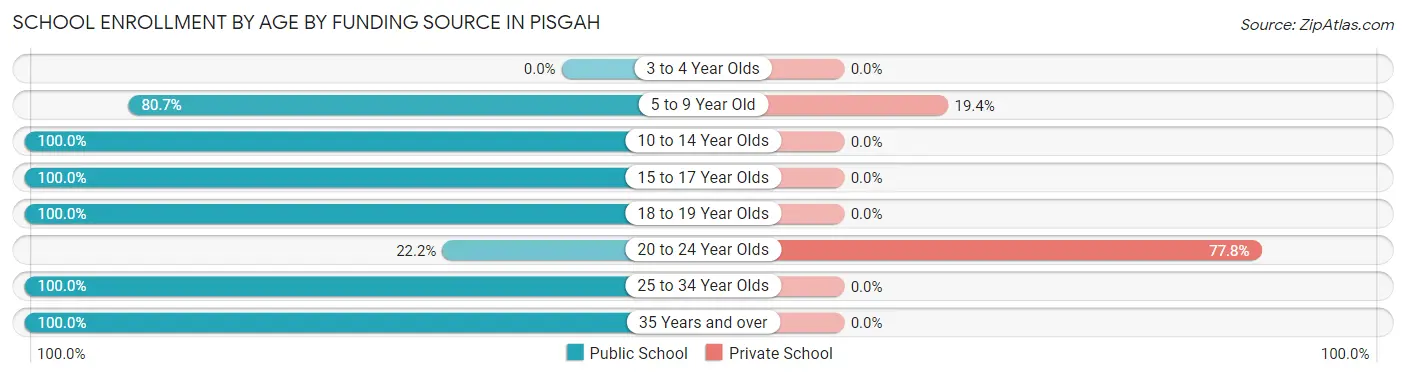
School Enrollment by Age by Funding Source in Pisgah
Out of a total of 156 students who are enrolled in schools in Pisgah, 34 (21.8%) attend a private institution, while the remaining 122 (78.2%) are enrolled in public schools. The age group of 20 to 24 year olds has the highest likelihood of being enrolled in private schools, with 28 (77.8% in the age bracket) enrolled. Conversely, the age group of 10 to 14 year olds has the lowest likelihood of being enrolled in a private school, with 50 (100.0% in the age bracket) attending a public institution.
| Age Bracket | Public School | Private School |
| 3 to 4 Year Olds | 0 (0.0%) | 0 (0.0%) |
| 5 to 9 Year Old | 25 (80.6%) | 6 (19.4%) |
| 10 to 14 Year Olds | 50 (100.0%) | 0 (0.0%) |
| 15 to 17 Year Olds | 10 (100.0%) | 0 (0.0%) |
| 18 to 19 Year Olds | 9 (100.0%) | 0 (0.0%) |
| 20 to 24 Year Olds | 8 (22.2%) | 28 (77.8%) |
| 25 to 34 Year Olds | 15 (100.0%) | 0 (0.0%) |
| 35 Years and over | 5 (100.0%) | 0 (0.0%) |
| Total | 122 (78.2%) | 34 (21.8%) |
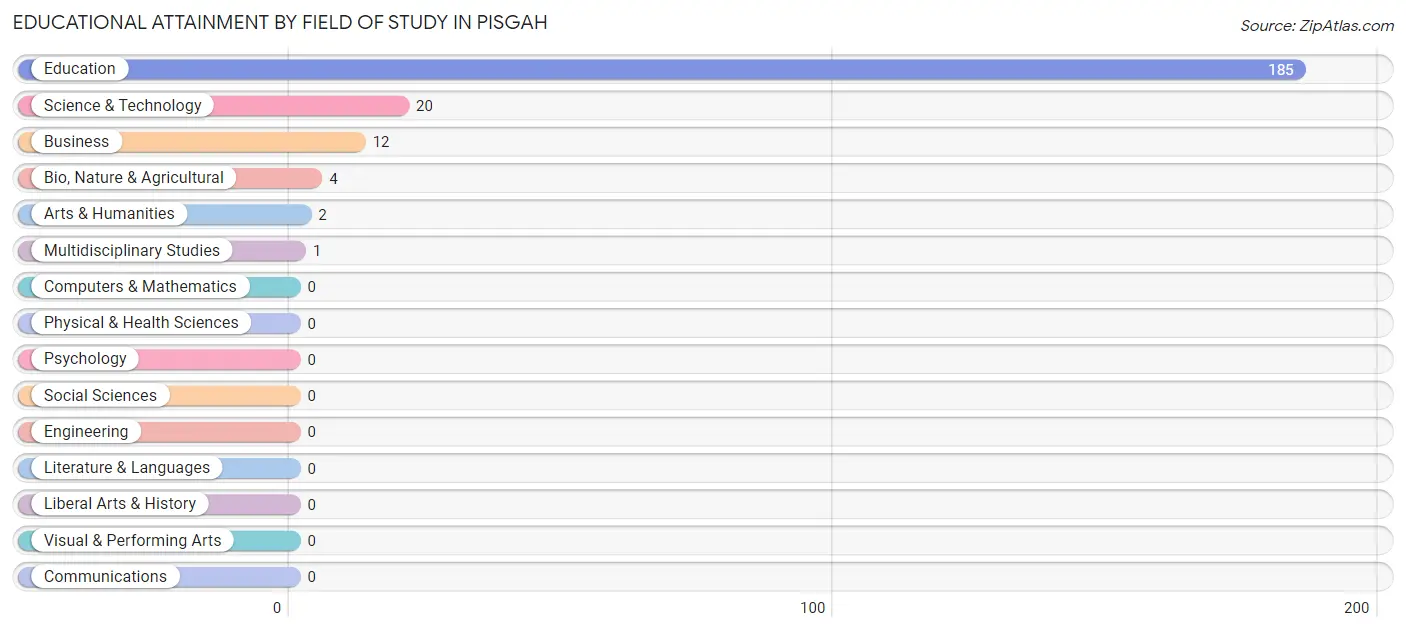
Educational Attainment by Field of Study in Pisgah
Education (185 | 82.6%), science & technology (20 | 8.9%), business (12 | 5.4%), bio, nature & agricultural (4 | 1.8%), and arts & humanities (2 | 0.9%) are the most common fields of study among 224 individuals in Pisgah who have obtained a bachelor's degree or higher.
| Field of Study | # Graduates | % Graduates |
| Computers & Mathematics | 0 | 0.0% |
| Bio, Nature & Agricultural | 4 | 1.8% |
| Physical & Health Sciences | 0 | 0.0% |
| Psychology | 0 | 0.0% |
| Social Sciences | 0 | 0.0% |
| Engineering | 0 | 0.0% |
| Multidisciplinary Studies | 1 | 0.4% |
| Science & Technology | 20 | 8.9% |
| Business | 12 | 5.4% |
| Education | 185 | 82.6% |
| Literature & Languages | 0 | 0.0% |
| Liberal Arts & History | 0 | 0.0% |
| Visual & Performing Arts | 0 | 0.0% |
| Communications | 0 | 0.0% |
| Arts & Humanities | 2 | 0.9% |
| Total | 224 | 100.0% |
Transportation & Commute in Pisgah
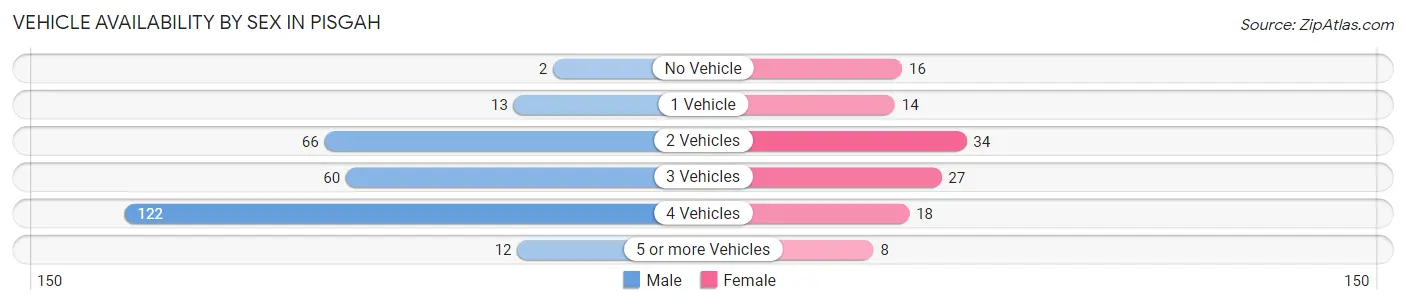
Vehicle Availability by Sex in Pisgah
The most prevalent vehicle ownership categories in Pisgah are males with 4 vehicles (122, accounting for 44.4%) and females with 4 vehicles (18, making up 104.3%).
| Vehicles Available | Male | Female |
| No Vehicle | 2 (0.7%) | 16 (13.7%) |
| 1 Vehicle | 13 (4.7%) | 14 (12.0%) |
| 2 Vehicles | 66 (24.0%) | 34 (29.1%) |
| 3 Vehicles | 60 (21.8%) | 27 (23.1%) |
| 4 Vehicles | 122 (44.4%) | 18 (15.4%) |
| 5 or more Vehicles | 12 (4.4%) | 8 (6.8%) |
| Total | 275 (100.0%) | 117 (100.0%) |
Commute Time in Pisgah
The most frequently occuring commute durations in Pisgah are 10 to 14 minutes (128 commuters, 33.7%), 30 to 34 minutes (53 commuters, 14.0%), and 25 to 29 minutes (47 commuters, 12.4%).
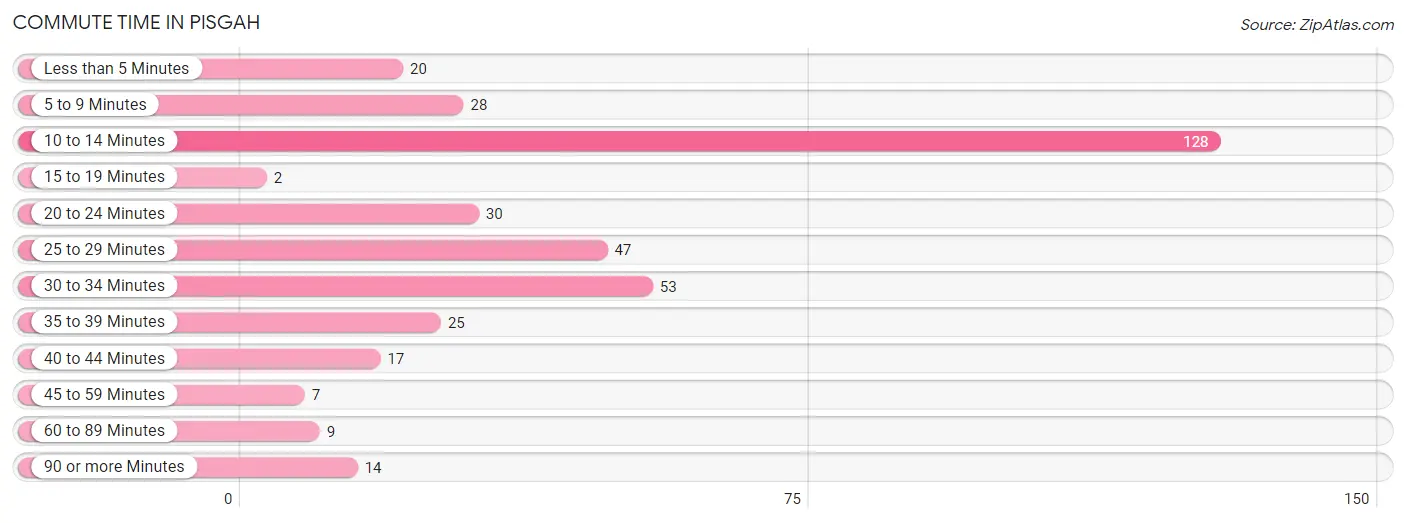
| Commute Time | # Commuters | % Commuters |
| Less than 5 Minutes | 20 | 5.3% |
| 5 to 9 Minutes | 28 | 7.4% |
| 10 to 14 Minutes | 128 | 33.7% |
| 15 to 19 Minutes | 2 | 0.5% |
| 20 to 24 Minutes | 30 | 7.9% |
| 25 to 29 Minutes | 47 | 12.4% |
| 30 to 34 Minutes | 53 | 14.0% |
| 35 to 39 Minutes | 25 | 6.6% |
| 40 to 44 Minutes | 17 | 4.5% |
| 45 to 59 Minutes | 7 | 1.8% |
| 60 to 89 Minutes | 9 | 2.4% |
| 90 or more Minutes | 14 | 3.7% |
Commute Time by Sex in Pisgah
The most common commute times in Pisgah are 10 to 14 minutes (117 commuters, 42.9%) for males and 25 to 29 minutes (25 commuters, 23.4%) for females.
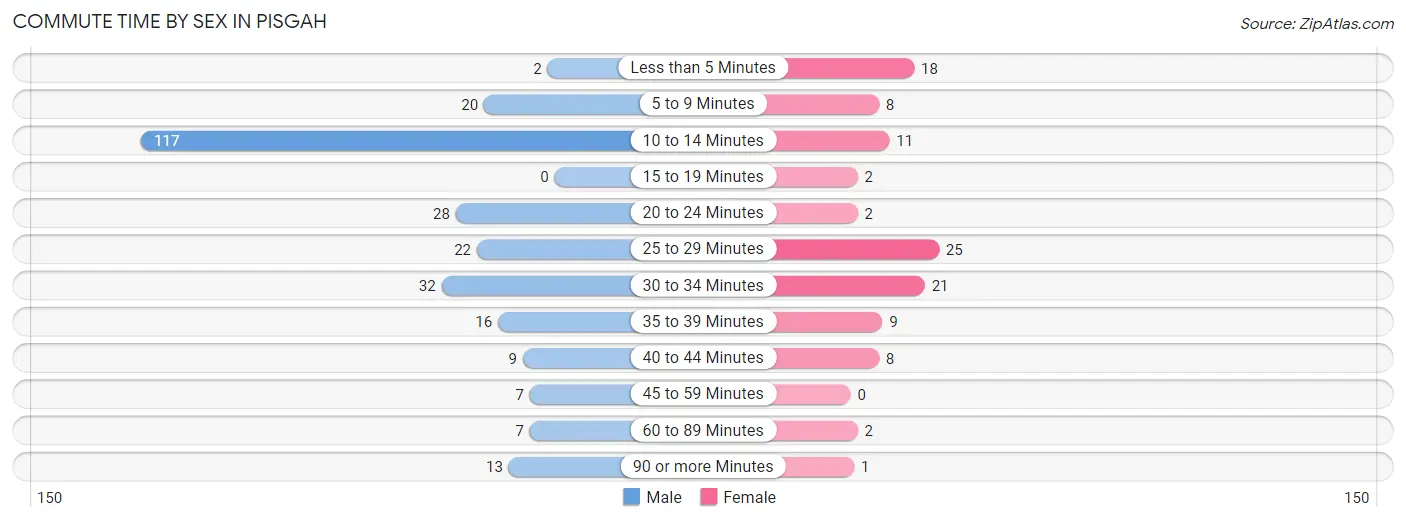
| Commute Time | Male | Female |
| Less than 5 Minutes | 2 (0.7%) | 18 (16.8%) |
| 5 to 9 Minutes | 20 (7.3%) | 8 (7.5%) |
| 10 to 14 Minutes | 117 (42.9%) | 11 (10.3%) |
| 15 to 19 Minutes | 0 (0.0%) | 2 (1.9%) |
| 20 to 24 Minutes | 28 (10.3%) | 2 (1.9%) |
| 25 to 29 Minutes | 22 (8.1%) | 25 (23.4%) |
| 30 to 34 Minutes | 32 (11.7%) | 21 (19.6%) |
| 35 to 39 Minutes | 16 (5.9%) | 9 (8.4%) |
| 40 to 44 Minutes | 9 (3.3%) | 8 (7.5%) |
| 45 to 59 Minutes | 7 (2.6%) | 0 (0.0%) |
| 60 to 89 Minutes | 7 (2.6%) | 2 (1.9%) |
| 90 or more Minutes | 13 (4.8%) | 1 (0.9%) |
Time of Departure to Work by Sex in Pisgah
The most frequent times of departure to work in Pisgah are 5:30 AM to 5:59 AM (119, 43.6%) for males and 7:00 AM to 7:29 AM (44, 41.1%) for females.
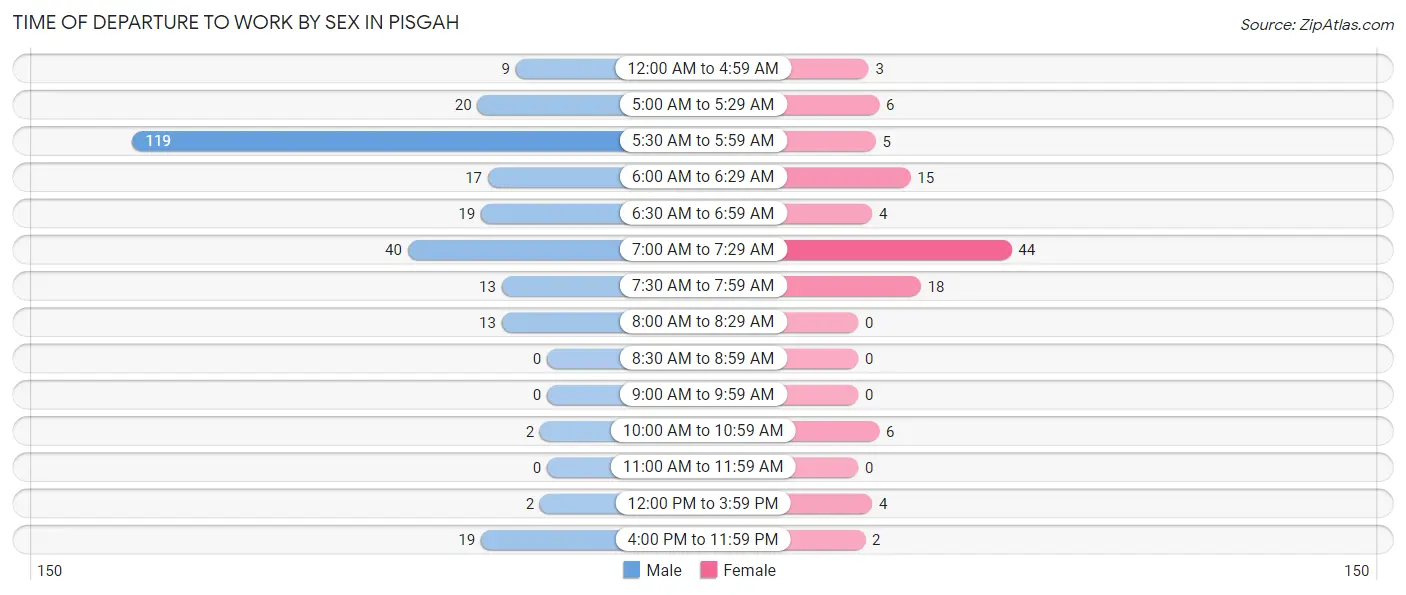
| Time of Departure | Male | Female |
| 12:00 AM to 4:59 AM | 9 (3.3%) | 3 (2.8%) |
| 5:00 AM to 5:29 AM | 20 (7.3%) | 6 (5.6%) |
| 5:30 AM to 5:59 AM | 119 (43.6%) | 5 (4.7%) |
| 6:00 AM to 6:29 AM | 17 (6.2%) | 15 (14.0%) |
| 6:30 AM to 6:59 AM | 19 (7.0%) | 4 (3.7%) |
| 7:00 AM to 7:29 AM | 40 (14.6%) | 44 (41.1%) |
| 7:30 AM to 7:59 AM | 13 (4.8%) | 18 (16.8%) |
| 8:00 AM to 8:29 AM | 13 (4.8%) | 0 (0.0%) |
| 8:30 AM to 8:59 AM | 0 (0.0%) | 0 (0.0%) |
| 9:00 AM to 9:59 AM | 0 (0.0%) | 0 (0.0%) |
| 10:00 AM to 10:59 AM | 2 (0.7%) | 6 (5.6%) |
| 11:00 AM to 11:59 AM | 0 (0.0%) | 0 (0.0%) |
| 12:00 PM to 3:59 PM | 2 (0.7%) | 4 (3.7%) |
| 4:00 PM to 11:59 PM | 19 (7.0%) | 2 (1.9%) |
| Total | 273 (100.0%) | 107 (100.0%) |
Housing Occupancy in Pisgah
Occupancy by Ownership in Pisgah
Of the total 346 dwellings in Pisgah, owner-occupied units account for 284 (82.1%), while renter-occupied units make up 62 (17.9%).
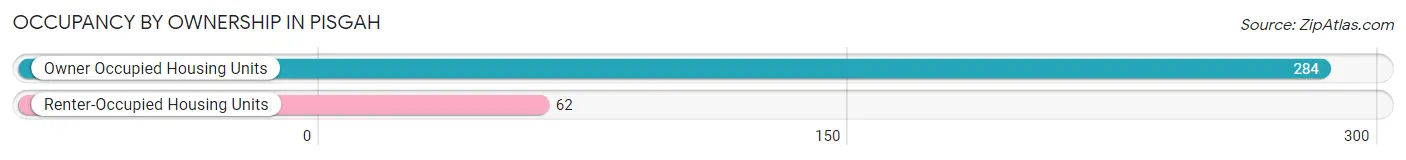
| Occupancy | # Housing Units | % Housing Units |
| Owner Occupied Housing Units | 284 | 82.1% |
| Renter-Occupied Housing Units | 62 | 17.9% |
| Total Occupied Housing Units | 346 | 100.0% |
Occupancy by Household Size in Pisgah
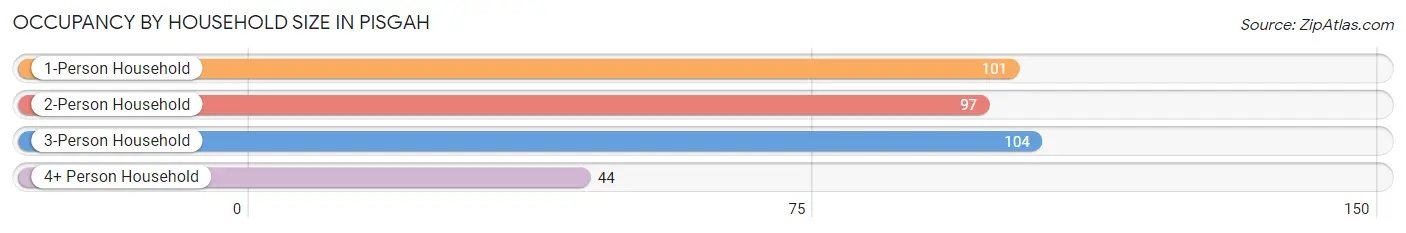
| Household Size | # Housing Units | % Housing Units |
| 1-Person Household | 101 | 29.2% |
| 2-Person Household | 97 | 28.0% |
| 3-Person Household | 104 | 30.1% |
| 4+ Person Household | 44 | 12.7% |
| Total Housing Units | 346 | 100.0% |
Occupancy by Ownership by Household Size in Pisgah
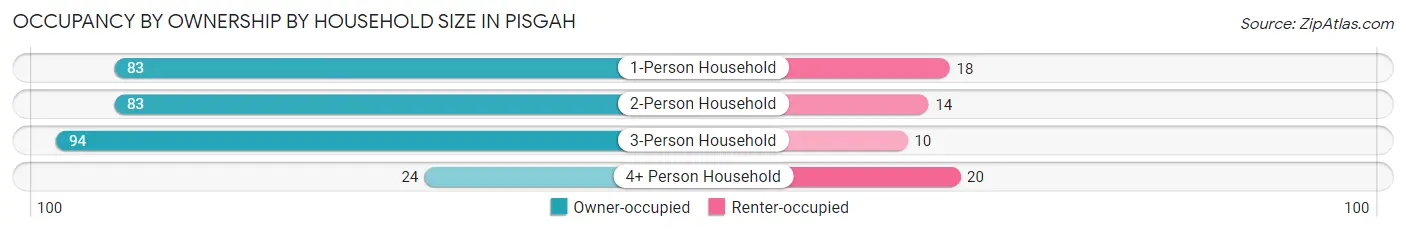
| Household Size | Owner-occupied | Renter-occupied |
| 1-Person Household | 83 (82.2%) | 18 (17.8%) |
| 2-Person Household | 83 (85.6%) | 14 (14.4%) |
| 3-Person Household | 94 (90.4%) | 10 (9.6%) |
| 4+ Person Household | 24 (54.5%) | 20 (45.5%) |
| Total Housing Units | 284 (82.1%) | 62 (17.9%) |
Occupancy by Educational Attainment in Pisgah
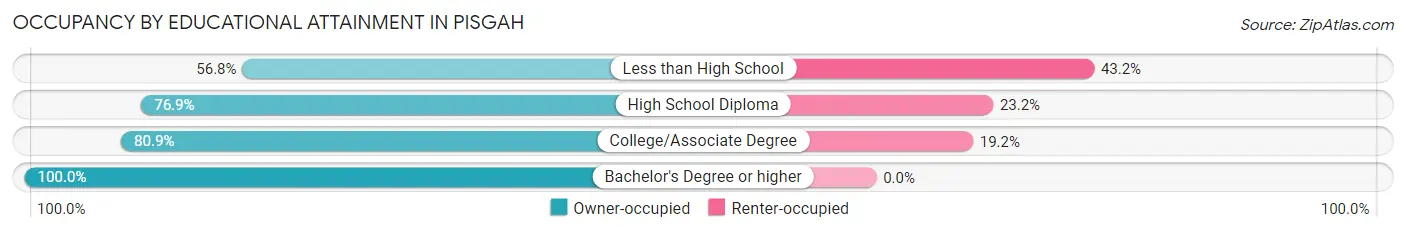
| Household Size | Owner-occupied | Renter-occupied |
| Less than High School | 25 (56.8%) | 19 (43.2%) |
| High School Diploma | 83 (76.8%) | 25 (23.2%) |
| College/Associate Degree | 76 (80.8%) | 18 (19.2%) |
| Bachelor's Degree or higher | 100 (100.0%) | 0 (0.0%) |
Occupancy by Age of Householder in Pisgah
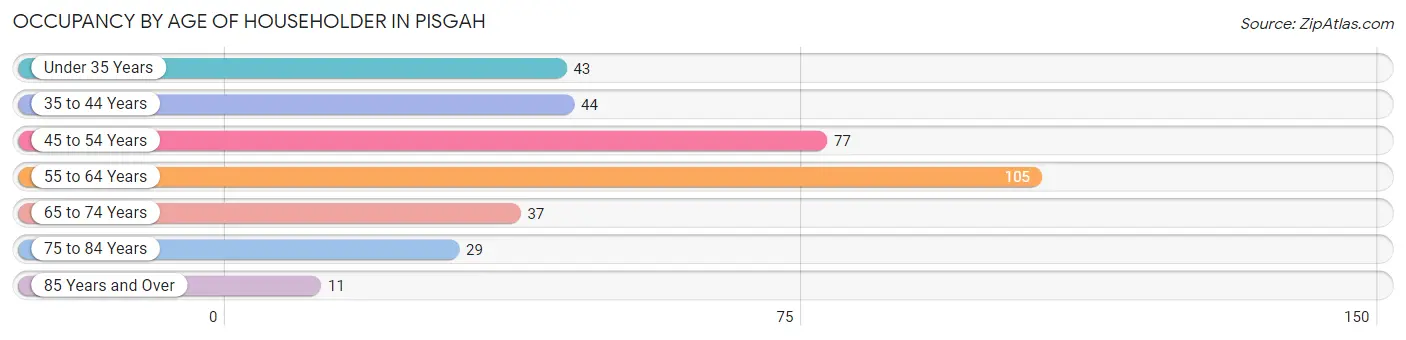
| Age Bracket | # Households | % Households |
| Under 35 Years | 43 | 12.4% |
| 35 to 44 Years | 44 | 12.7% |
| 45 to 54 Years | 77 | 22.3% |
| 55 to 64 Years | 105 | 30.3% |
| 65 to 74 Years | 37 | 10.7% |
| 75 to 84 Years | 29 | 8.4% |
| 85 Years and Over | 11 | 3.2% |
| Total | 346 | 100.0% |
Housing Finances in Pisgah
Median Income by Occupancy in Pisgah
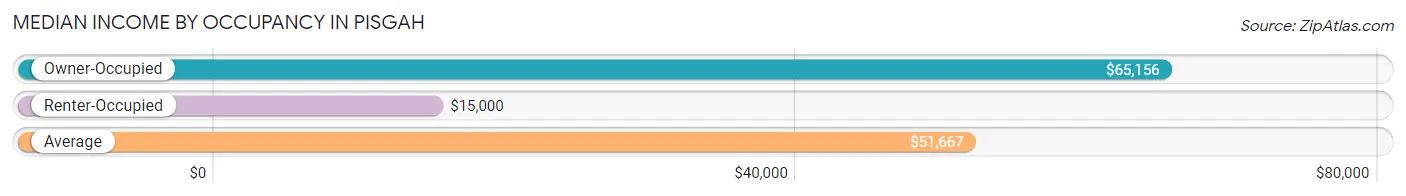
| Occupancy Type | # Households | Median Income |
| Owner-Occupied | 284 (82.1%) | $65,156 |
| Renter-Occupied | 62 (17.9%) | $15,000 |
| Average | 346 (100.0%) | $51,667 |
Occupancy by Householder Income Bracket in Pisgah
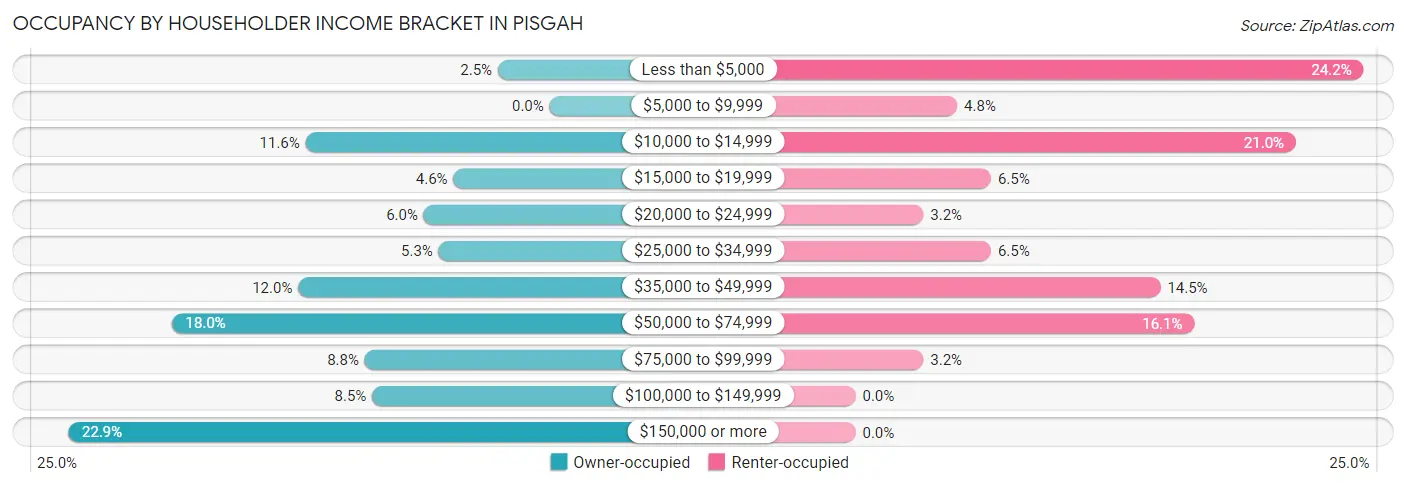
| Income Bracket | Owner-occupied | Renter-occupied |
| Less than $5,000 | 7 (2.5%) | 15 (24.2%) |
| $5,000 to $9,999 | 0 (0.0%) | 3 (4.8%) |
| $10,000 to $14,999 | 33 (11.6%) | 13 (21.0%) |
| $15,000 to $19,999 | 13 (4.6%) | 4 (6.5%) |
| $20,000 to $24,999 | 17 (6.0%) | 2 (3.2%) |
| $25,000 to $34,999 | 15 (5.3%) | 4 (6.5%) |
| $35,000 to $49,999 | 34 (12.0%) | 9 (14.5%) |
| $50,000 to $74,999 | 51 (18.0%) | 10 (16.1%) |
| $75,000 to $99,999 | 25 (8.8%) | 2 (3.2%) |
| $100,000 to $149,999 | 24 (8.5%) | 0 (0.0%) |
| $150,000 or more | 65 (22.9%) | 0 (0.0%) |
| Total | 284 (100.0%) | 62 (100.0%) |
Monthly Housing Cost Tiers in Pisgah
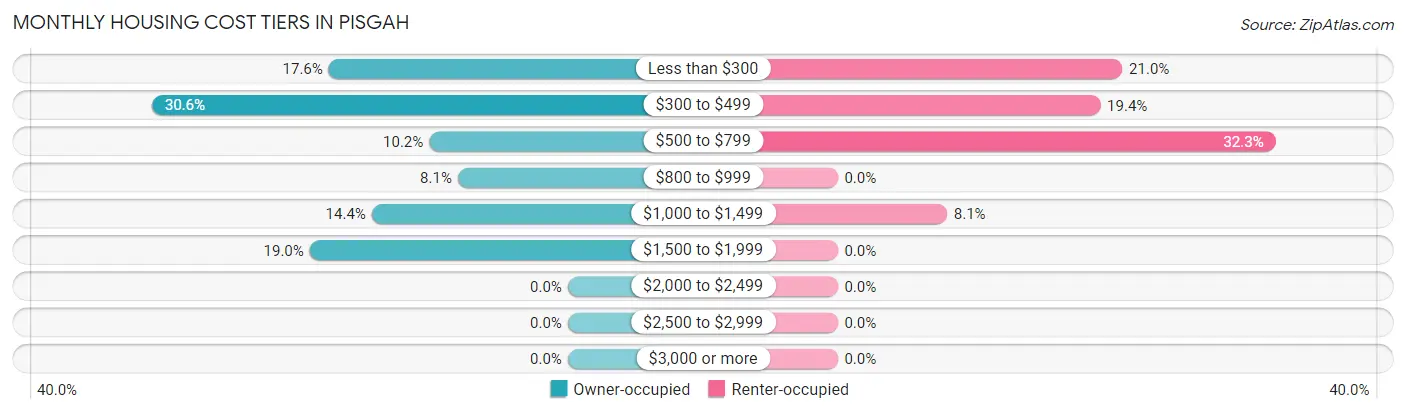
| Monthly Cost | Owner-occupied | Renter-occupied |
| Less than $300 | 50 (17.6%) | 13 (21.0%) |
| $300 to $499 | 87 (30.6%) | 12 (19.4%) |
| $500 to $799 | 29 (10.2%) | 20 (32.3%) |
| $800 to $999 | 23 (8.1%) | 0 (0.0%) |
| $1,000 to $1,499 | 41 (14.4%) | 5 (8.1%) |
| $1,500 to $1,999 | 54 (19.0%) | 0 (0.0%) |
| $2,000 to $2,499 | 0 (0.0%) | 0 (0.0%) |
| $2,500 to $2,999 | 0 (0.0%) | 0 (0.0%) |
| $3,000 or more | 0 (0.0%) | 0 (0.0%) |
| Total | 284 (100.0%) | 62 (100.0%) |
Physical Housing Characteristics in Pisgah
Housing Structures in Pisgah
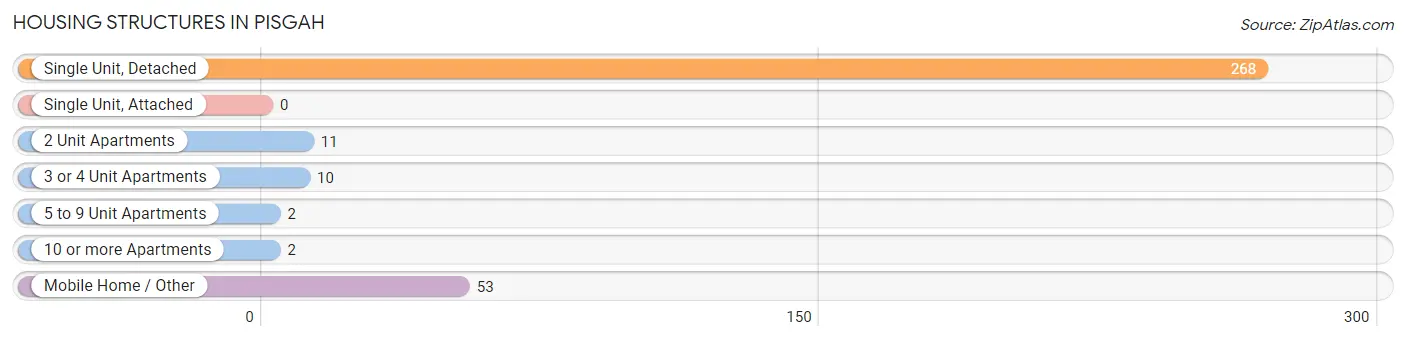
| Structure Type | # Housing Units | % Housing Units |
| Single Unit, Detached | 268 | 77.5% |
| Single Unit, Attached | 0 | 0.0% |
| 2 Unit Apartments | 11 | 3.2% |
| 3 or 4 Unit Apartments | 10 | 2.9% |
| 5 to 9 Unit Apartments | 2 | 0.6% |
| 10 or more Apartments | 2 | 0.6% |
| Mobile Home / Other | 53 | 15.3% |
| Total | 346 | 100.0% |
Housing Structures by Occupancy in Pisgah
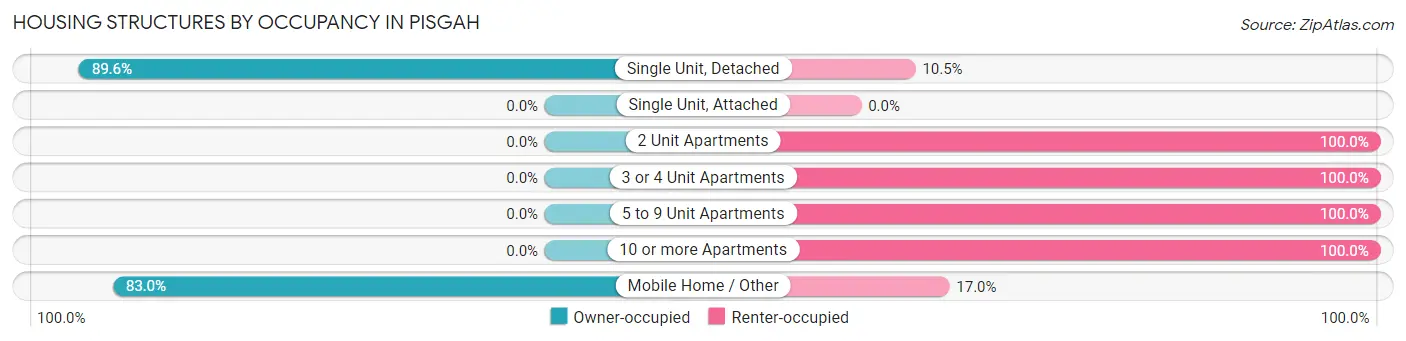
| Structure Type | Owner-occupied | Renter-occupied |
| Single Unit, Detached | 240 (89.5%) | 28 (10.4%) |
| Single Unit, Attached | 0 (0.0%) | 0 (0.0%) |
| 2 Unit Apartments | 0 (0.0%) | 11 (100.0%) |
| 3 or 4 Unit Apartments | 0 (0.0%) | 10 (100.0%) |
| 5 to 9 Unit Apartments | 0 (0.0%) | 2 (100.0%) |
| 10 or more Apartments | 0 (0.0%) | 2 (100.0%) |
| Mobile Home / Other | 44 (83.0%) | 9 (17.0%) |
| Total | 284 (82.1%) | 62 (17.9%) |
Housing Structures by Number of Rooms in Pisgah
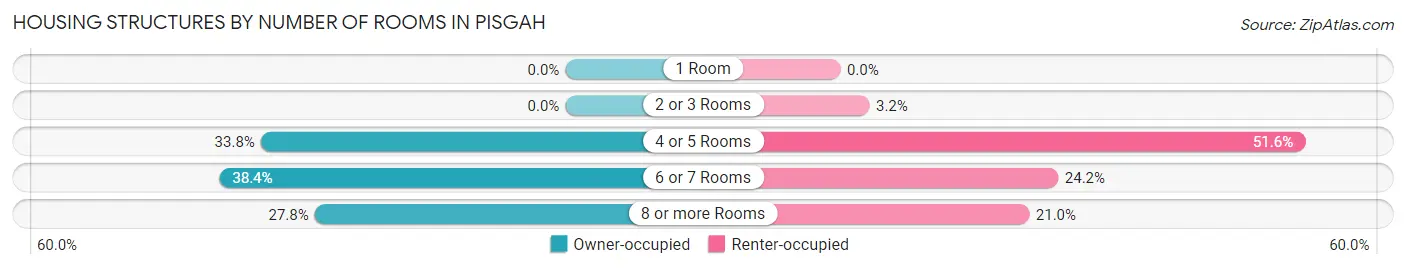
| Number of Rooms | Owner-occupied | Renter-occupied |
| 1 Room | 0 (0.0%) | 0 (0.0%) |
| 2 or 3 Rooms | 0 (0.0%) | 2 (3.2%) |
| 4 or 5 Rooms | 96 (33.8%) | 32 (51.6%) |
| 6 or 7 Rooms | 109 (38.4%) | 15 (24.2%) |
| 8 or more Rooms | 79 (27.8%) | 13 (21.0%) |
| Total | 284 (100.0%) | 62 (100.0%) |
Housing Structure by Heating Type in Pisgah
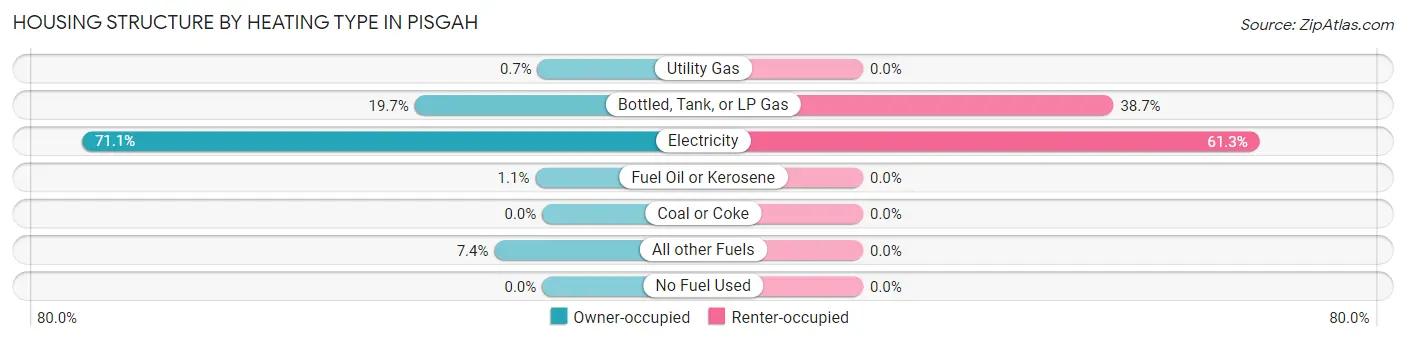
| Heating Type | Owner-occupied | Renter-occupied |
| Utility Gas | 2 (0.7%) | 0 (0.0%) |
| Bottled, Tank, or LP Gas | 56 (19.7%) | 24 (38.7%) |
| Electricity | 202 (71.1%) | 38 (61.3%) |
| Fuel Oil or Kerosene | 3 (1.1%) | 0 (0.0%) |
| Coal or Coke | 0 (0.0%) | 0 (0.0%) |
| All other Fuels | 21 (7.4%) | 0 (0.0%) |
| No Fuel Used | 0 (0.0%) | 0 (0.0%) |
| Total | 284 (100.0%) | 62 (100.0%) |
Household Vehicle Usage in Pisgah
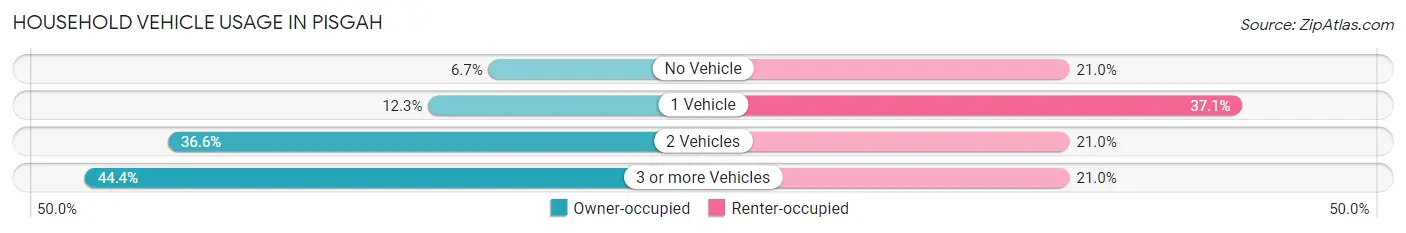
| Vehicles per Household | Owner-occupied | Renter-occupied |
| No Vehicle | 19 (6.7%) | 13 (21.0%) |
| 1 Vehicle | 35 (12.3%) | 23 (37.1%) |
| 2 Vehicles | 104 (36.6%) | 13 (21.0%) |
| 3 or more Vehicles | 126 (44.4%) | 13 (21.0%) |
| Total | 284 (100.0%) | 62 (100.0%) |
Real Estate & Mortgages in Pisgah
Real Estate and Mortgage Overview in Pisgah
| Characteristic | Without Mortgage | With Mortgage |
| Housing Units | 144 | 140 |
| Median Property Value | $134,800 | $0 |
| Median Household Income | $48,611 | $56 |
| Monthly Housing Costs | $344 | $0 |
| Real Estate Taxes | $248 | $10 |
Property Value by Mortgage Status in Pisgah
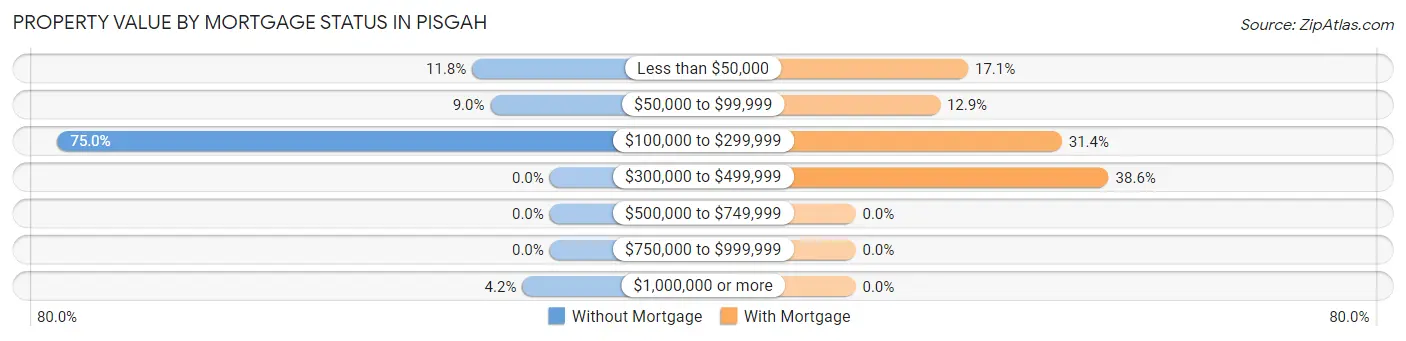
| Property Value | Without Mortgage | With Mortgage |
| Less than $50,000 | 17 (11.8%) | 24 (17.1%) |
| $50,000 to $99,999 | 13 (9.0%) | 18 (12.9%) |
| $100,000 to $299,999 | 108 (75.0%) | 44 (31.4%) |
| $300,000 to $499,999 | 0 (0.0%) | 54 (38.6%) |
| $500,000 to $749,999 | 0 (0.0%) | 0 (0.0%) |
| $750,000 to $999,999 | 0 (0.0%) | 0 (0.0%) |
| $1,000,000 or more | 6 (4.2%) | 0 (0.0%) |
| Total | 144 (100.0%) | 140 (100.0%) |
Household Income by Mortgage Status in Pisgah
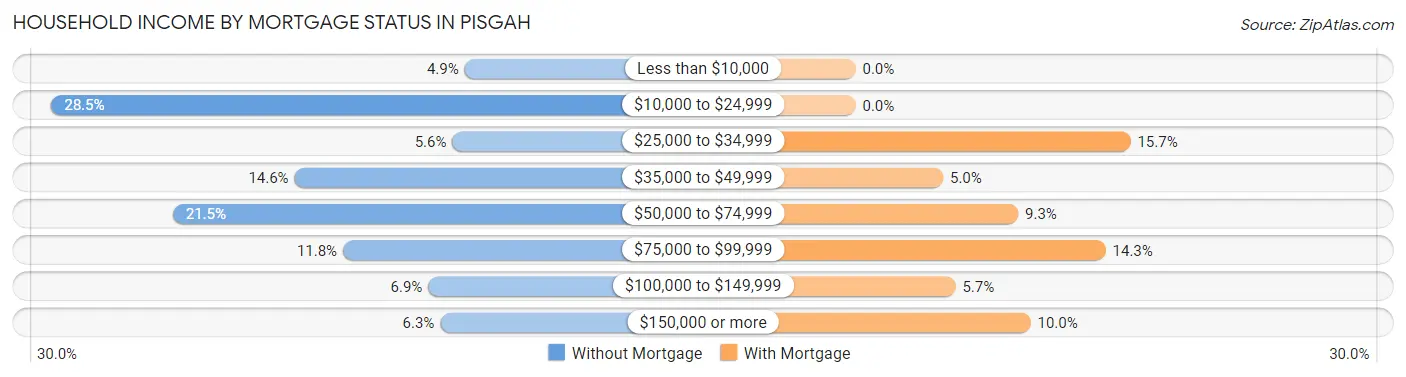
| Household Income | Without Mortgage | With Mortgage |
| Less than $10,000 | 7 (4.9%) | 0 (0.0%) |
| $10,000 to $24,999 | 41 (28.5%) | 0 (0.0%) |
| $25,000 to $34,999 | 8 (5.6%) | 22 (15.7%) |
| $35,000 to $49,999 | 21 (14.6%) | 7 (5.0%) |
| $50,000 to $74,999 | 31 (21.5%) | 13 (9.3%) |
| $75,000 to $99,999 | 17 (11.8%) | 20 (14.3%) |
| $100,000 to $149,999 | 10 (6.9%) | 8 (5.7%) |
| $150,000 or more | 9 (6.2%) | 14 (10.0%) |
| Total | 144 (100.0%) | 140 (100.0%) |
Property Value to Household Income Ratio in Pisgah
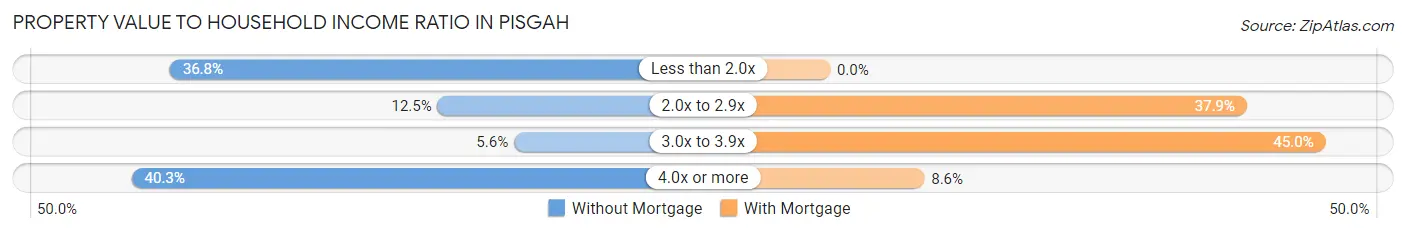
| Value-to-Income Ratio | Without Mortgage | With Mortgage |
| Less than 2.0x | 53 (36.8%) | 0 (0.0%) |
| 2.0x to 2.9x | 18 (12.5%) | 53 (37.9%) |
| 3.0x to 3.9x | 8 (5.6%) | 63 (45.0%) |
| 4.0x or more | 58 (40.3%) | 12 (8.6%) |
| Total | 144 (100.0%) | 140 (100.0%) |
Real Estate Taxes by Mortgage Status in Pisgah
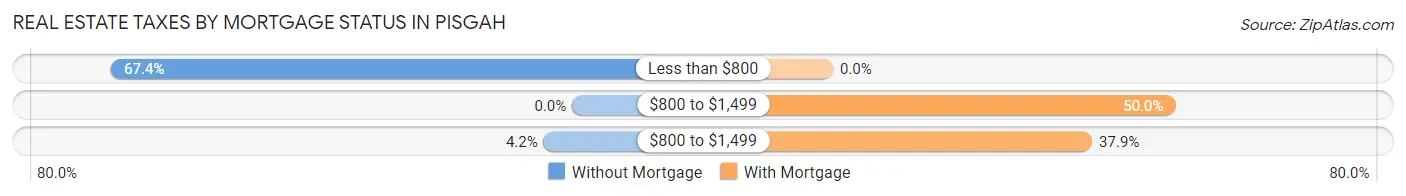
| Property Taxes | Without Mortgage | With Mortgage |
| Less than $800 | 97 (67.4%) | 0 (0.0%) |
| $800 to $1,499 | 0 (0.0%) | 70 (50.0%) |
| $800 to $1,499 | 6 (4.2%) | 53 (37.9%) |
| Total | 144 (100.0%) | 140 (100.0%) |
Health & Disability in Pisgah
Health Insurance Coverage by Age in Pisgah
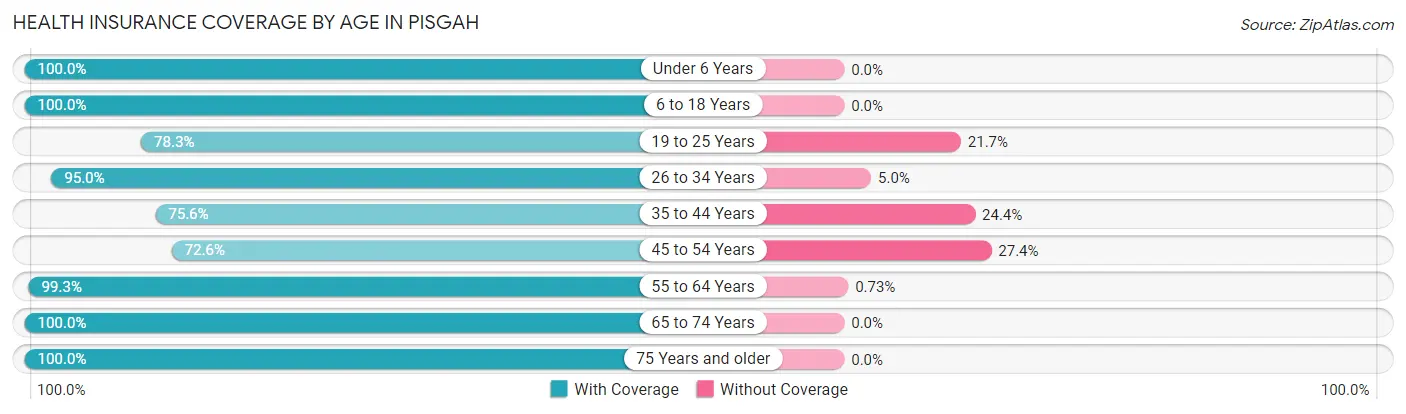
| Age Bracket | With Coverage | Without Coverage |
| Under 6 Years | 46 (100.0%) | 0 (0.0%) |
| 6 to 18 Years | 87 (100.0%) | 0 (0.0%) |
| 19 to 25 Years | 108 (78.3%) | 30 (21.7%) |
| 26 to 34 Years | 38 (95.0%) | 2 (5.0%) |
| 35 to 44 Years | 62 (75.6%) | 20 (24.4%) |
| 45 to 54 Years | 90 (72.6%) | 34 (27.4%) |
| 55 to 64 Years | 273 (99.3%) | 2 (0.7%) |
| 65 to 74 Years | 59 (100.0%) | 0 (0.0%) |
| 75 Years and older | 202 (100.0%) | 0 (0.0%) |
| Total | 965 (91.6%) | 88 (8.4%) |
Health Insurance Coverage by Citizenship Status in Pisgah
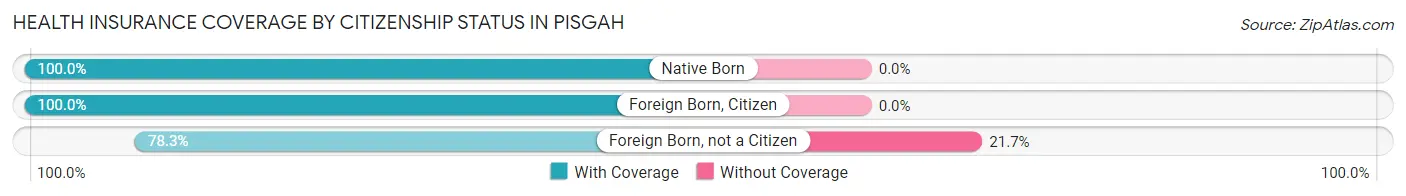
| Citizenship Status | With Coverage | Without Coverage |
| Native Born | 46 (100.0%) | 0 (0.0%) |
| Foreign Born, Citizen | 87 (100.0%) | 0 (0.0%) |
| Foreign Born, not a Citizen | 108 (78.3%) | 30 (21.7%) |
Health Insurance Coverage by Household Income in Pisgah
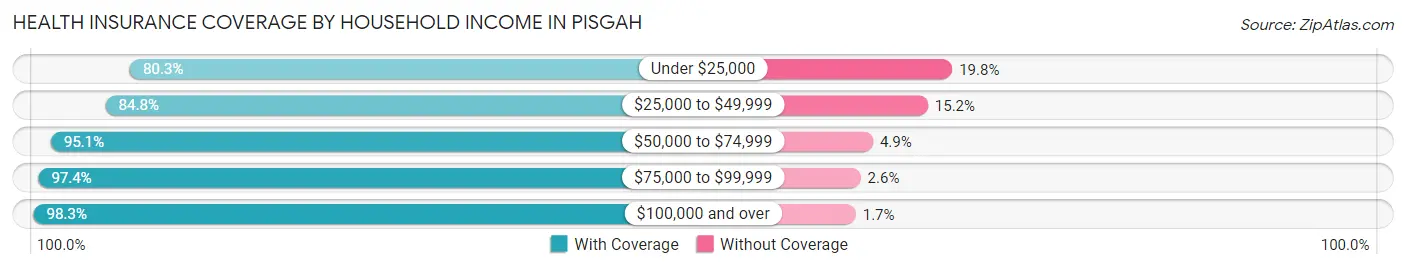
| Household Income | With Coverage | Without Coverage |
| Under $25,000 | 191 (80.2%) | 47 (19.8%) |
| $25,000 to $49,999 | 134 (84.8%) | 24 (15.2%) |
| $50,000 to $74,999 | 155 (95.1%) | 8 (4.9%) |
| $75,000 to $99,999 | 75 (97.4%) | 2 (2.6%) |
| $100,000 and over | 410 (98.3%) | 7 (1.7%) |
Public vs Private Health Insurance Coverage by Age in Pisgah
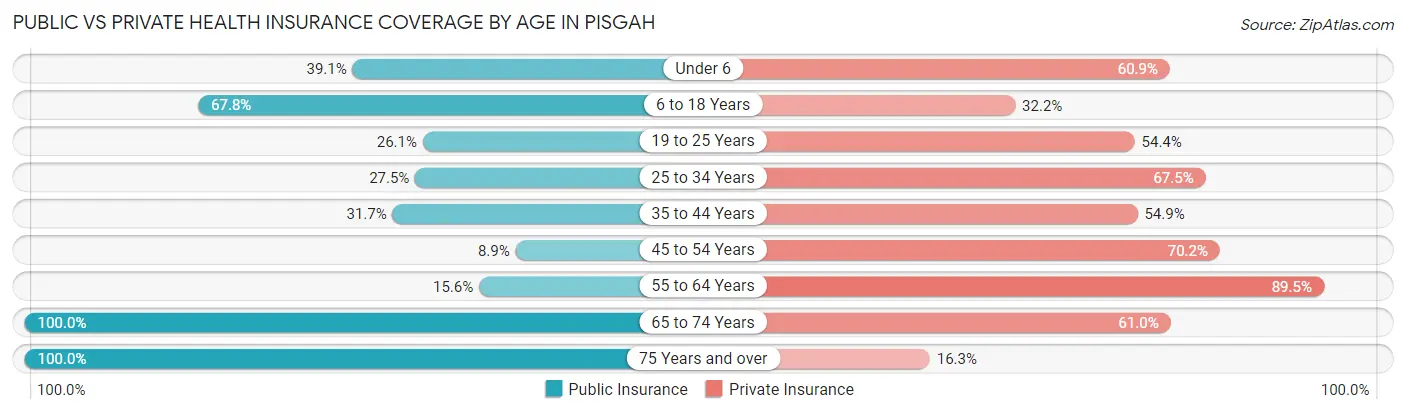
| Age Bracket | Public Insurance | Private Insurance |
| Under 6 | 18 (39.1%) | 28 (60.9%) |
| 6 to 18 Years | 59 (67.8%) | 28 (32.2%) |
| 19 to 25 Years | 36 (26.1%) | 75 (54.3%) |
| 25 to 34 Years | 11 (27.5%) | 27 (67.5%) |
| 35 to 44 Years | 26 (31.7%) | 45 (54.9%) |
| 45 to 54 Years | 11 (8.9%) | 87 (70.2%) |
| 55 to 64 Years | 43 (15.6%) | 246 (89.4%) |
| 65 to 74 Years | 59 (100.0%) | 36 (61.0%) |
| 75 Years and over | 202 (100.0%) | 33 (16.3%) |
| Total | 465 (44.2%) | 605 (57.5%) |
Disability Status by Sex by Age in Pisgah
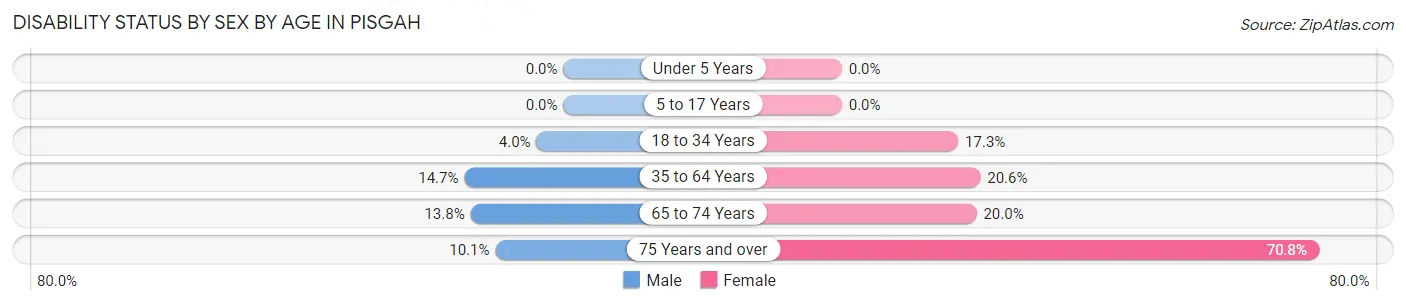
| Age Bracket | Male | Female |
| Under 5 Years | 0 (0.0%) | 0 (0.0%) |
| 5 to 17 Years | 0 (0.0%) | 0 (0.0%) |
| 18 to 34 Years | 4 (4.0%) | 14 (17.3%) |
| 35 to 64 Years | 40 (14.7%) | 43 (20.6%) |
| 65 to 74 Years | 4 (13.8%) | 6 (20.0%) |
| 75 Years and over | 18 (10.1%) | 17 (70.8%) |
Disability Class by Sex by Age in Pisgah
Disability Class: Hearing Difficulty
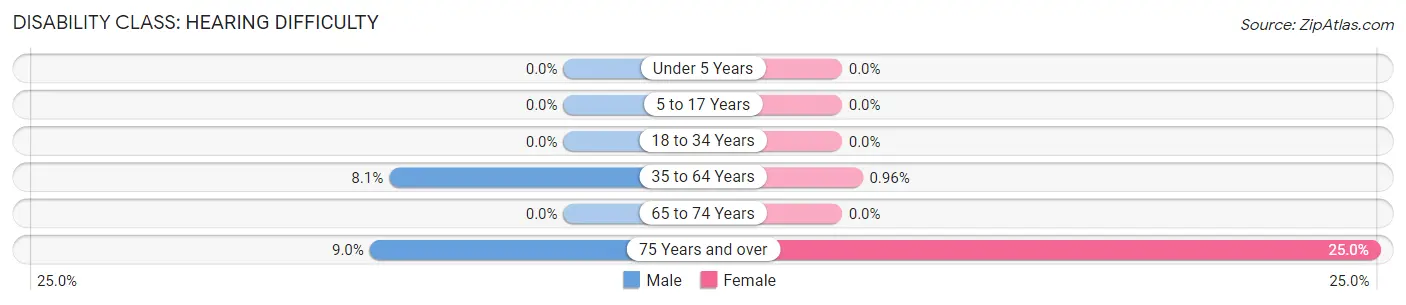
| Age Bracket | Male | Female |
| Under 5 Years | 0 (0.0%) | 0 (0.0%) |
| 5 to 17 Years | 0 (0.0%) | 0 (0.0%) |
| 18 to 34 Years | 0 (0.0%) | 0 (0.0%) |
| 35 to 64 Years | 22 (8.1%) | 2 (1.0%) |
| 65 to 74 Years | 0 (0.0%) | 0 (0.0%) |
| 75 Years and over | 16 (9.0%) | 6 (25.0%) |
Disability Class: Vision Difficulty
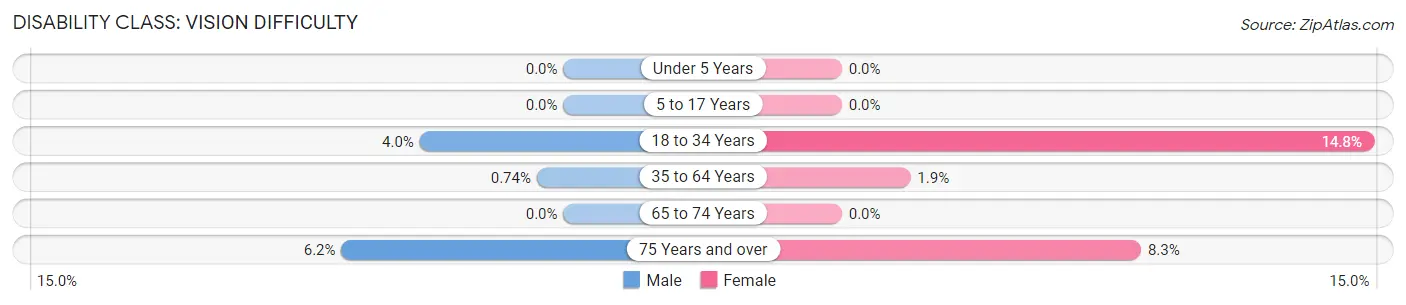
| Age Bracket | Male | Female |
| Under 5 Years | 0 (0.0%) | 0 (0.0%) |
| 5 to 17 Years | 0 (0.0%) | 0 (0.0%) |
| 18 to 34 Years | 4 (4.0%) | 12 (14.8%) |
| 35 to 64 Years | 2 (0.7%) | 4 (1.9%) |
| 65 to 74 Years | 0 (0.0%) | 0 (0.0%) |
| 75 Years and over | 11 (6.2%) | 2 (8.3%) |
Disability Class: Cognitive Difficulty
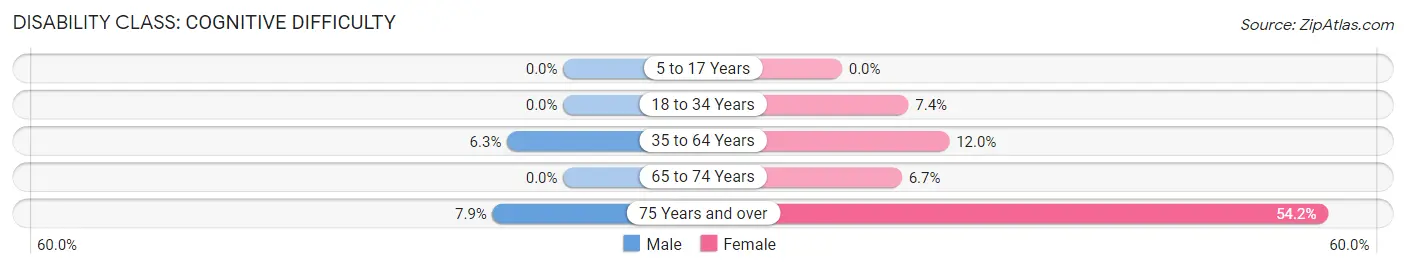
| Age Bracket | Male | Female |
| 5 to 17 Years | 0 (0.0%) | 0 (0.0%) |
| 18 to 34 Years | 0 (0.0%) | 6 (7.4%) |
| 35 to 64 Years | 17 (6.2%) | 25 (12.0%) |
| 65 to 74 Years | 0 (0.0%) | 2 (6.7%) |
| 75 Years and over | 14 (7.9%) | 13 (54.2%) |
Disability Class: Ambulatory Difficulty
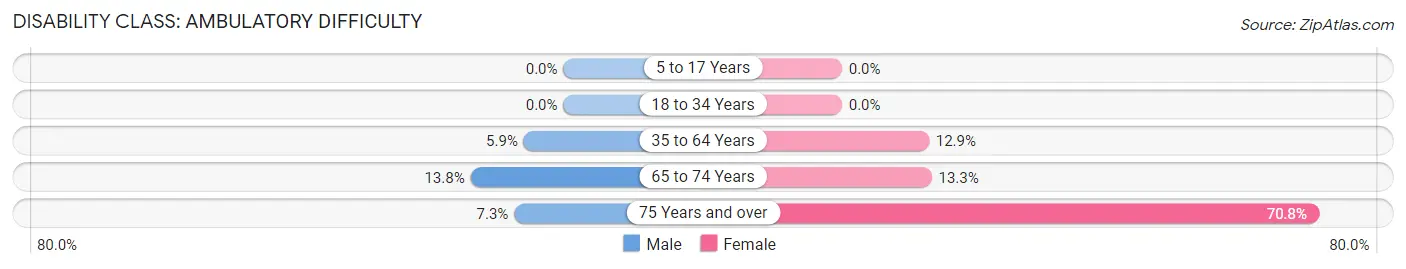
| Age Bracket | Male | Female |
| 5 to 17 Years | 0 (0.0%) | 0 (0.0%) |
| 18 to 34 Years | 0 (0.0%) | 0 (0.0%) |
| 35 to 64 Years | 16 (5.9%) | 27 (12.9%) |
| 65 to 74 Years | 4 (13.8%) | 4 (13.3%) |
| 75 Years and over | 13 (7.3%) | 17 (70.8%) |
Disability Class: Self-Care Difficulty
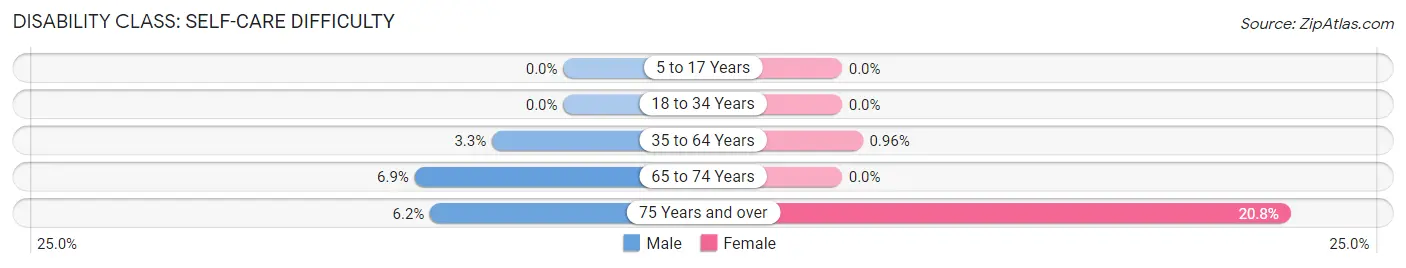
| Age Bracket | Male | Female |
| 5 to 17 Years | 0 (0.0%) | 0 (0.0%) |
| 18 to 34 Years | 0 (0.0%) | 0 (0.0%) |
| 35 to 64 Years | 9 (3.3%) | 2 (1.0%) |
| 65 to 74 Years | 2 (6.9%) | 0 (0.0%) |
| 75 Years and over | 11 (6.2%) | 5 (20.8%) |
Technology Access in Pisgah
Computing Device Access in Pisgah
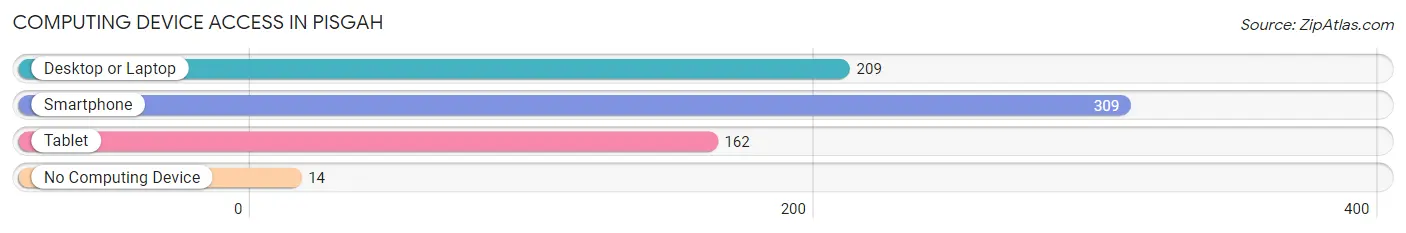
| Device Type | # Households | % Households |
| Desktop or Laptop | 209 | 60.4% |
| Smartphone | 309 | 89.3% |
| Tablet | 162 | 46.8% |
| No Computing Device | 14 | 4.1% |
| Total | 346 | 100.0% |
Internet Access in Pisgah
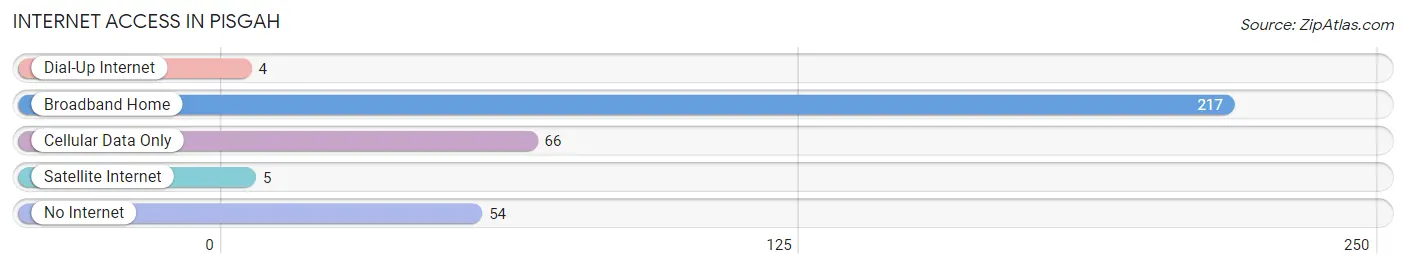
| Internet Type | # Households | % Households |
| Dial-Up Internet | 4 | 1.2% |
| Broadband Home | 217 | 62.7% |
| Cellular Data Only | 66 | 19.1% |
| Satellite Internet | 5 | 1.5% |
| No Internet | 54 | 15.6% |
| Total | 346 | 100.0% |
Pisgah Summary
Pisgah is a small town located in Jackson County, Alabama. It is situated in the foothills of the Appalachian Mountains, about 20 miles east of Scottsboro. The town was founded in 1820 and was named after the biblical Mount Pisgah. The population of Pisgah was 1,093 at the 2010 census.
History
Pisgah was founded in 1820 by settlers from North Carolina. The town was named after the biblical Mount Pisgah, which is mentioned in the book of Deuteronomy. The town was originally a farming community, but it soon became a center for the timber industry. The town was also home to several sawmills and gristmills.
In the late 19th century, the town began to grow and develop. The first school was built in 1887 and the first post office was established in 1888. The town was incorporated in 1895.
In the early 20th century, Pisgah was a thriving community. The town had several stores, a bank, a hotel, a movie theater, and a cotton gin. The town also had a railroad station, which connected it to the larger cities of Scottsboro and Huntsville.
In the 1950s, the timber industry began to decline and the town's population began to decline as well. The town's economy shifted to focus on agriculture and tourism.
Geography
Pisgah is located in Jackson County, Alabama. It is situated in the foothills of the Appalachian Mountains, about 20 miles east of Scottsboro. The town is located at the intersection of Alabama State Route 79 and Alabama State Route 65.
The town is surrounded by rolling hills and forests. The town is located near the Paint Rock River, which is a popular spot for fishing and canoeing.
Economy
The economy of Pisgah is largely based on agriculture and tourism. The town is home to several farms, which produce a variety of crops, including corn, soybeans, and hay. The town is also home to several tourist attractions, including the Pisgah National Forest, the Paint Rock River, and the nearby town of Scottsboro.
The town is also home to several small businesses including restaurants stores and a gas station
Demographics
As of the 2010 census, the population of Pisgah was 1,093. The racial makeup of the town was 97.2% White, 0.7% African American, 0.2% Native American, 0.2% Asian, 0.1% from other races, and 1.7% from two or more races. Hispanic or Latino of any race were 0.9% of the population.
The median income for a household in the town was $30,000, and the median income for a family was $35,000. The per capita income for the town was $15,000. About 17.2% of families and 19.2% of the population were below the poverty line, including 25.2% of those under age 18 and 11.2% of those age 65 or over.
Common Questions
What is Per Capita Income in Pisgah?
Per Capita income in Pisgah is $31,147.
What is the Median Family Income in Pisgah?
Median Family Income in Pisgah is $67,344.
What is the Median Household income in Pisgah?
Median Household Income in Pisgah is $51,667.
What is Income or Wage Gap in Pisgah?
Income or Wage Gap in Pisgah is 57.4%.
Women in Pisgah earn 42.6 cents for every dollar earned by a man.
What is Family Income Deficit in Pisgah?
Family Income Deficit in Pisgah is $12,672.
Families that are below poverty line in Pisgah earn $12,672 less on average than the poverty threshold level.
What is Inequality or Gini Index in Pisgah?
Inequality or Gini Index in Pisgah is 0.46.
What is the Total Population of Pisgah?
Total Population of Pisgah is 1,053.
What is the Total Male Population of Pisgah?
Total Male Population of Pisgah is 618.
What is the Total Female Population of Pisgah?
Total Female Population of Pisgah is 435.
What is the Ratio of Males per 100 Females in Pisgah?
There are 142.07 Males per 100 Females in Pisgah.
What is the Ratio of Females per 100 Males in Pisgah?
There are 70.39 Females per 100 Males in Pisgah.
What is the Median Population Age in Pisgah?
Median Population Age in Pisgah is 57.0 Years.
What is the Average Family Size in Pisgah
Average Family Size in Pisgah is 3.9 People.
What is the Average Household Size in Pisgah
Average Household Size in Pisgah is 3.0 People.
How Large is the Labor Force in Pisgah?
There are 414 People in the Labor Forcein in Pisgah.
What is the Percentage of People in the Labor Force in Pisgah?
44.7% of People are in the Labor Force in Pisgah.
What is the Unemployment Rate in Pisgah?
Unemployment Rate in Pisgah is 5.3%.