Zip Codes with the Highest Percentage of Black / African American Population in Pell City, AL
RELATED REPORTS & OPTIONS
Black / African American
Pell City
Compare Zip Codes
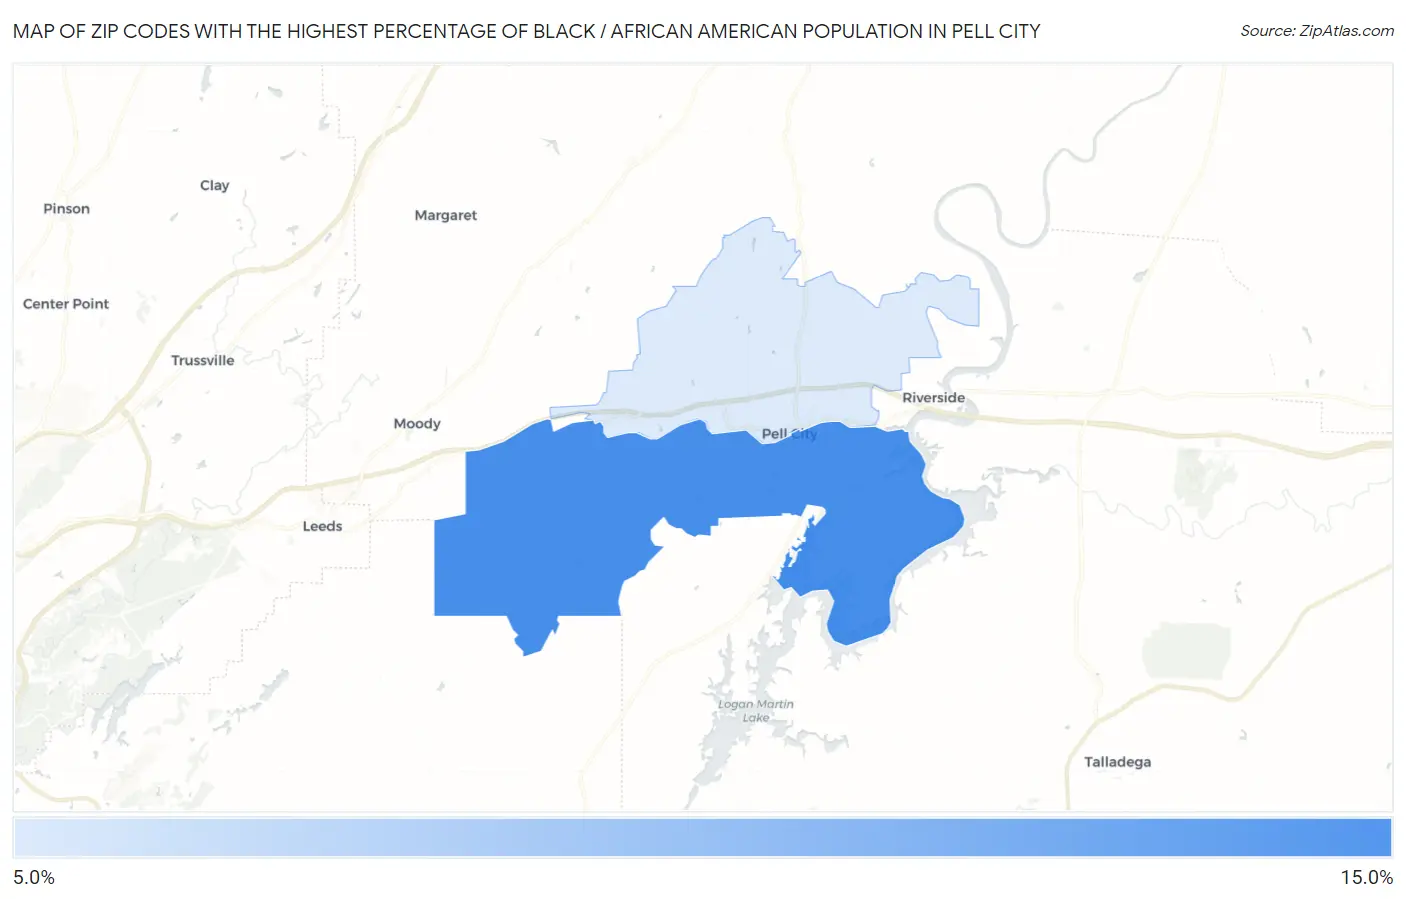
Map of Zip Codes with the Highest Percentage of Black / African American Population in Pell City
9.9%
12.6%
Zip Codes with the Highest Percentage of Black / African American Population in Pell City, AL
| Zip Code | Black / African American | vs State | vs National | |
| 1. | 35128 | 12.6% | 26.4%(-13.8)#358 | 12.5%(+0.117)#5,667 |
| 2. | 35125 | 9.9% | 26.4%(-16.5)#387 | 12.5%(-2.56)#6,652 |
1
Common Questions
What are the Top Zip Codes with the Highest Percentage of Black / African American Population in Pell City, AL?
Top Zip Codes with the Highest Percentage of Black / African American Population in Pell City, AL are:
What zip code has the Highest Percentage of Black / African American Population in Pell City, AL?
35128 has the Highest Percentage of Black / African American Population in Pell City, AL with 12.6%.
What is the Percentage of Black / African American Population in Pell City, AL?
Percentage of Black / African American Population in Pell City is 17.2%.
What is the Percentage of Black / African American Population in Alabama?
Percentage of Black / African American Population in Alabama is 26.4%.
What is the Percentage of Black / African American Population in the United States?
Percentage of Black / African American Population in the United States is 12.5%.