Zip Codes with the Highest Percentage of Self-Employed / Incorporated in Mobile, AL
RELATED REPORTS & OPTIONS
Self-Employed / Incorporated
Mobile
Compare Zip Codes
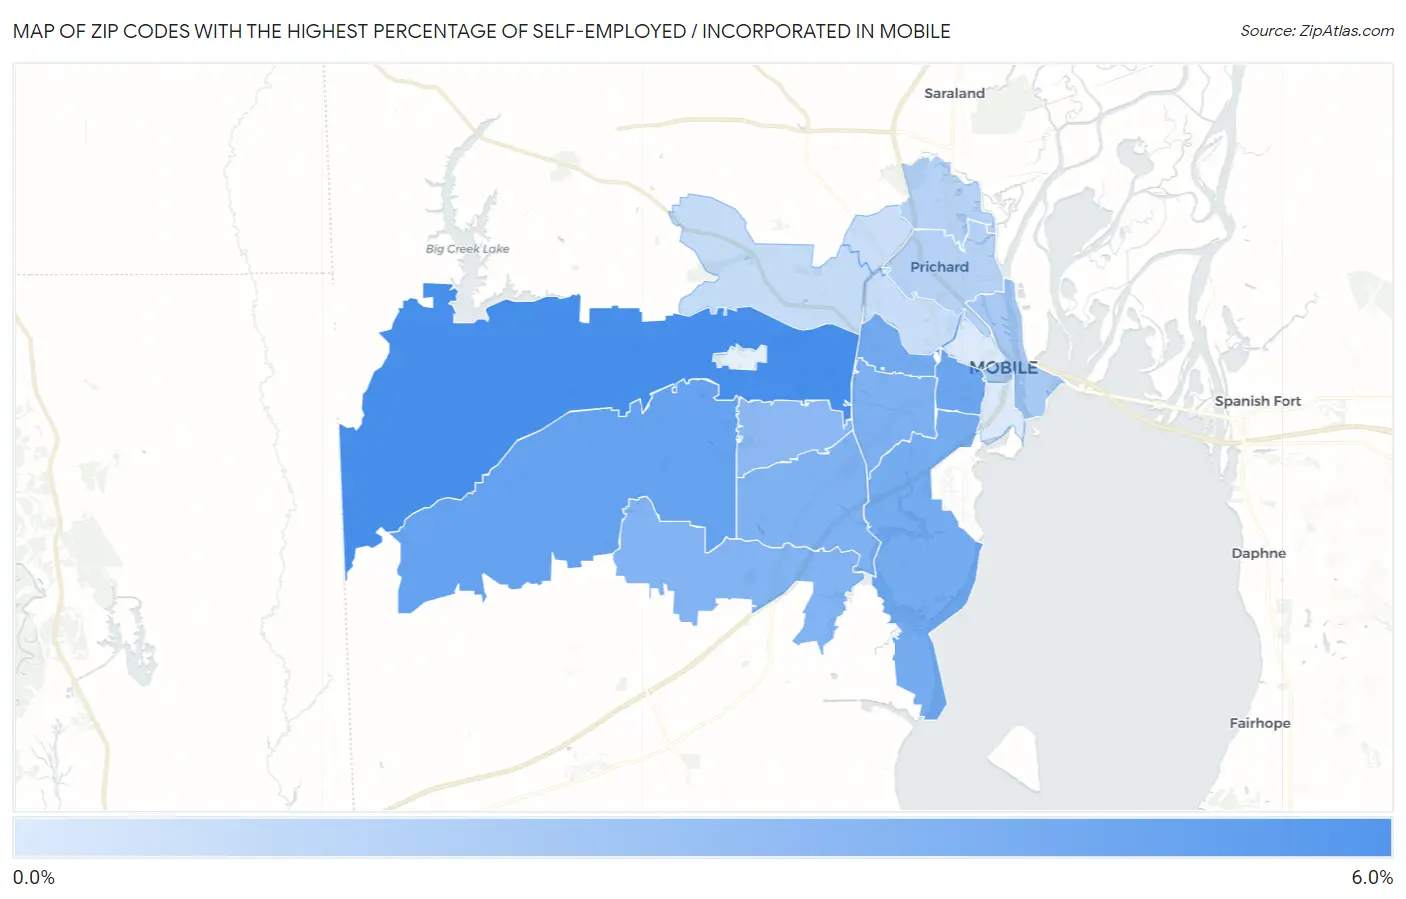
Map of Zip Codes with the Highest Percentage of Self-Employed / Incorporated in Mobile
0.67%
5.2%
Zip Codes with the Highest Percentage of Self-Employed / Incorporated in Mobile, AL
| Zip Code | % Self-Employed / Incorporated | vs State | vs National | |
| 1. | 36608 | 5.2% | 3.5%(+1.66)#109 | 3.8%(+1.34)#8,172 |
| 2. | 36695 | 4.2% | 3.5%(+0.724)#153 | 3.8%(+0.412)#11,085 |
| 3. | 36604 | 4.0% | 3.5%(+0.536)#169 | 3.8%(+0.223)#11,763 |
| 4. | 36607 | 3.8% | 3.5%(+0.329)#190 | 3.8%(+0.016)#12,623 |
| 5. | 36605 | 3.8% | 3.5%(+0.262)#201 | 3.8%(-0.051)#12,897 |
| 6. | 36606 | 3.5% | 3.5%(+0.041)#216 | 3.8%(-0.272)#13,829 |
| 7. | 36693 | 3.5% | 3.5%(+0.007)#217 | 3.8%(-0.305)#13,973 |
| 8. | 36619 | 3.4% | 3.5%(-0.128)#225 | 3.8%(-0.440)#14,608 |
| 9. | 36609 | 3.1% | 3.5%(-0.432)#249 | 3.8%(-0.745)#16,020 |
| 10. | 36602 | 2.3% | 3.5%(-1.25)#343 | 3.8%(-1.56)#20,080 |
| 11. | 36611 | 1.9% | 3.5%(-1.65)#389 | 3.8%(-1.96)#22,042 |
| 12. | 36610 | 1.8% | 3.5%(-1.70)#394 | 3.8%(-2.01)#22,240 |
| 13. | 36618 | 1.4% | 3.5%(-2.15)#439 | 3.8%(-2.46)#24,033 |
| 14. | 36617 | 1.3% | 3.5%(-2.20)#444 | 3.8%(-2.52)#24,251 |
| 15. | 36612 | 1.2% | 3.5%(-2.32)#453 | 3.8%(-2.63)#24,700 |
| 16. | 36603 | 0.67% | 3.5%(-2.84)#490 | 3.8%(-3.15)#26,150 |
1
Common Questions
What are the Top 10 Zip Codes with the Highest Percentage of Self-Employed / Incorporated in Mobile, AL?
Top 10 Zip Codes with the Highest Percentage of Self-Employed / Incorporated in Mobile, AL are:
What zip code has the Highest Percentage of Self-Employed / Incorporated in Mobile, AL?
36608 has the Highest Percentage of Self-Employed / Incorporated in Mobile, AL with 5.2%.
What is the Percentage of Self-Employed / Incorporated in Mobile, AL?
Percentage of Self-Employed / Incorporated in Mobile is 3.6%.
What is the Percentage of Self-Employed / Incorporated in Alabama?
Percentage of Self-Employed / Incorporated in Alabama is 3.5%.
What is the Percentage of Self-Employed / Incorporated in the United States?
Percentage of Self-Employed / Incorporated in the United States is 3.8%.