Zip Codes with the Highest Percentage of Population Employed in Professional & Scientific Services in Mobile, AL
RELATED REPORTS & OPTIONS
Professional & Scientific Services
Mobile
Compare Zip Codes
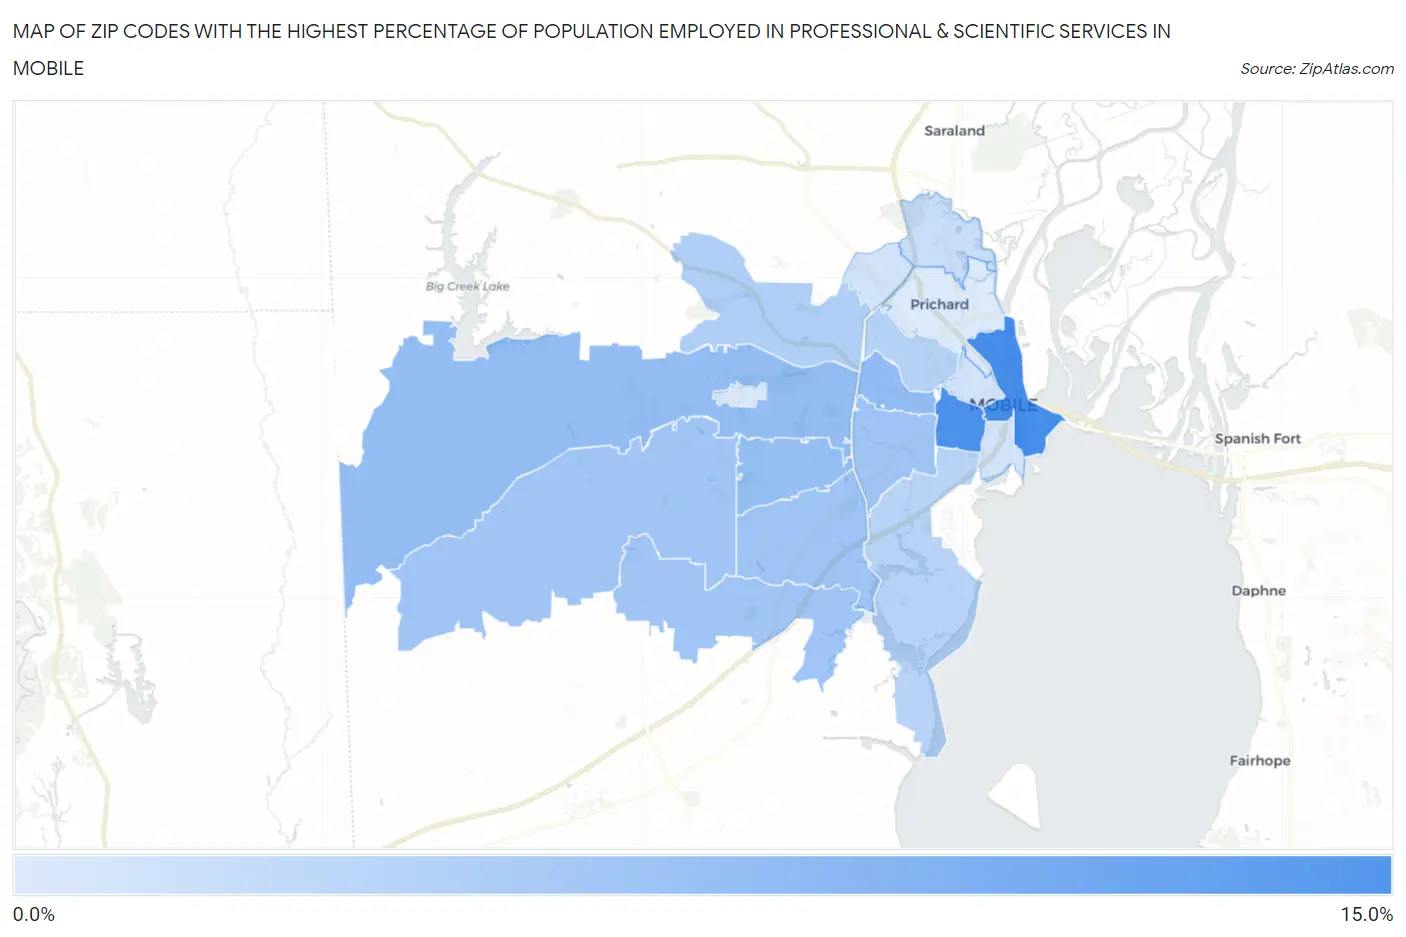
Map of Zip Codes with the Highest Percentage of Population Employed in Professional & Scientific Services in Mobile
0.33%
13.4%
Zip Codes with the Highest Percentage of Population Employed in Professional & Scientific Services in Mobile, AL
| Zip Code | % Employed | vs State | vs National | |
| 1. | 36602 | 13.4% | 5.8%(+7.57)#29 | 7.8%(+5.54)#2,544 |
| 2. | 36604 | 12.9% | 5.8%(+7.12)#35 | 7.8%(+5.09)#2,739 |
| 3. | 36607 | 6.7% | 5.8%(+0.841)#114 | 7.8%(-1.19)#8,741 |
| 4. | 36608 | 6.5% | 5.8%(+0.670)#122 | 7.8%(-1.36)#9,063 |
| 5. | 36609 | 6.4% | 5.8%(+0.627)#125 | 7.8%(-1.40)#9,132 |
| 6. | 36693 | 5.6% | 5.8%(-0.216)#151 | 7.8%(-2.25)#10,845 |
| 7. | 36606 | 5.5% | 5.8%(-0.291)#154 | 7.8%(-2.32)#11,027 |
| 8. | 36619 | 5.4% | 5.8%(-0.379)#161 | 7.8%(-2.41)#11,220 |
| 9. | 36695 | 5.3% | 5.8%(-0.551)#171 | 7.8%(-2.58)#11,643 |
| 10. | 36618 | 4.0% | 5.8%(-1.82)#230 | 7.8%(-3.85)#15,106 |
| 11. | 36617 | 3.6% | 5.8%(-2.20)#252 | 7.8%(-4.23)#16,339 |
| 12. | 36605 | 3.4% | 5.8%(-2.45)#268 | 7.8%(-4.48)#17,155 |
| 13. | 36611 | 2.1% | 5.8%(-3.73)#371 | 7.8%(-5.76)#21,595 |
| 14. | 36603 | 1.3% | 5.8%(-4.55)#438 | 7.8%(-6.58)#24,282 |
| 15. | 36612 | 1.3% | 5.8%(-4.56)#441 | 7.8%(-6.59)#24,331 |
| 16. | 36688 | 0.50% | 5.8%(-5.32)#490 | 7.8%(-7.35)#26,223 |
| 17. | 36610 | 0.33% | 5.8%(-5.49)#503 | 7.8%(-7.52)#26,540 |
1
Common Questions
What are the Top 10 Zip Codes with the Highest Percentage of Population Employed in Professional & Scientific Services in Mobile, AL?
Top 10 Zip Codes with the Highest Percentage of Population Employed in Professional & Scientific Services in Mobile, AL are:
What zip code has the Highest Percentage of Population Employed in Professional & Scientific Services in Mobile, AL?
36602 has the Highest Percentage of Population Employed in Professional & Scientific Services in Mobile, AL with 13.4%.
What is the Percentage of Population Employed in Professional & Scientific Services in Mobile, AL?
Percentage of Population Employed in Professional & Scientific Services in Mobile is 5.7%.
What is the Percentage of Population Employed in Professional & Scientific Services in Alabama?
Percentage of Population Employed in Professional & Scientific Services in Alabama is 5.8%.
What is the Percentage of Population Employed in Professional & Scientific Services in the United States?
Percentage of Population Employed in Professional & Scientific Services in the United States is 7.8%.