Midland City, AL Map & Demographics
Midland City Map
Midland City Overview
$22,235
PER CAPITA INCOME
$45,972
AVG FAMILY INCOME
$35,682
AVG HOUSEHOLD INCOME
43.2%
WAGE / INCOME GAP [ % ]
56.8¢/ $1
WAGE / INCOME GAP [ $ ]
0.42
INEQUALITY / GINI INDEX
1,823
TOTAL POPULATION
841
MALE POPULATION
982
FEMALE POPULATION
85.64
MALES / 100 FEMALES
116.77
FEMALES / 100 MALES
32.7
MEDIAN AGE
3.5
AVG FAMILY SIZE
2.2
AVG HOUSEHOLD SIZE
898
LABOR FORCE [ PEOPLE ]
60.4%
PERCENT IN LABOR FORCE
1.8%
UNEMPLOYMENT RATE
Midland City Zip Codes
Midland City Area Codes
Income in Midland City
Income Overview in Midland City
Per Capita Income in Midland City is $22,235, while median incomes of families and households are $45,972 and $35,682 respectively.
| Characteristic | Number | Measure |
| Per Capita Income | 1,823 | $22,235 |
| Median Family Income | 378 | $45,972 |
| Mean Family Income | 378 | $60,115 |
| Median Household Income | 840 | $35,682 |
| Mean Household Income | 840 | $44,622 |
| Income Deficit | 378 | $0 |
| Wage / Income Gap (%) | 1,823 | 43.18% |
| Wage / Income Gap ($) | 1,823 | 56.82¢ per $1 |
| Gini / Inequality Index | 1,823 | 0.42 |
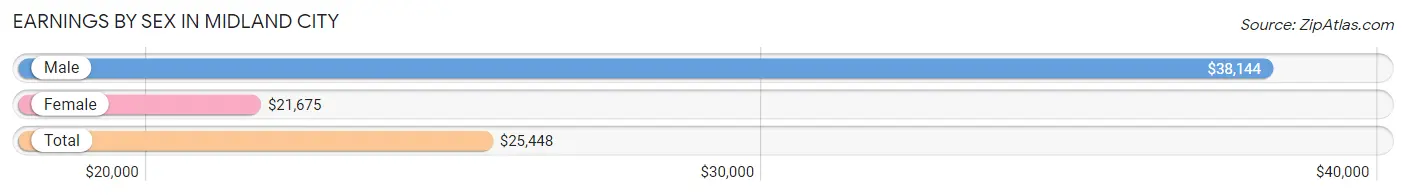
Earnings by Sex in Midland City
Average Earnings in Midland City are $25,448, $38,144 for men and $21,675 for women, a difference of 43.2%.
| Sex | Number | Average Earnings |
| Male | 423 (45.4%) | $38,144 |
| Female | 509 (54.6%) | $21,675 |
| Total | 932 (100.0%) | $25,448 |
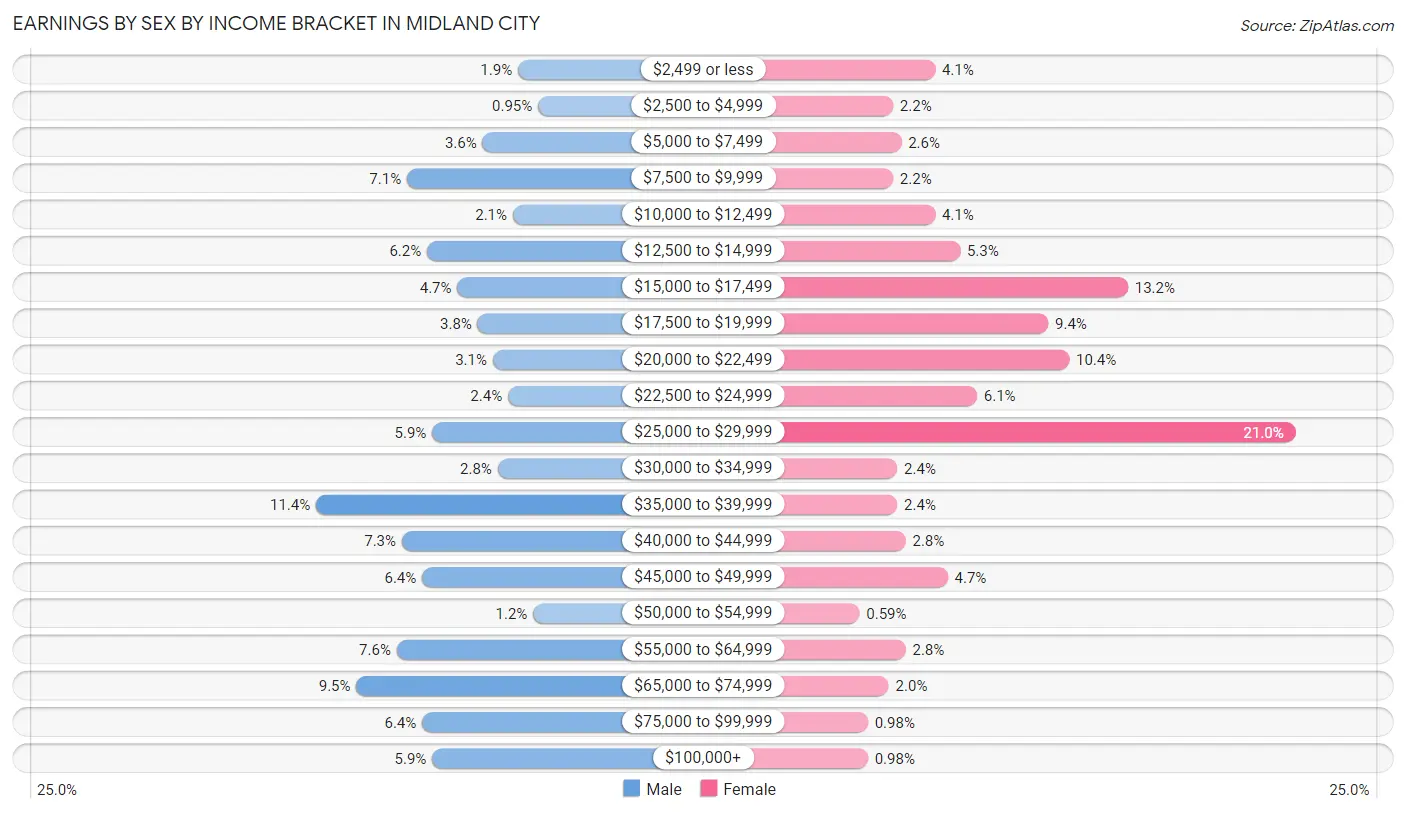
Earnings by Sex by Income Bracket in Midland City
The most common earnings brackets in Midland City are $35,000 to $39,999 for men (48 | 11.4%) and $25,000 to $29,999 for women (107 | 21.0%).
| Income | Male | Female |
| $2,499 or less | 8 (1.9%) | 21 (4.1%) |
| $2,500 to $4,999 | 4 (0.9%) | 11 (2.2%) |
| $5,000 to $7,499 | 15 (3.5%) | 13 (2.5%) |
| $7,500 to $9,999 | 30 (7.1%) | 11 (2.2%) |
| $10,000 to $12,499 | 9 (2.1%) | 21 (4.1%) |
| $12,500 to $14,999 | 26 (6.1%) | 27 (5.3%) |
| $15,000 to $17,499 | 20 (4.7%) | 67 (13.2%) |
| $17,500 to $19,999 | 16 (3.8%) | 48 (9.4%) |
| $20,000 to $22,499 | 13 (3.1%) | 53 (10.4%) |
| $22,500 to $24,999 | 10 (2.4%) | 31 (6.1%) |
| $25,000 to $29,999 | 25 (5.9%) | 107 (21.0%) |
| $30,000 to $34,999 | 12 (2.8%) | 12 (2.4%) |
| $35,000 to $39,999 | 48 (11.4%) | 12 (2.4%) |
| $40,000 to $44,999 | 31 (7.3%) | 14 (2.8%) |
| $45,000 to $49,999 | 27 (6.4%) | 24 (4.7%) |
| $50,000 to $54,999 | 5 (1.2%) | 3 (0.6%) |
| $55,000 to $64,999 | 32 (7.6%) | 14 (2.8%) |
| $65,000 to $74,999 | 40 (9.5%) | 10 (2.0%) |
| $75,000 to $99,999 | 27 (6.4%) | 5 (1.0%) |
| $100,000+ | 25 (5.9%) | 5 (1.0%) |
| Total | 423 (100.0%) | 509 (100.0%) |
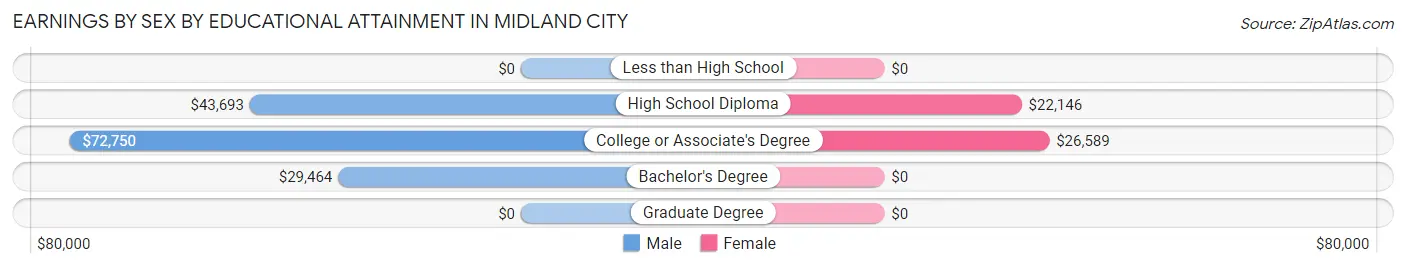
Earnings by Sex by Educational Attainment in Midland City
Average earnings in Midland City are $40,972 for men and $24,234 for women, a difference of 40.8%. Men with an educational attainment of college or associate's degree enjoy the highest average annual earnings of $72,750, while those with bachelor's degree education earn the least with $29,464. Women with an educational attainment of college or associate's degree earn the most with the average annual earnings of $26,589, while those with high school diploma education have the smallest earnings of $22,146.
| Educational Attainment | Male Income | Female Income |
| Less than High School | - | - |
| High School Diploma | $43,693 | $22,146 |
| College or Associate's Degree | $72,750 | $26,589 |
| Bachelor's Degree | $29,464 | $0 |
| Graduate Degree | - | - |
| Total | $40,972 | $24,234 |
Family Income in Midland City
Family Income Brackets in Midland City
According to the Midland City family income data, there are 100 families falling into the $35,000 to $49,999 income range, which is the most common income bracket and makes up 26.5% of all families. Conversely, the $150,000 to $199,999 income bracket is the least frequent group with only 7 families (1.8%) belonging to this category.
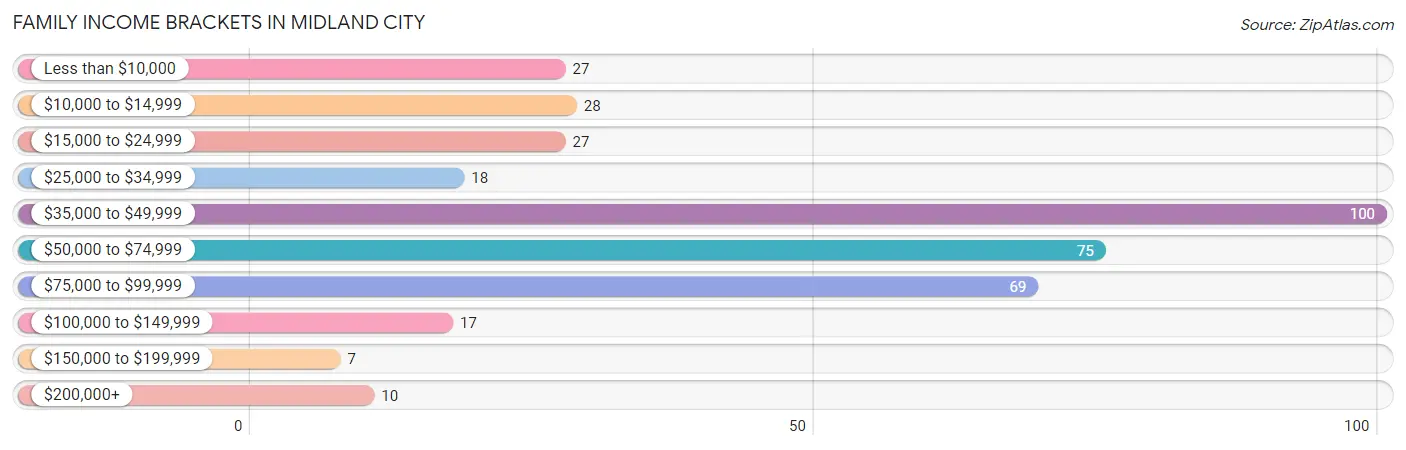
| Income Bracket | # Families | % Families |
| Less than $10,000 | 27 | 7.1% |
| $10,000 to $14,999 | 28 | 7.4% |
| $15,000 to $24,999 | 27 | 7.1% |
| $25,000 to $34,999 | 18 | 4.8% |
| $35,000 to $49,999 | 100 | 26.5% |
| $50,000 to $74,999 | 75 | 19.8% |
| $75,000 to $99,999 | 69 | 18.3% |
| $100,000 to $149,999 | 17 | 4.5% |
| $150,000 to $199,999 | 7 | 1.9% |
| $200,000+ | 10 | 2.6% |
Family Income by Famaliy Size in Midland City
6-person families (27 | 7.1%) account for the highest median family income in Midland City with $95,391 per family, while 4-person families (72 | 19.1%) have the highest median income of $21,392 per family member.
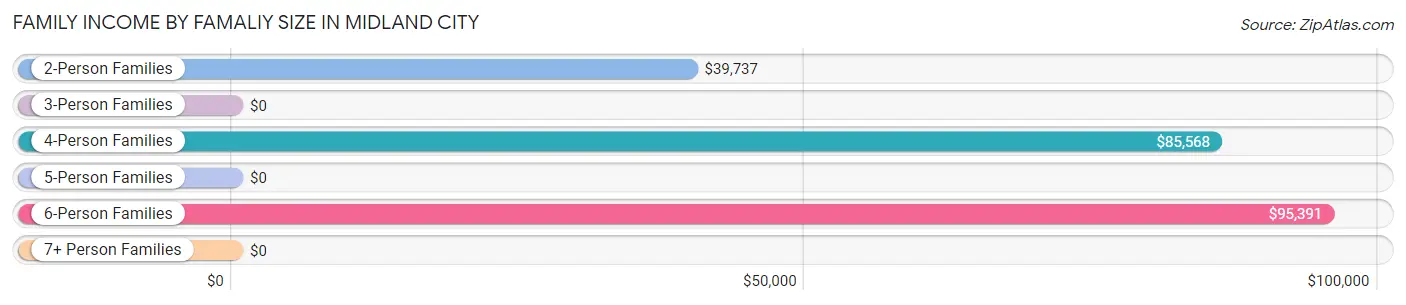
| Income Bracket | # Families | Median Income |
| 2-Person Families | 200 (52.9%) | $39,737 |
| 3-Person Families | 62 (16.4%) | $0 |
| 4-Person Families | 72 (19.1%) | $85,568 |
| 5-Person Families | 17 (4.5%) | $0 |
| 6-Person Families | 27 (7.1%) | $95,391 |
| 7+ Person Families | 0 (0.0%) | $0 |
| Total | 378 (100.0%) | $45,972 |
Family Income by Number of Earners in Midland City
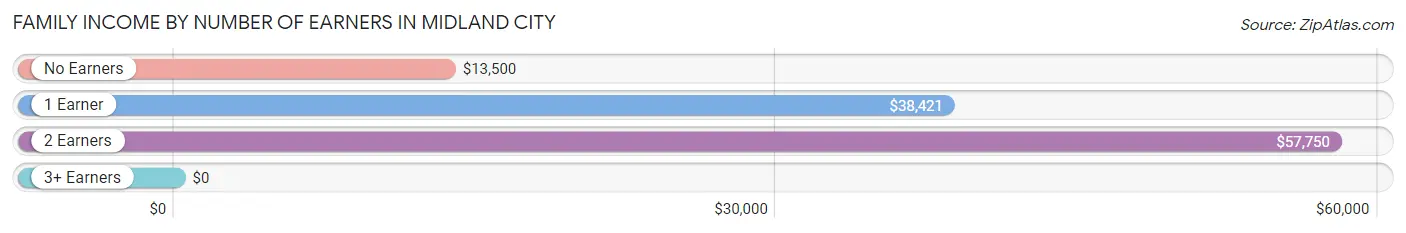
| Number of Earners | # Families | Median Income |
| No Earners | 46 (12.2%) | $13,500 |
| 1 Earner | 148 (39.2%) | $38,421 |
| 2 Earners | 170 (45.0%) | $57,750 |
| 3+ Earners | 14 (3.7%) | $0 |
| Total | 378 (100.0%) | $45,972 |
Household Income in Midland City
Household Income Brackets in Midland City
With 209 households falling in the category, the $15,000 to $24,999 income range is the most frequent in Midland City, accounting for 24.9% of all households. In contrast, only 7 households (0.8%) fall into the $150,000 to $199,999 income bracket, making it the least populous group.
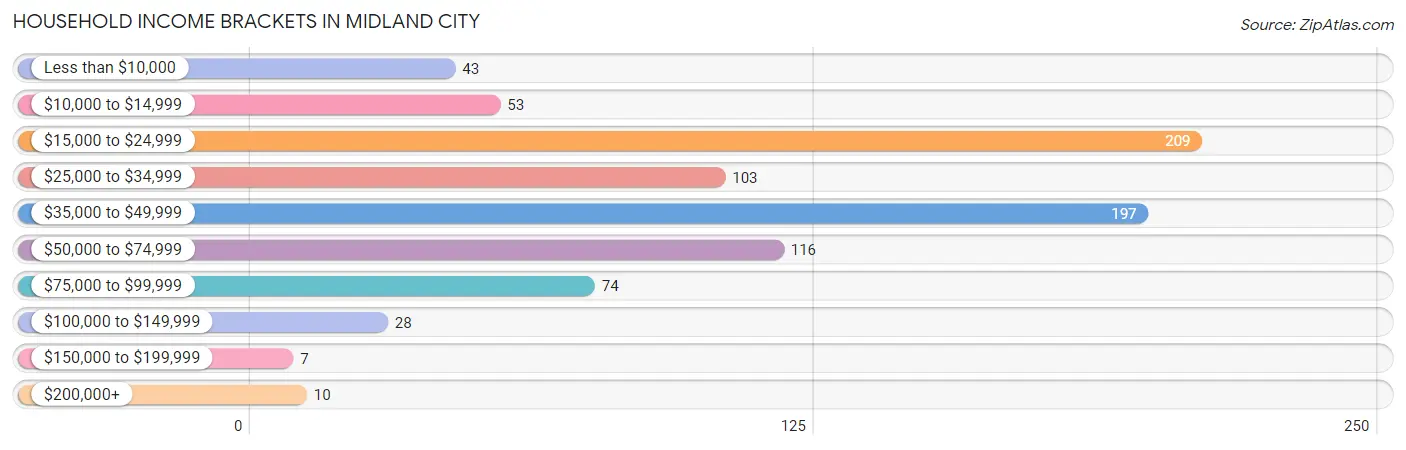
| Income Bracket | # Households | % Households |
| Less than $10,000 | 43 | 5.1% |
| $10,000 to $14,999 | 53 | 6.3% |
| $15,000 to $24,999 | 209 | 24.9% |
| $25,000 to $34,999 | 103 | 12.3% |
| $35,000 to $49,999 | 197 | 23.5% |
| $50,000 to $74,999 | 116 | 13.8% |
| $75,000 to $99,999 | 74 | 8.8% |
| $100,000 to $149,999 | 28 | 3.3% |
| $150,000 to $199,999 | 7 | 0.8% |
| $200,000+ | 10 | 1.2% |
Household Income by Householder Age in Midland City
The median household income in Midland City is $35,682, with the highest median household income of $39,621 found in the 25 to 44 years age bracket for the primary householder. A total of 270 households (32.1%) fall into this category. Meanwhile, the 15 to 24 years age bracket for the primary householder has the lowest median household income of $0, with 22 households (2.6%) in this group.
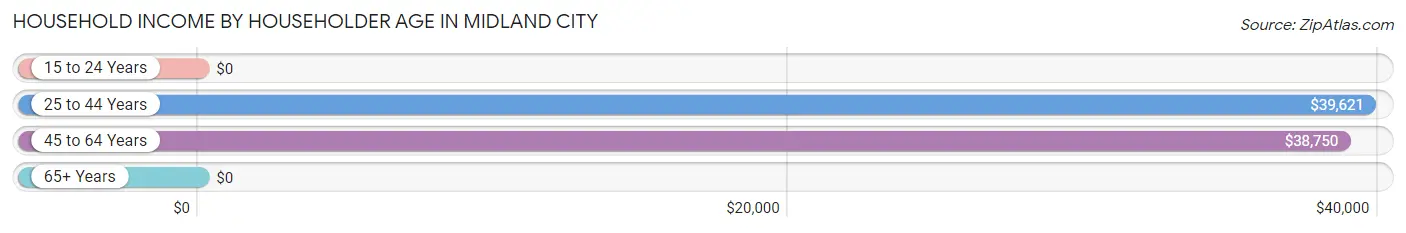
| Income Bracket | # Households | Median Income |
| 15 to 24 Years | 22 (2.6%) | $0 |
| 25 to 44 Years | 270 (32.1%) | $39,621 |
| 45 to 64 Years | 268 (31.9%) | $38,750 |
| 65+ Years | 280 (33.3%) | $0 |
| Total | 840 (100.0%) | $35,682 |
Poverty in Midland City
Income Below Poverty by Sex and Age in Midland City
With 17.8% poverty level for males and 20.8% for females among the residents of Midland City, 5 year old males and under 5 year old females are the most vulnerable to poverty, with 4 males (100.0%) and 28 females (57.1%) in their respective age groups living below the poverty level.
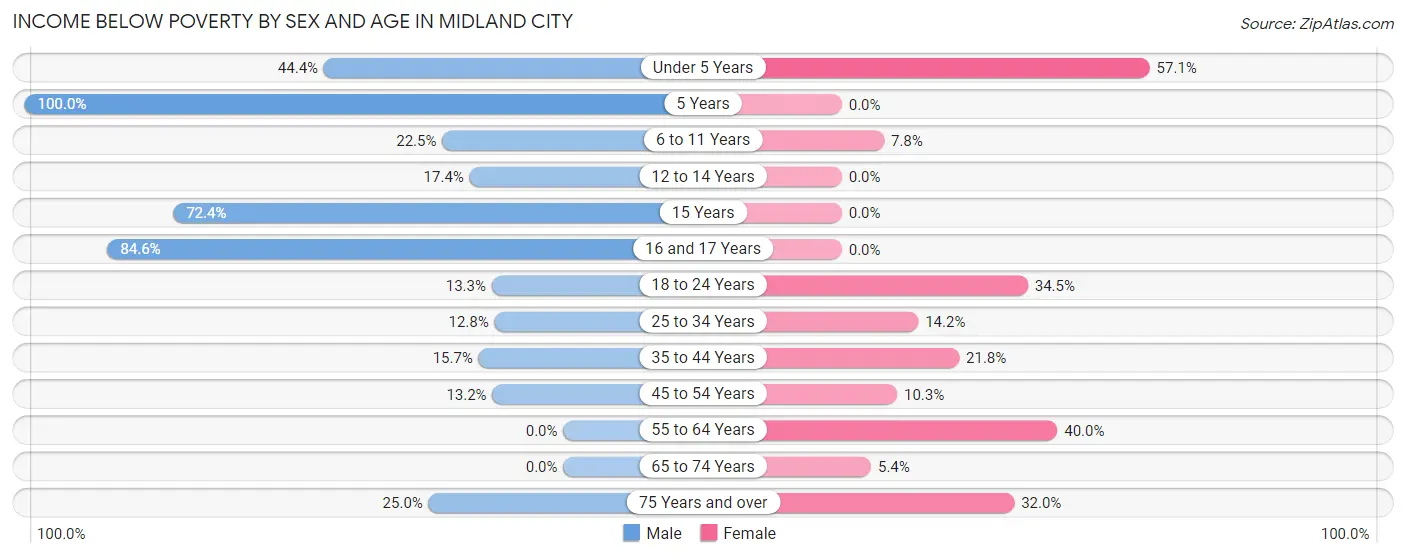
| Age Bracket | Male | Female |
| Under 5 Years | 16 (44.4%) | 28 (57.1%) |
| 5 Years | 4 (100.0%) | 0 (0.0%) |
| 6 to 11 Years | 20 (22.5%) | 4 (7.8%) |
| 12 to 14 Years | 4 (17.4%) | 0 (0.0%) |
| 15 Years | 21 (72.4%) | 0 (0.0%) |
| 16 and 17 Years | 11 (84.6%) | 0 (0.0%) |
| 18 to 24 Years | 17 (13.3%) | 29 (34.5%) |
| 25 to 34 Years | 30 (12.8%) | 21 (14.2%) |
| 35 to 44 Years | 11 (15.7%) | 22 (21.8%) |
| 45 to 54 Years | 10 (13.2%) | 8 (10.3%) |
| 55 to 64 Years | 0 (0.0%) | 66 (40.0%) |
| 65 to 74 Years | 0 (0.0%) | 10 (5.4%) |
| 75 Years and over | 6 (25.0%) | 16 (32.0%) |
| Total | 150 (17.8%) | 204 (20.8%) |
Income Above Poverty by Sex and Age in Midland City
According to the poverty statistics in Midland City, males aged 55 to 64 years and females aged 5 years are the age groups that are most secure financially, with 100.0% of males and 100.0% of females in these age groups living above the poverty line.
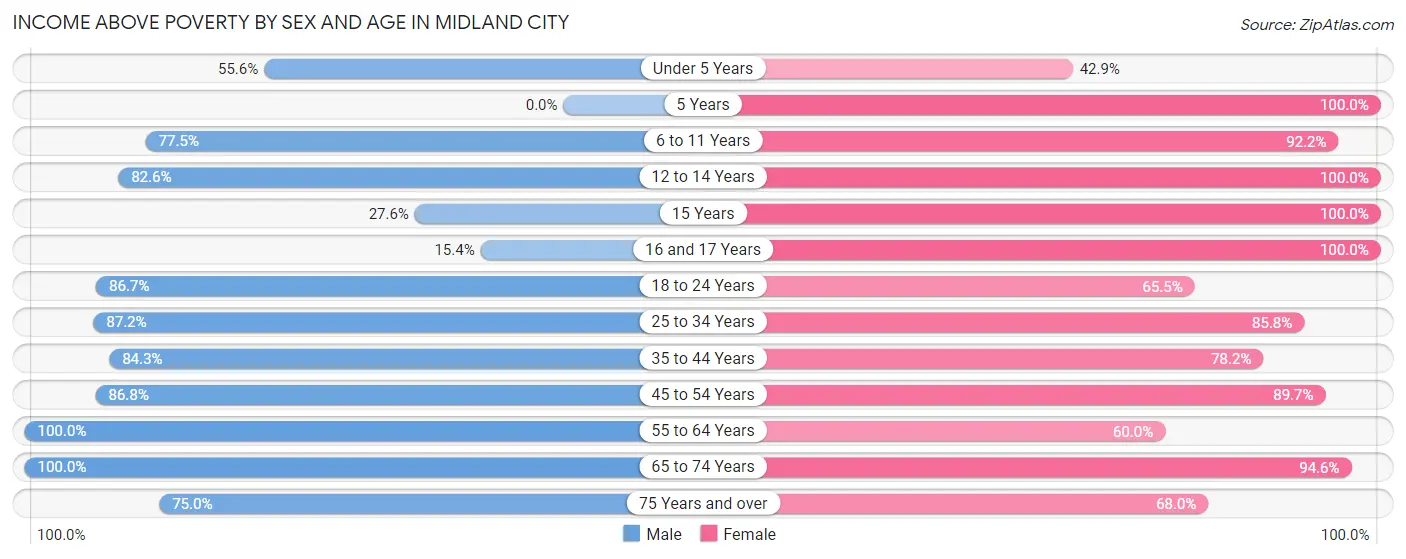
| Age Bracket | Male | Female |
| Under 5 Years | 20 (55.6%) | 21 (42.9%) |
| 5 Years | 0 (0.0%) | 9 (100.0%) |
| 6 to 11 Years | 69 (77.5%) | 47 (92.2%) |
| 12 to 14 Years | 19 (82.6%) | 35 (100.0%) |
| 15 Years | 8 (27.6%) | 11 (100.0%) |
| 16 and 17 Years | 2 (15.4%) | 17 (100.0%) |
| 18 to 24 Years | 111 (86.7%) | 55 (65.5%) |
| 25 to 34 Years | 205 (87.2%) | 127 (85.8%) |
| 35 to 44 Years | 59 (84.3%) | 79 (78.2%) |
| 45 to 54 Years | 66 (86.8%) | 70 (89.7%) |
| 55 to 64 Years | 70 (100.0%) | 99 (60.0%) |
| 65 to 74 Years | 44 (100.0%) | 174 (94.6%) |
| 75 Years and over | 18 (75.0%) | 34 (68.0%) |
| Total | 691 (82.2%) | 778 (79.2%) |
Income Below Poverty Among Married-Couple Families in Midland City
The poverty statistics for married-couple families in Midland City show that 3.3% or 6 of the total 183 families live below the poverty line. Families with no children have the highest poverty rate of 5.6%, comprising of 6 families. On the other hand, families with 1 or 2 children have the lowest poverty rate of 0.0%, which includes 0 families.
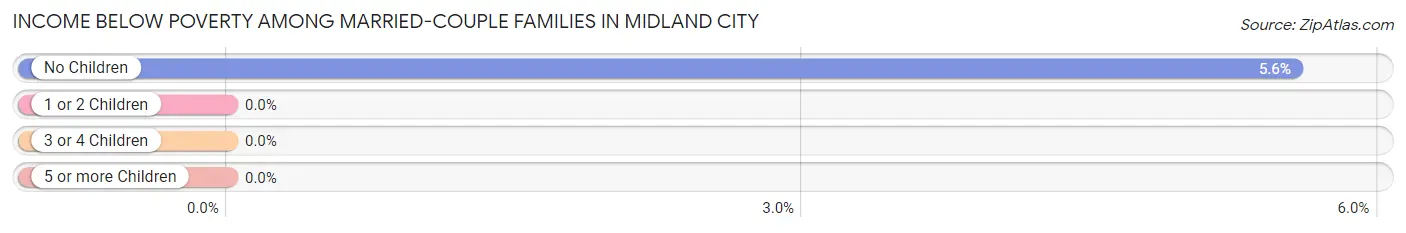
| Children | Above Poverty | Below Poverty |
| No Children | 102 (94.4%) | 6 (5.6%) |
| 1 or 2 Children | 59 (100.0%) | 0 (0.0%) |
| 3 or 4 Children | 16 (100.0%) | 0 (0.0%) |
| 5 or more Children | 0 (0.0%) | 0 (0.0%) |
| Total | 177 (96.7%) | 6 (3.3%) |
Income Below Poverty Among Single-Parent Households in Midland City
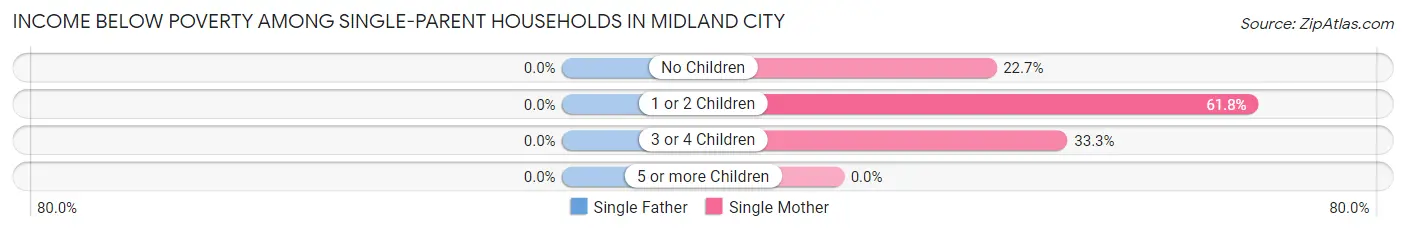
| Children | Single Father | Single Mother |
| No Children | 0 (0.0%) | 15 (22.7%) |
| 1 or 2 Children | 0 (0.0%) | 55 (61.8%) |
| 3 or 4 Children | 0 (0.0%) | 5 (33.3%) |
| 5 or more Children | 0 (0.0%) | 0 (0.0%) |
| Total | 0 (0.0%) | 75 (44.1%) |
Income Below Poverty Among Married-Couple vs Single-Parent Households in Midland City
The poverty data for Midland City shows that 6 of the married-couple family households (3.3%) and 75 of the single-parent households (38.5%) are living below the poverty level. Within the married-couple family households, those with no children have the highest poverty rate, with 6 households (5.6%) falling below the poverty line. Among the single-parent households, those with 1 or 2 children have the highest poverty rate, with 55 household (52.4%) living below poverty.
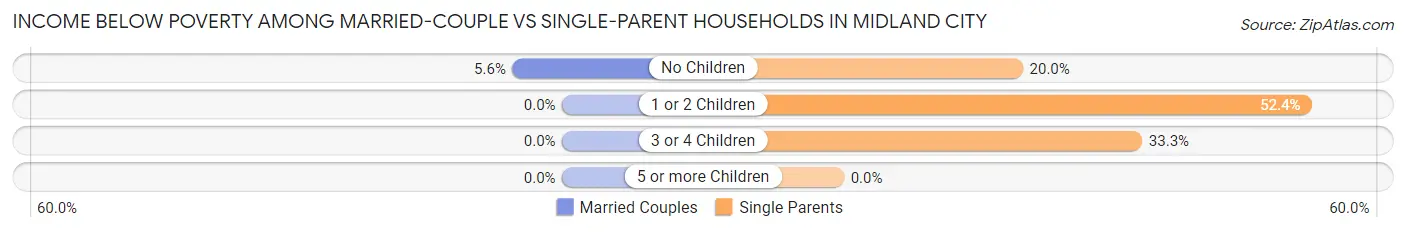
| Children | Married-Couple Families | Single-Parent Households |
| No Children | 6 (5.6%) | 15 (20.0%) |
| 1 or 2 Children | 0 (0.0%) | 55 (52.4%) |
| 3 or 4 Children | 0 (0.0%) | 5 (33.3%) |
| 5 or more Children | 0 (0.0%) | 0 (0.0%) |
| Total | 6 (3.3%) | 75 (38.5%) |
Race in Midland City
The most populous races in Midland City are White / Caucasian (1,103 | 60.5%), Black / African American (697 | 38.2%), and Hispanic or Latino (18 | 1.0%).
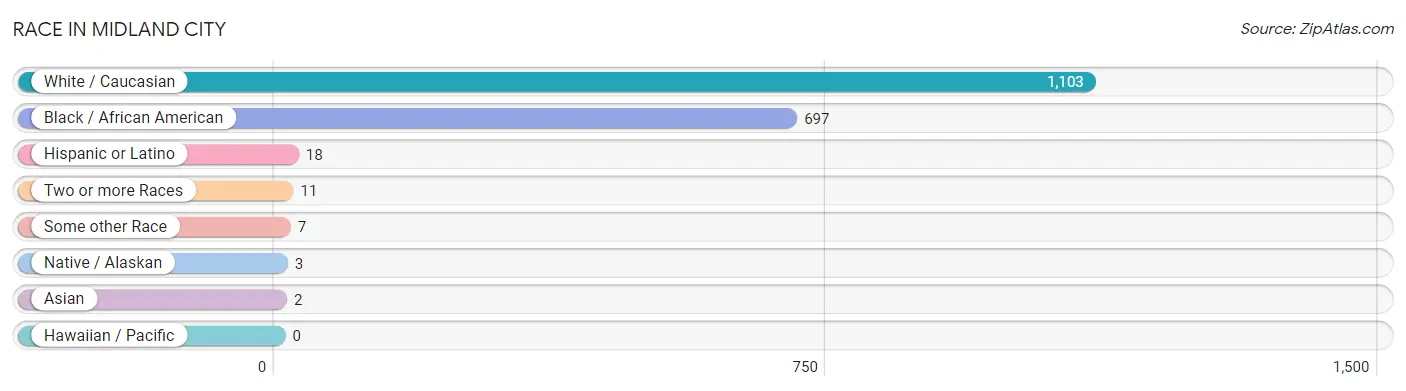
| Race | # Population | % Population |
| Asian | 2 | 0.1% |
| Black / African American | 697 | 38.2% |
| Hawaiian / Pacific | 0 | 0.0% |
| Hispanic or Latino | 18 | 1.0% |
| Native / Alaskan | 3 | 0.2% |
| White / Caucasian | 1,103 | 60.5% |
| Two or more Races | 11 | 0.6% |
| Some other Race | 7 | 0.4% |
| Total | 1,823 | 100.0% |
Ancestry in Midland City
The most populous ancestries reported in Midland City are American (422 | 23.2%), Irish (195 | 10.7%), German (167 | 9.2%), Scottish (94 | 5.2%), and English (81 | 4.4%), together accounting for 52.6% of all Midland City residents.
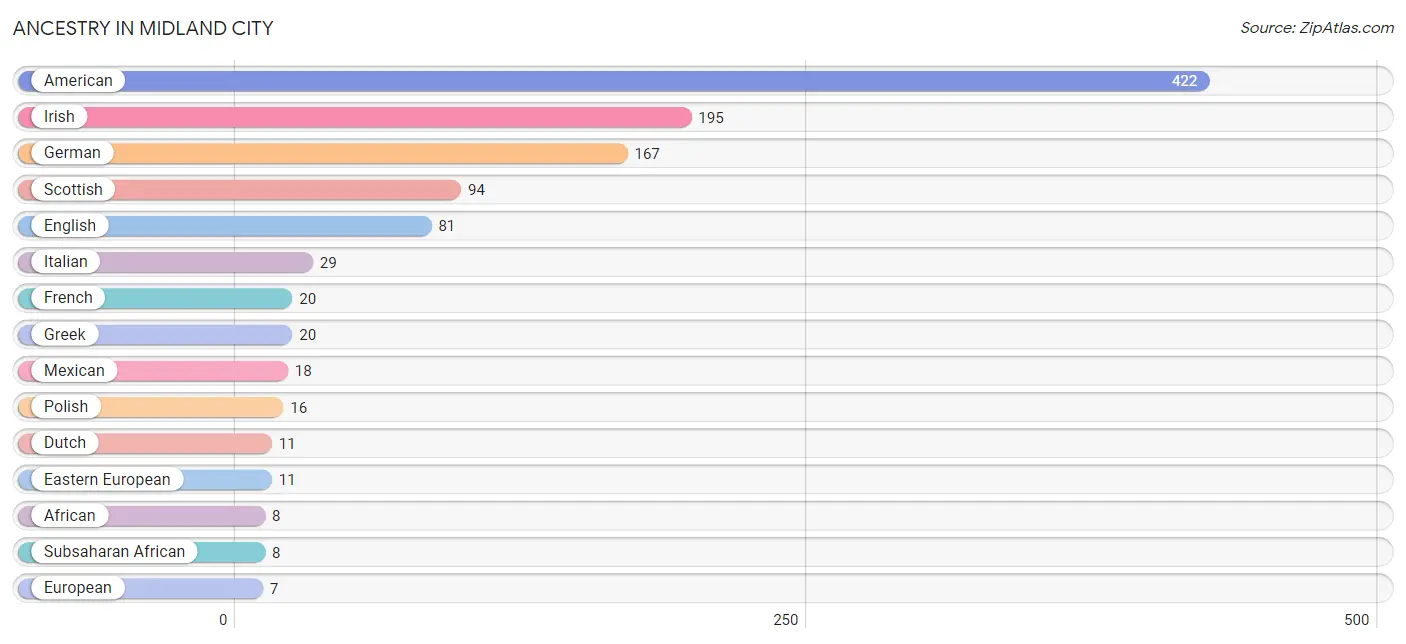
| Ancestry | # Population | % Population |
| African | 8 | 0.4% |
| American | 422 | 23.2% |
| Bhutanese | 2 | 0.1% |
| Creek | 3 | 0.2% |
| Dutch | 11 | 0.6% |
| Eastern European | 11 | 0.6% |
| English | 81 | 4.4% |
| European | 7 | 0.4% |
| French | 20 | 1.1% |
| French Canadian | 5 | 0.3% |
| German | 167 | 9.2% |
| Greek | 20 | 1.1% |
| Irish | 195 | 10.7% |
| Italian | 29 | 1.6% |
| Mexican | 18 | 1.0% |
| Polish | 16 | 0.9% |
| Scandinavian | 5 | 0.3% |
| Scotch-Irish | 7 | 0.4% |
| Scottish | 94 | 5.2% |
| Subsaharan African | 8 | 0.4% | View All 20 Rows |
Immigrants in Midland City
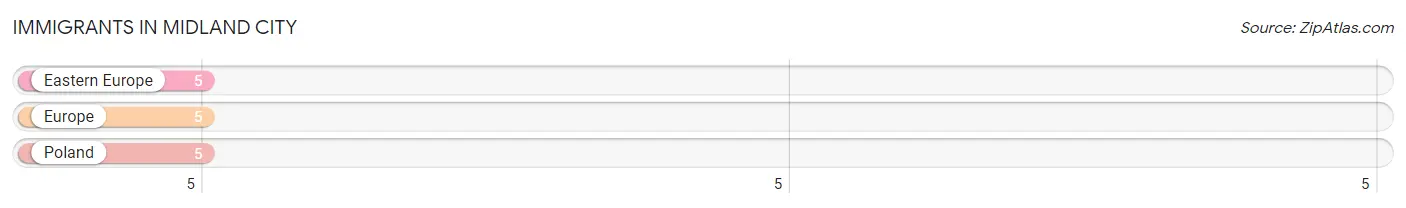
The most numerous immigrant groups reported in Midland City came from Eastern Europe (5 | 0.3%), Europe (5 | 0.3%), and Poland (5 | 0.3%), together accounting for 0.8% of all Midland City residents.
| Immigration Origin | # Population | % Population |
| Eastern Europe | 5 | 0.3% |
| Europe | 5 | 0.3% |
| Poland | 5 | 0.3% | View All 3 Rows |
Sex and Age in Midland City
Sex and Age in Midland City
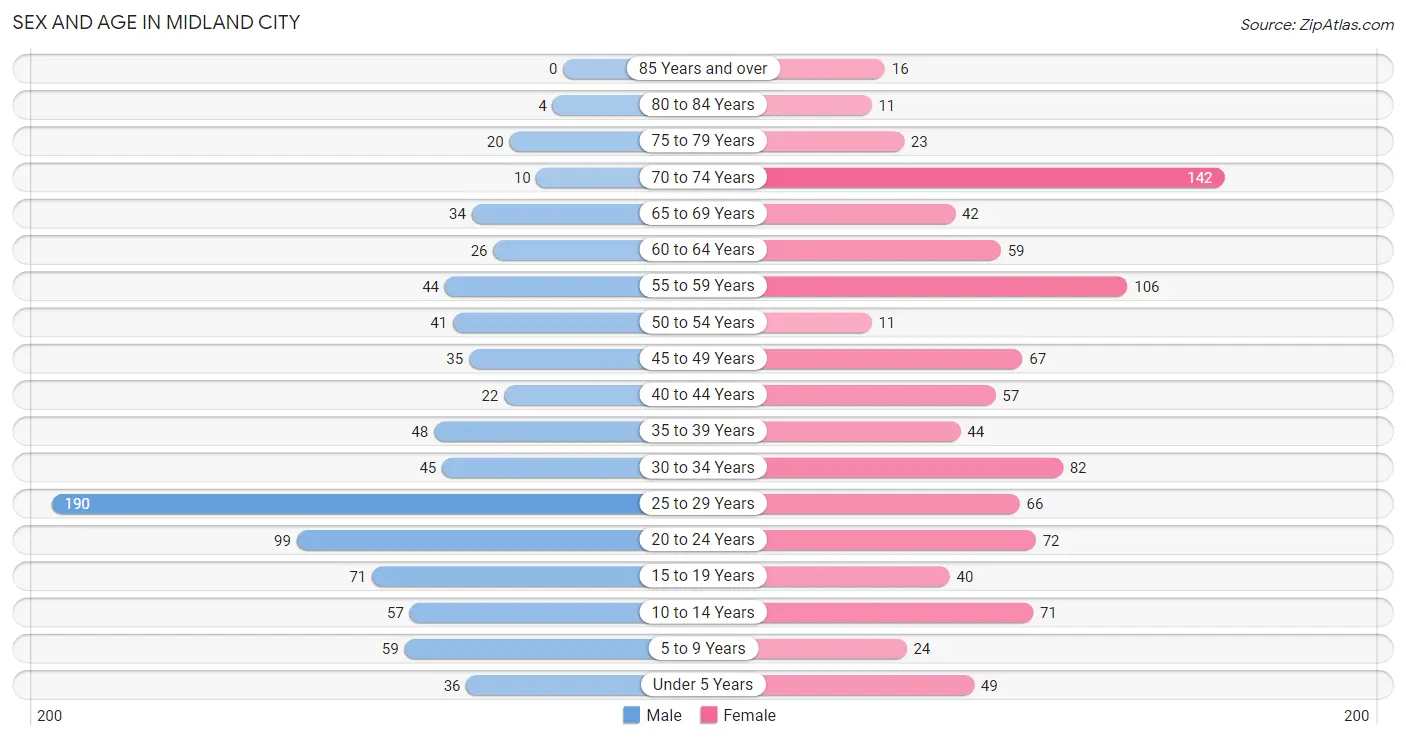
The most populous age groups in Midland City are 25 to 29 Years (190 | 22.6%) for men and 70 to 74 Years (142 | 14.5%) for women.
| Age Bracket | Male | Female |
| Under 5 Years | 36 (4.3%) | 49 (5.0%) |
| 5 to 9 Years | 59 (7.0%) | 24 (2.4%) |
| 10 to 14 Years | 57 (6.8%) | 71 (7.2%) |
| 15 to 19 Years | 71 (8.4%) | 40 (4.1%) |
| 20 to 24 Years | 99 (11.8%) | 72 (7.3%) |
| 25 to 29 Years | 190 (22.6%) | 66 (6.7%) |
| 30 to 34 Years | 45 (5.3%) | 82 (8.4%) |
| 35 to 39 Years | 48 (5.7%) | 44 (4.5%) |
| 40 to 44 Years | 22 (2.6%) | 57 (5.8%) |
| 45 to 49 Years | 35 (4.2%) | 67 (6.8%) |
| 50 to 54 Years | 41 (4.9%) | 11 (1.1%) |
| 55 to 59 Years | 44 (5.2%) | 106 (10.8%) |
| 60 to 64 Years | 26 (3.1%) | 59 (6.0%) |
| 65 to 69 Years | 34 (4.0%) | 42 (4.3%) |
| 70 to 74 Years | 10 (1.2%) | 142 (14.5%) |
| 75 to 79 Years | 20 (2.4%) | 23 (2.3%) |
| 80 to 84 Years | 4 (0.5%) | 11 (1.1%) |
| 85 Years and over | 0 (0.0%) | 16 (1.6%) |
| Total | 841 (100.0%) | 982 (100.0%) |
Families and Households in Midland City
Median Family Size in Midland City
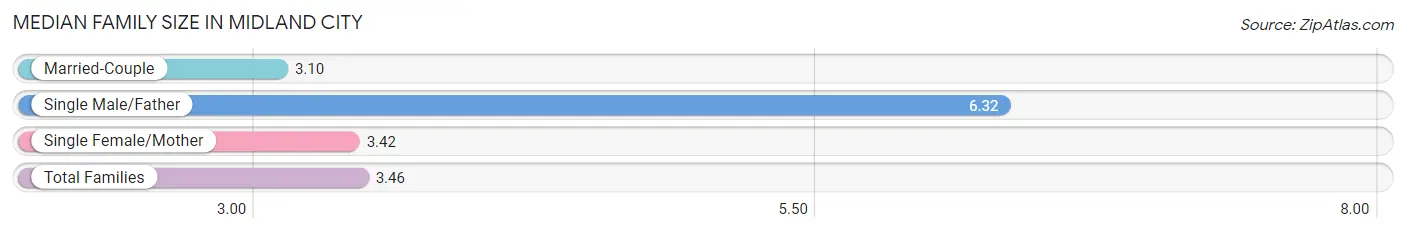
The median family size in Midland City is 3.46 persons per family, with single male/father families (25 | 6.6%) accounting for the largest median family size of 6.32 persons per family. On the other hand, married-couple families (183 | 48.4%) represent the smallest median family size with 3.10 persons per family.
| Family Type | # Families | Family Size |
| Married-Couple | 183 (48.4%) | 3.10 |
| Single Male/Father | 25 (6.6%) | 6.32 |
| Single Female/Mother | 170 (45.0%) | 3.42 |
| Total Families | 378 (100.0%) | 3.46 |
Median Household Size in Midland City
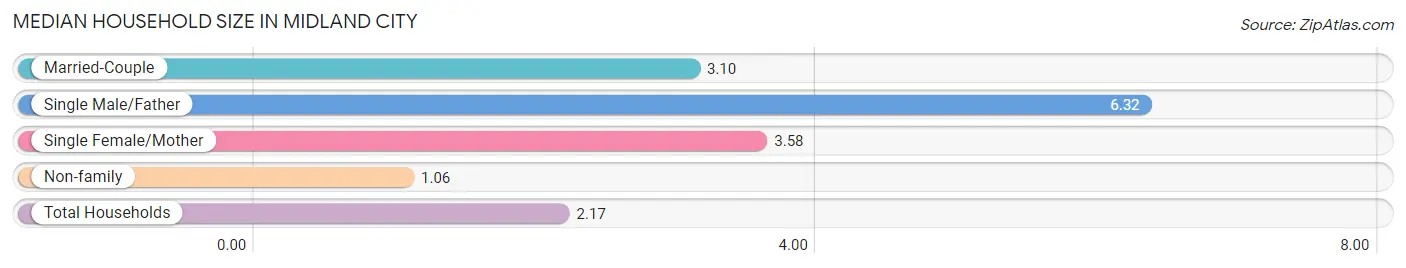
The median household size in Midland City is 2.17 persons per household, with single male/father households (25 | 3.0%) accounting for the largest median household size of 6.32 persons per household. non-family households (462 | 55.0%) represent the smallest median household size with 1.06 persons per household.
| Household Type | # Households | Household Size |
| Married-Couple | 183 (21.8%) | 3.10 |
| Single Male/Father | 25 (3.0%) | 6.32 |
| Single Female/Mother | 170 (20.2%) | 3.58 |
| Non-family | 462 (55.0%) | 1.06 |
| Total Households | 840 (100.0%) | 2.17 |
Household Size by Marriage Status in Midland City
Out of a total of 840 households in Midland City, 378 (45.0%) are family households, while 462 (55.0%) are nonfamily households. The most numerous type of family households are 2-person households, comprising 189, and the most common type of nonfamily households are 1-person households, comprising 443.
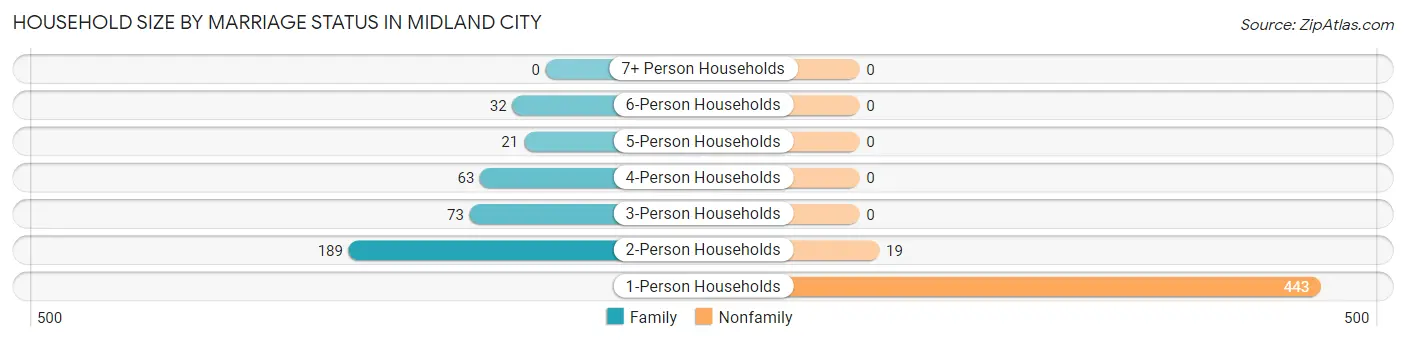
| Household Size | Family Households | Nonfamily Households |
| 1-Person Households | - | 443 (52.7%) |
| 2-Person Households | 189 (22.5%) | 19 (2.3%) |
| 3-Person Households | 73 (8.7%) | 0 (0.0%) |
| 4-Person Households | 63 (7.5%) | 0 (0.0%) |
| 5-Person Households | 21 (2.5%) | 0 (0.0%) |
| 6-Person Households | 32 (3.8%) | 0 (0.0%) |
| 7+ Person Households | 0 (0.0%) | 0 (0.0%) |
| Total | 378 (45.0%) | 462 (55.0%) |
Female Fertility in Midland City
Fertility by Age in Midland City
Average fertility rate in Midland City is 51.0 births per 1,000 women. Women in the age bracket of 15 to 19 years have the highest fertility rate with 300.0 births per 1,000 women. Women in the age bracket of 15 to 19 years acount for 54.5% of all women with births.
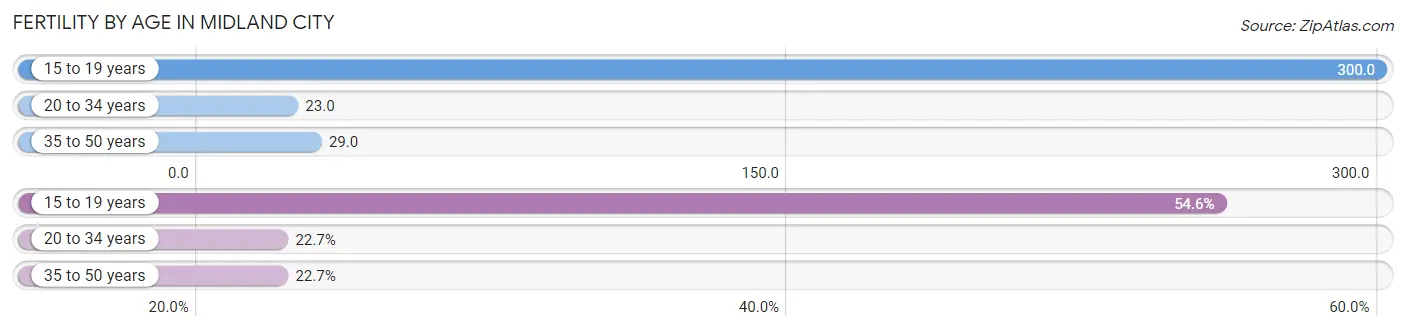
| Age Bracket | Women with Births | Births / 1,000 Women |
| 15 to 19 years | 12 (54.5%) | 300.0 |
| 20 to 34 years | 5 (22.7%) | 23.0 |
| 35 to 50 years | 5 (22.7%) | 29.0 |
| Total | 22 (100.0%) | 51.0 |
Fertility by Age by Marriage Status in Midland City
22.7% of women with births (22) in Midland City are married. The highest percentage of unmarried women with births falls into 15 to 19 years age bracket with 100.0% of them unmarried at the time of birth, while the lowest percentage of unmarried women with births belong to 35 to 50 years age bracket with 0.0% of them unmarried.
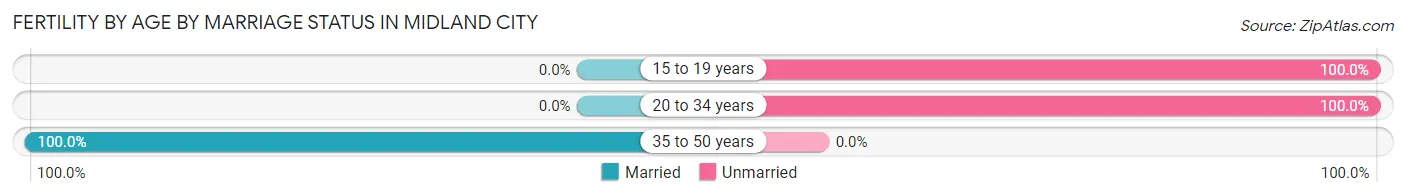
| Age Bracket | Married | Unmarried |
| 15 to 19 years | 0 (0.0%) | 12 (100.0%) |
| 20 to 34 years | 0 (0.0%) | 5 (100.0%) |
| 35 to 50 years | 5 (100.0%) | 0 (0.0%) |
| Total | 5 (22.7%) | 17 (77.3%) |
Fertility by Education in Midland City
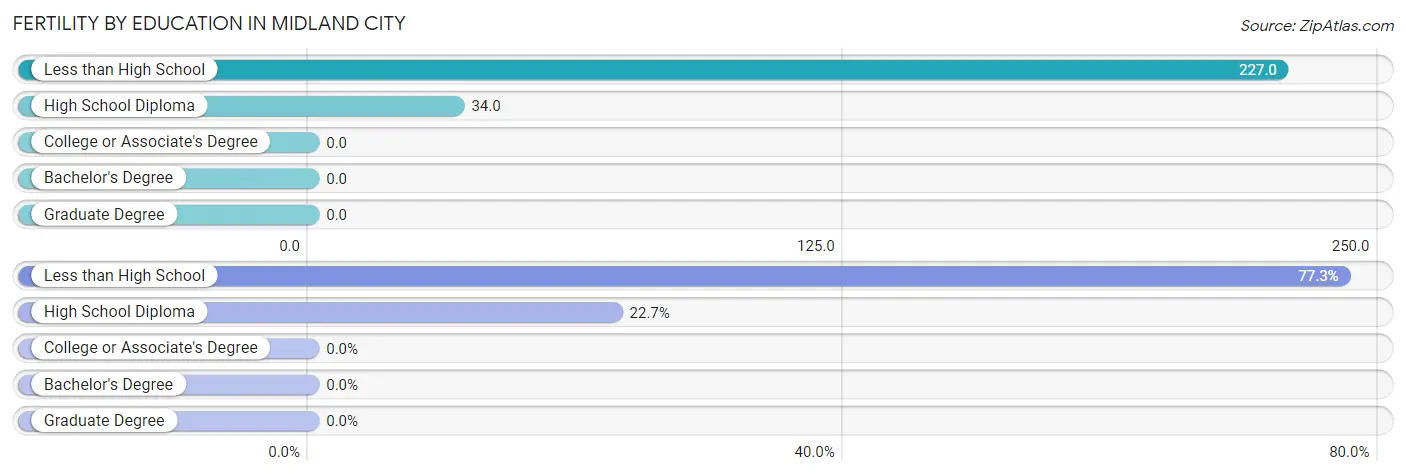
| Educational Attainment | Women with Births | Births / 1,000 Women |
| Less than High School | 17 (77.3%) | 227.0 |
| High School Diploma | 5 (22.7%) | 34.0 |
| College or Associate's Degree | 0 (0.0%) | 0.0 |
| Bachelor's Degree | 0 (0.0%) | 0.0 |
| Graduate Degree | 0 (0.0%) | 0.0 |
| Total | 22 (100.0%) | 51.0 |
Fertility by Education by Marriage Status in Midland City
77.3% of women with births in Midland City are unmarried. Women with the educational attainment of high school diploma are most likely to be married with 100.0% of them married at childbirth, while women with the educational attainment of less than high school are least likely to be married with 100.0% of them unmarried at childbirth.
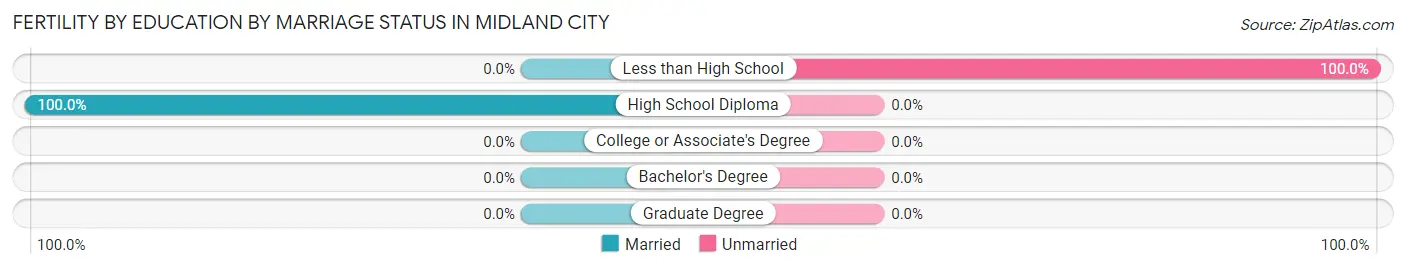
| Educational Attainment | Married | Unmarried |
| Less than High School | 0 (0.0%) | 17 (100.0%) |
| High School Diploma | 5 (100.0%) | 0 (0.0%) |
| College or Associate's Degree | 0 (0.0%) | 0 (0.0%) |
| Bachelor's Degree | 0 (0.0%) | 0 (0.0%) |
| Graduate Degree | 0 (0.0%) | 0 (0.0%) |
| Total | 5 (22.7%) | 17 (77.3%) |
Employment Characteristics in Midland City
Employment by Class of Employer in Midland City
Among the 868 employed individuals in Midland City, private company employees (710 | 81.8%), local government employees (52 | 6.0%), and self-employed (not incorporated) (42 | 4.8%) make up the most common classes of employment.
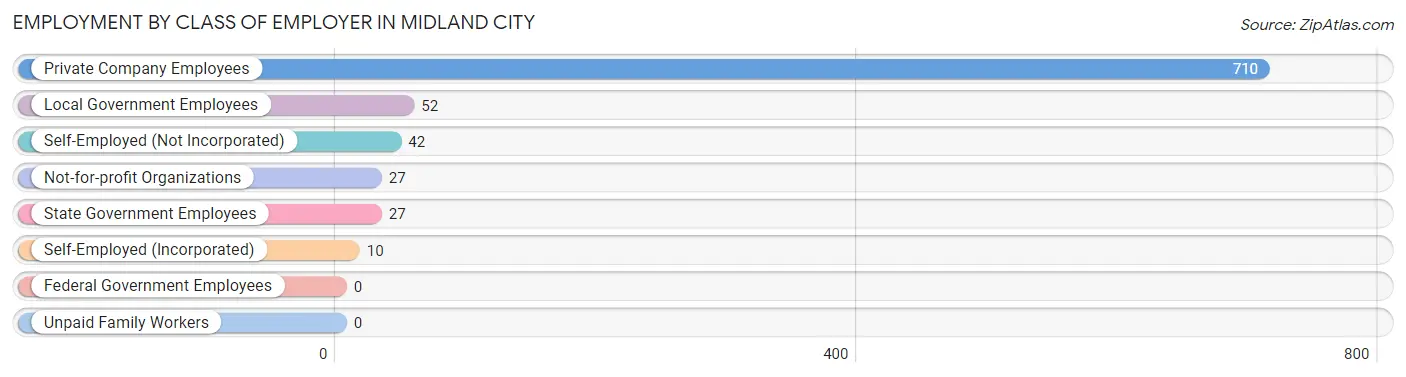
| Employer Class | # Employees | % Employees |
| Private Company Employees | 710 | 81.8% |
| Self-Employed (Incorporated) | 10 | 1.1% |
| Self-Employed (Not Incorporated) | 42 | 4.8% |
| Not-for-profit Organizations | 27 | 3.1% |
| Local Government Employees | 52 | 6.0% |
| State Government Employees | 27 | 3.1% |
| Federal Government Employees | 0 | 0.0% |
| Unpaid Family Workers | 0 | 0.0% |
| Total | 868 | 100.0% |
Employment Status by Age in Midland City
According to the labor force statistics for Midland City, out of the total population over 16 years of age (1,487), 60.4% or 898 individuals are in the labor force, with 1.8% or 16 of them unemployed. The age group with the highest labor force participation rate is 45 to 54 years, with 88.3% or 136 individuals in the labor force. Within the labor force, the 35 to 44 years age range has the highest percentage of unemployed individuals, with 4.7% or 7 of them being unemployed.
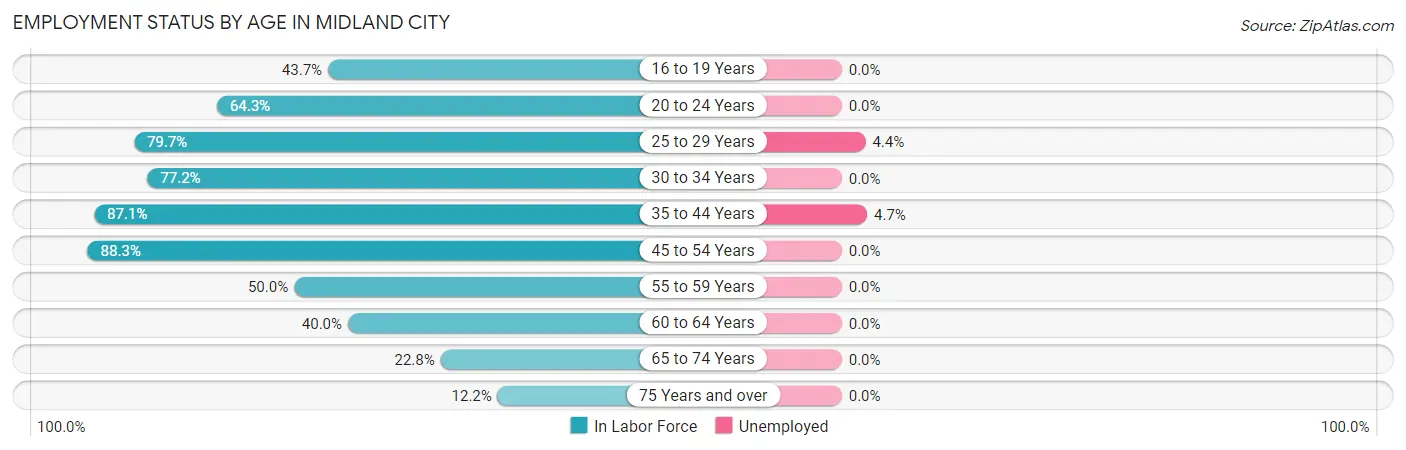
| Age Bracket | In Labor Force | Unemployed |
| 16 to 19 Years | 31 (43.7%) | 0 (0.0%) |
| 20 to 24 Years | 110 (64.3%) | 0 (0.0%) |
| 25 to 29 Years | 204 (79.7%) | 9 (4.4%) |
| 30 to 34 Years | 98 (77.2%) | 0 (0.0%) |
| 35 to 44 Years | 149 (87.1%) | 7 (4.7%) |
| 45 to 54 Years | 136 (88.3%) | 0 (0.0%) |
| 55 to 59 Years | 75 (50.0%) | 0 (0.0%) |
| 60 to 64 Years | 34 (40.0%) | 0 (0.0%) |
| 65 to 74 Years | 52 (22.8%) | 0 (0.0%) |
| 75 Years and over | 9 (12.2%) | 0 (0.0%) |
| Total | 898 (60.4%) | 16 (1.8%) |
Employment Status by Educational Attainment in Midland City
According to labor force statistics for Midland City, 73.8% of individuals (696) out of the total population between 25 and 64 years of age (943) are in the labor force, with 2.3% or 16 of them being unemployed. The group with the highest labor force participation rate are those with the educational attainment of high school diploma, with 93.0% or 318 individuals in the labor force. Within the labor force, individuals with college / associate degree education have the highest percentage of unemployment, with 3.5% or 7 of them being unemployed.
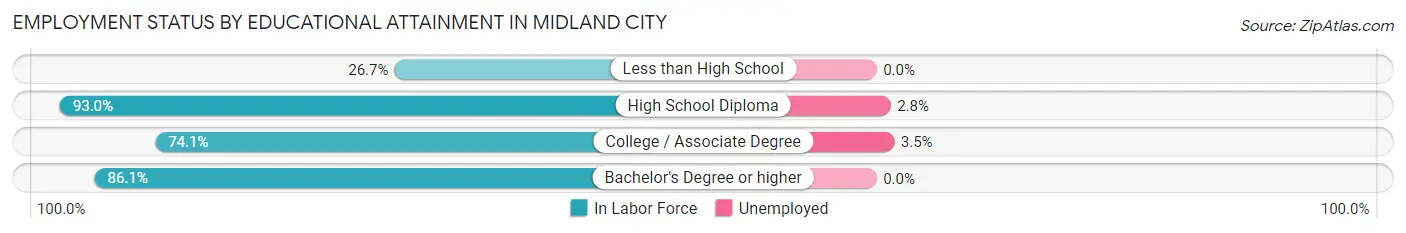
| Educational Attainment | In Labor Force | Unemployed |
| Less than High School | 48 (26.7%) | 0 (0.0%) |
| High School Diploma | 318 (93.0%) | 10 (2.8%) |
| College / Associate Degree | 200 (74.1%) | 9 (3.5%) |
| Bachelor's Degree or higher | 130 (86.1%) | 0 (0.0%) |
| Total | 696 (73.8%) | 22 (2.3%) |
Employment Occupations by Sex in Midland City
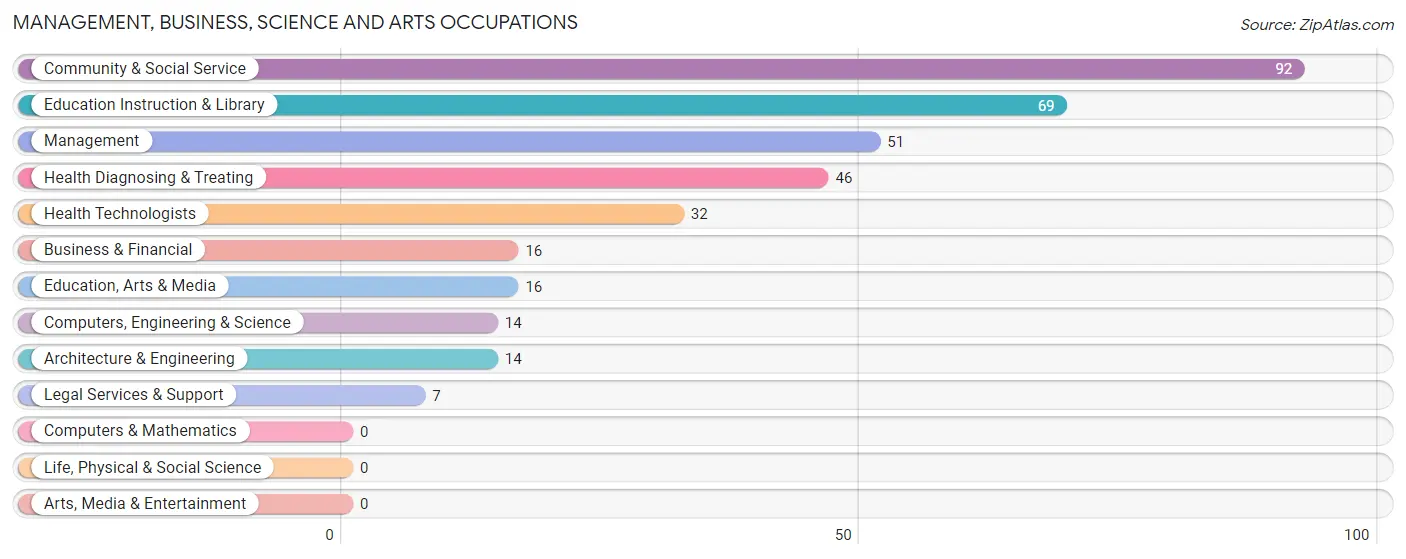
Management, Business, Science and Arts Occupations
The most common Management, Business, Science and Arts occupations in Midland City are Community & Social Service (92 | 10.4%), Education Instruction & Library (69 | 7.8%), Management (51 | 5.8%), Health Diagnosing & Treating (46 | 5.2%), and Health Technologists (32 | 3.6%).
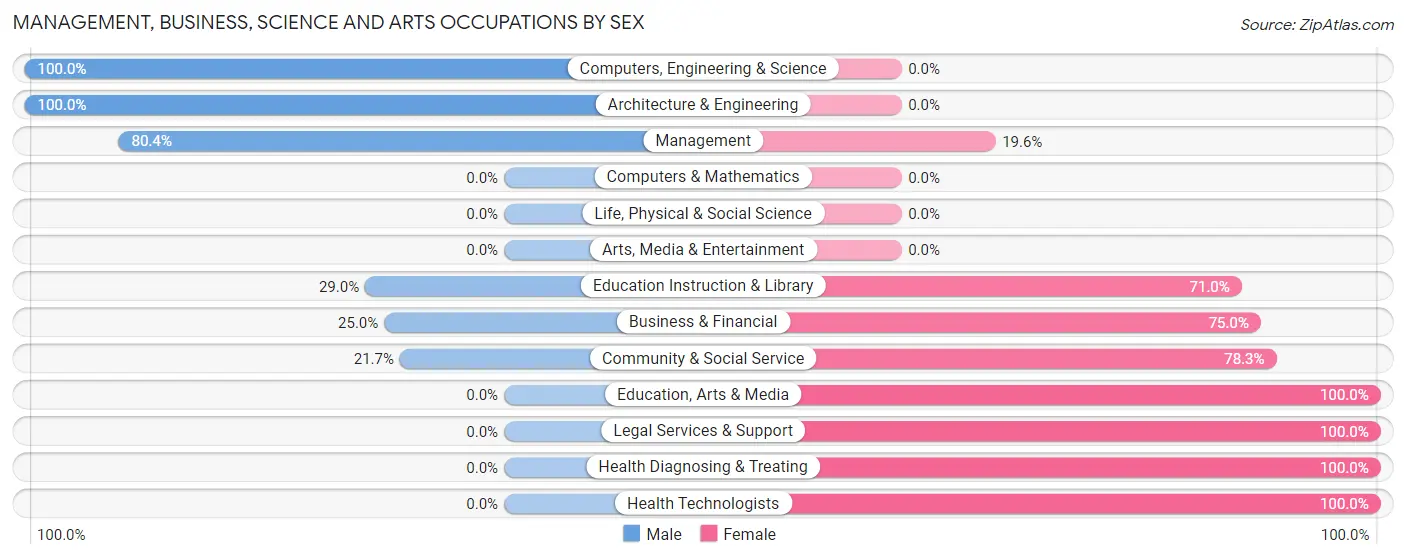
Management, Business, Science and Arts Occupations by Sex
Within the Management, Business, Science and Arts occupations in Midland City, the most male-oriented occupations are Computers, Engineering & Science (100.0%), Architecture & Engineering (100.0%), and Management (80.4%), while the most female-oriented occupations are Education, Arts & Media (100.0%), Legal Services & Support (100.0%), and Health Diagnosing & Treating (100.0%).
| Occupation | Male | Female |
| Management | 41 (80.4%) | 10 (19.6%) |
| Business & Financial | 4 (25.0%) | 12 (75.0%) |
| Computers, Engineering & Science | 14 (100.0%) | 0 (0.0%) |
| Computers & Mathematics | 0 (0.0%) | 0 (0.0%) |
| Architecture & Engineering | 14 (100.0%) | 0 (0.0%) |
| Life, Physical & Social Science | 0 (0.0%) | 0 (0.0%) |
| Community & Social Service | 20 (21.7%) | 72 (78.3%) |
| Education, Arts & Media | 0 (0.0%) | 16 (100.0%) |
| Legal Services & Support | 0 (0.0%) | 7 (100.0%) |
| Education Instruction & Library | 20 (29.0%) | 49 (71.0%) |
| Arts, Media & Entertainment | 0 (0.0%) | 0 (0.0%) |
| Health Diagnosing & Treating | 0 (0.0%) | 46 (100.0%) |
| Health Technologists | 0 (0.0%) | 32 (100.0%) |
| Total (Category) | 79 (36.1%) | 140 (63.9%) |
| Total (Overall) | 400 (45.4%) | 482 (54.6%) |
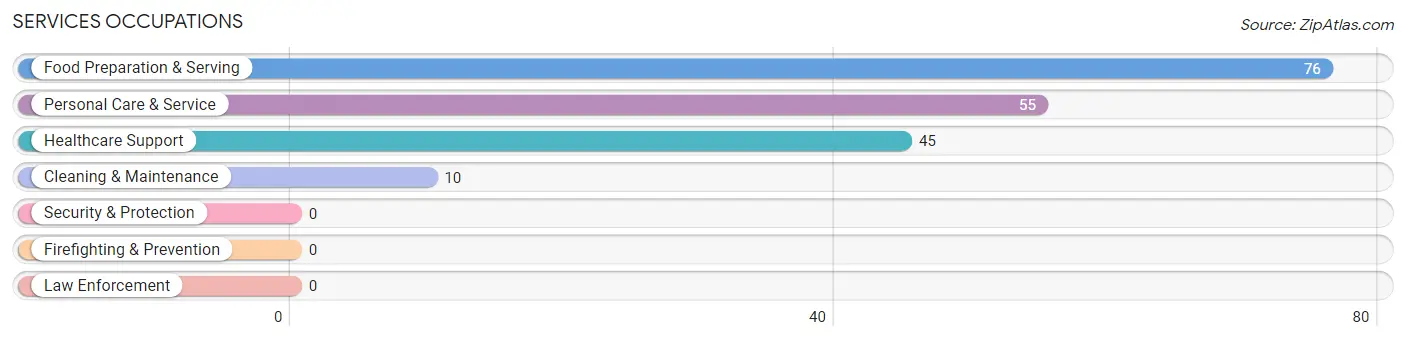
Services Occupations
The most common Services occupations in Midland City are Food Preparation & Serving (76 | 8.6%), Personal Care & Service (55 | 6.2%), Healthcare Support (45 | 5.1%), and Cleaning & Maintenance (10 | 1.1%).
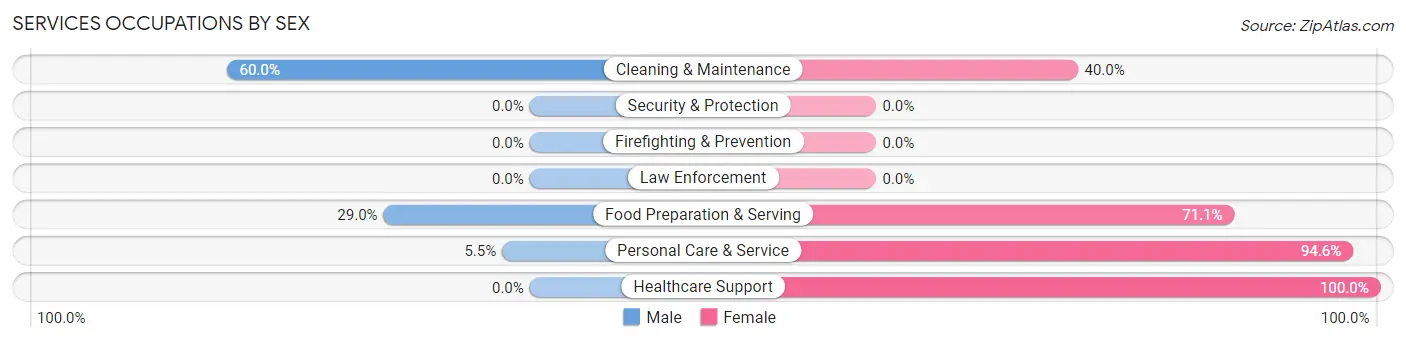
Services Occupations by Sex
Within the Services occupations in Midland City, the most male-oriented occupations are Cleaning & Maintenance (60.0%), Food Preparation & Serving (28.9%), and Personal Care & Service (5.4%), while the most female-oriented occupations are Healthcare Support (100.0%), Personal Care & Service (94.6%), and Food Preparation & Serving (71.1%).
| Occupation | Male | Female |
| Healthcare Support | 0 (0.0%) | 45 (100.0%) |
| Security & Protection | 0 (0.0%) | 0 (0.0%) |
| Firefighting & Prevention | 0 (0.0%) | 0 (0.0%) |
| Law Enforcement | 0 (0.0%) | 0 (0.0%) |
| Food Preparation & Serving | 22 (28.9%) | 54 (71.1%) |
| Cleaning & Maintenance | 6 (60.0%) | 4 (40.0%) |
| Personal Care & Service | 3 (5.4%) | 52 (94.6%) |
| Total (Category) | 31 (16.7%) | 155 (83.3%) |
| Total (Overall) | 400 (45.4%) | 482 (54.6%) |
Sales and Office Occupations
The most common Sales and Office occupations in Midland City are Office & Administration (80 | 9.1%), and Sales & Related (78 | 8.8%).
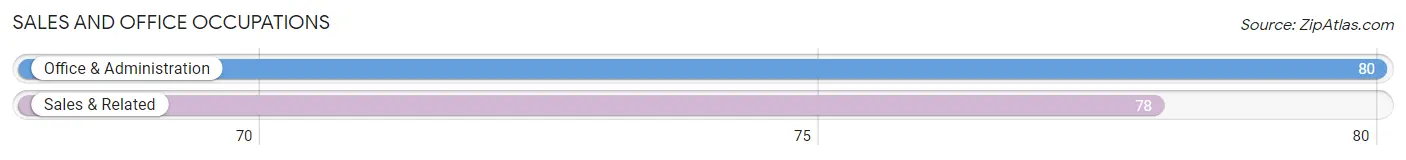
Sales and Office Occupations by Sex

| Occupation | Male | Female |
| Sales & Related | 24 (30.8%) | 54 (69.2%) |
| Office & Administration | 13 (16.3%) | 67 (83.8%) |
| Total (Category) | 37 (23.4%) | 121 (76.6%) |
| Total (Overall) | 400 (45.4%) | 482 (54.6%) |
Natural Resources, Construction and Maintenance Occupations
The most common Natural Resources, Construction and Maintenance occupations in Midland City are Construction & Extraction (105 | 11.9%), and Installation, Maintenance & Repair (15 | 1.7%).
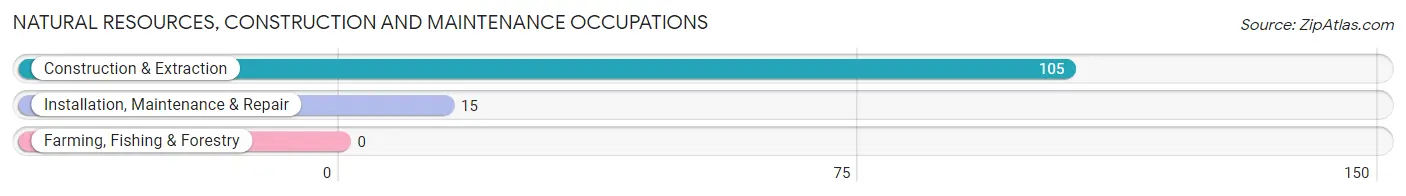
Natural Resources, Construction and Maintenance Occupations by Sex

| Occupation | Male | Female |
| Farming, Fishing & Forestry | 0 (0.0%) | 0 (0.0%) |
| Construction & Extraction | 105 (100.0%) | 0 (0.0%) |
| Installation, Maintenance & Repair | 6 (40.0%) | 9 (60.0%) |
| Total (Category) | 111 (92.5%) | 9 (7.5%) |
| Total (Overall) | 400 (45.4%) | 482 (54.6%) |
Production, Transportation and Moving Occupations
The most common Production, Transportation and Moving occupations in Midland City are Production (88 | 10.0%), Material Moving (84 | 9.5%), and Transportation (27 | 3.1%).
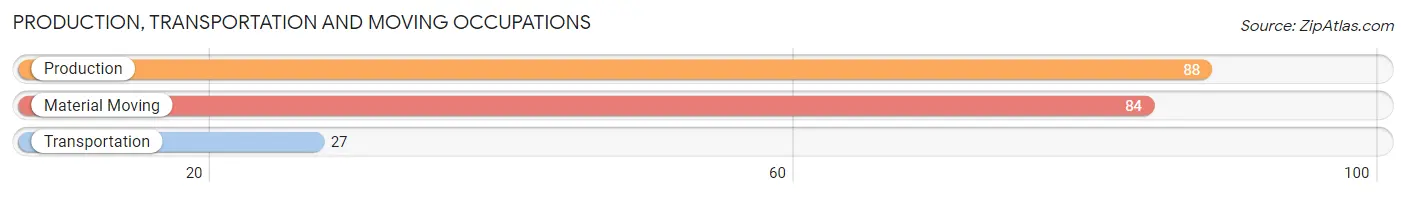
Production, Transportation and Moving Occupations by Sex
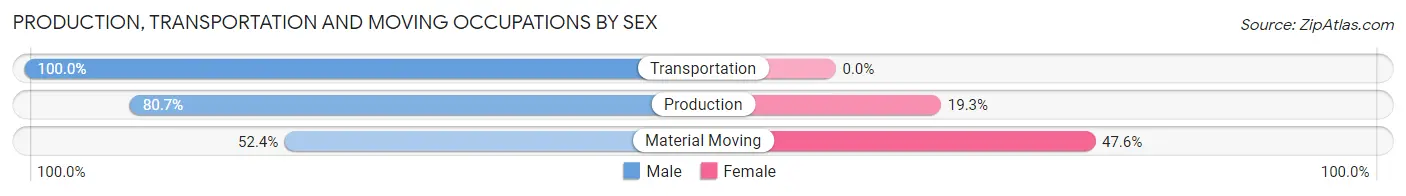
| Occupation | Male | Female |
| Production | 71 (80.7%) | 17 (19.3%) |
| Transportation | 27 (100.0%) | 0 (0.0%) |
| Material Moving | 44 (52.4%) | 40 (47.6%) |
| Total (Category) | 142 (71.4%) | 57 (28.6%) |
| Total (Overall) | 400 (45.4%) | 482 (54.6%) |
Employment Industries by Sex in Midland City
Employment Industries in Midland City
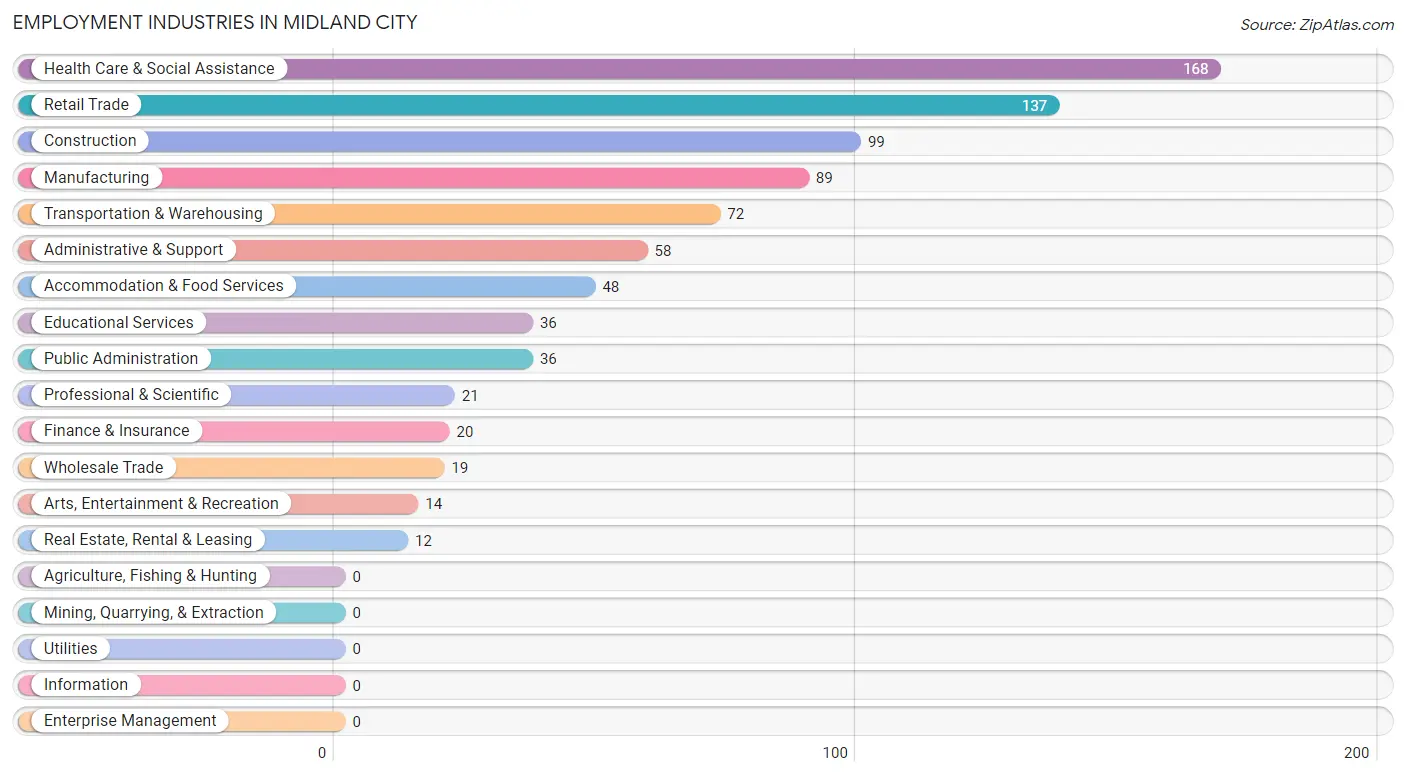
The major employment industries in Midland City include Health Care & Social Assistance (168 | 19.1%), Retail Trade (137 | 15.5%), Construction (99 | 11.2%), Manufacturing (89 | 10.1%), and Transportation & Warehousing (72 | 8.2%).
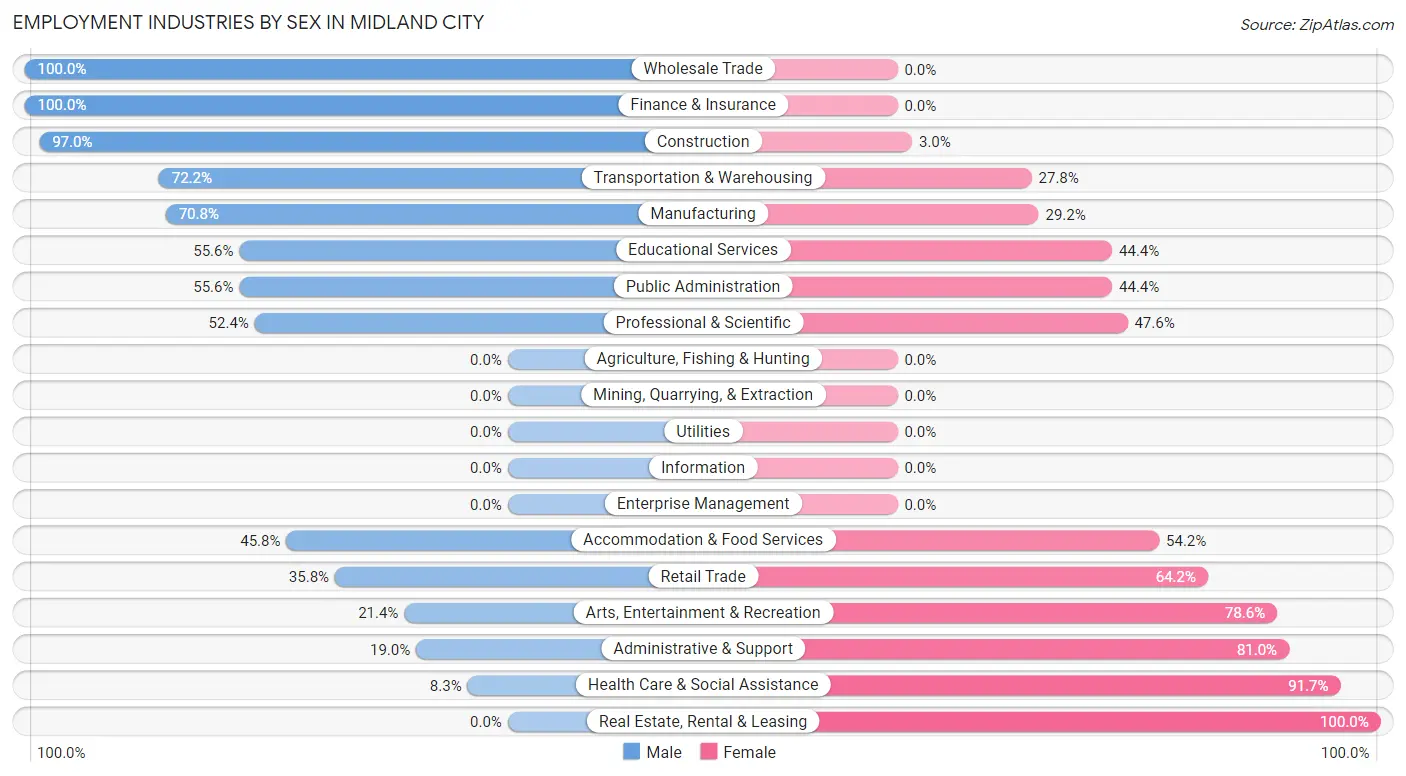
Employment Industries by Sex in Midland City
The Midland City industries that see more men than women are Wholesale Trade (100.0%), Finance & Insurance (100.0%), and Construction (97.0%), whereas the industries that tend to have a higher number of women are Real Estate, Rental & Leasing (100.0%), Health Care & Social Assistance (91.7%), and Administrative & Support (81.0%).
| Industry | Male | Female |
| Agriculture, Fishing & Hunting | 0 (0.0%) | 0 (0.0%) |
| Mining, Quarrying, & Extraction | 0 (0.0%) | 0 (0.0%) |
| Construction | 96 (97.0%) | 3 (3.0%) |
| Manufacturing | 63 (70.8%) | 26 (29.2%) |
| Wholesale Trade | 19 (100.0%) | 0 (0.0%) |
| Retail Trade | 49 (35.8%) | 88 (64.2%) |
| Transportation & Warehousing | 52 (72.2%) | 20 (27.8%) |
| Utilities | 0 (0.0%) | 0 (0.0%) |
| Information | 0 (0.0%) | 0 (0.0%) |
| Finance & Insurance | 20 (100.0%) | 0 (0.0%) |
| Real Estate, Rental & Leasing | 0 (0.0%) | 12 (100.0%) |
| Professional & Scientific | 11 (52.4%) | 10 (47.6%) |
| Enterprise Management | 0 (0.0%) | 0 (0.0%) |
| Administrative & Support | 11 (19.0%) | 47 (81.0%) |
| Educational Services | 20 (55.6%) | 16 (44.4%) |
| Health Care & Social Assistance | 14 (8.3%) | 154 (91.7%) |
| Arts, Entertainment & Recreation | 3 (21.4%) | 11 (78.6%) |
| Accommodation & Food Services | 22 (45.8%) | 26 (54.2%) |
| Public Administration | 20 (55.6%) | 16 (44.4%) |
| Total | 400 (45.4%) | 482 (54.6%) |
Education in Midland City
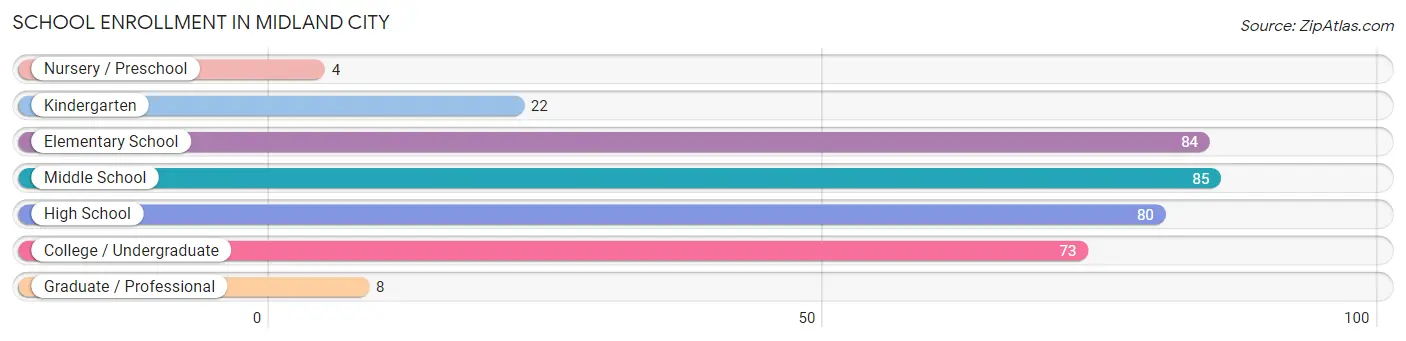
School Enrollment in Midland City
The most common levels of schooling among the 356 students in Midland City are middle school (85 | 23.9%), elementary school (84 | 23.6%), and high school (80 | 22.5%).
| School Level | # Students | % Students |
| Nursery / Preschool | 4 | 1.1% |
| Kindergarten | 22 | 6.2% |
| Elementary School | 84 | 23.6% |
| Middle School | 85 | 23.9% |
| High School | 80 | 22.5% |
| College / Undergraduate | 73 | 20.5% |
| Graduate / Professional | 8 | 2.2% |
| Total | 356 | 100.0% |
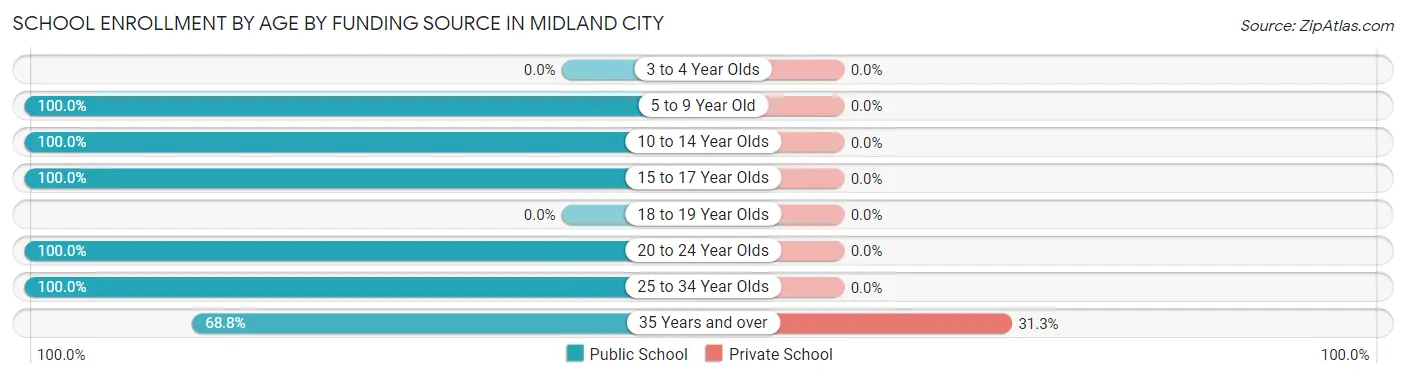
School Enrollment by Age by Funding Source in Midland City
Out of a total of 356 students who are enrolled in schools in Midland City, 5 (1.4%) attend a private institution, while the remaining 351 (98.6%) are enrolled in public schools. The age group of 35 years and over has the highest likelihood of being enrolled in private schools, with 5 (31.2% in the age bracket) enrolled. Conversely, the age group of 5 to 9 year old has the lowest likelihood of being enrolled in a private school, with 77 (100.0% in the age bracket) attending a public institution.
| Age Bracket | Public School | Private School |
| 3 to 4 Year Olds | 0 (0.0%) | 0 (0.0%) |
| 5 to 9 Year Old | 77 (100.0%) | 0 (0.0%) |
| 10 to 14 Year Olds | 128 (100.0%) | 0 (0.0%) |
| 15 to 17 Year Olds | 70 (100.0%) | 0 (0.0%) |
| 18 to 19 Year Olds | 0 (0.0%) | 0 (0.0%) |
| 20 to 24 Year Olds | 55 (100.0%) | 0 (0.0%) |
| 25 to 34 Year Olds | 10 (100.0%) | 0 (0.0%) |
| 35 Years and over | 11 (68.8%) | 5 (31.2%) |
| Total | 351 (98.6%) | 5 (1.4%) |
Educational Attainment by Field of Study in Midland City
Arts & humanities (52 | 33.3%), business (21 | 13.5%), literature & languages (21 | 13.5%), engineering (17 | 10.9%), and liberal arts & history (15 | 9.6%) are the most common fields of study among 156 individuals in Midland City who have obtained a bachelor's degree or higher.
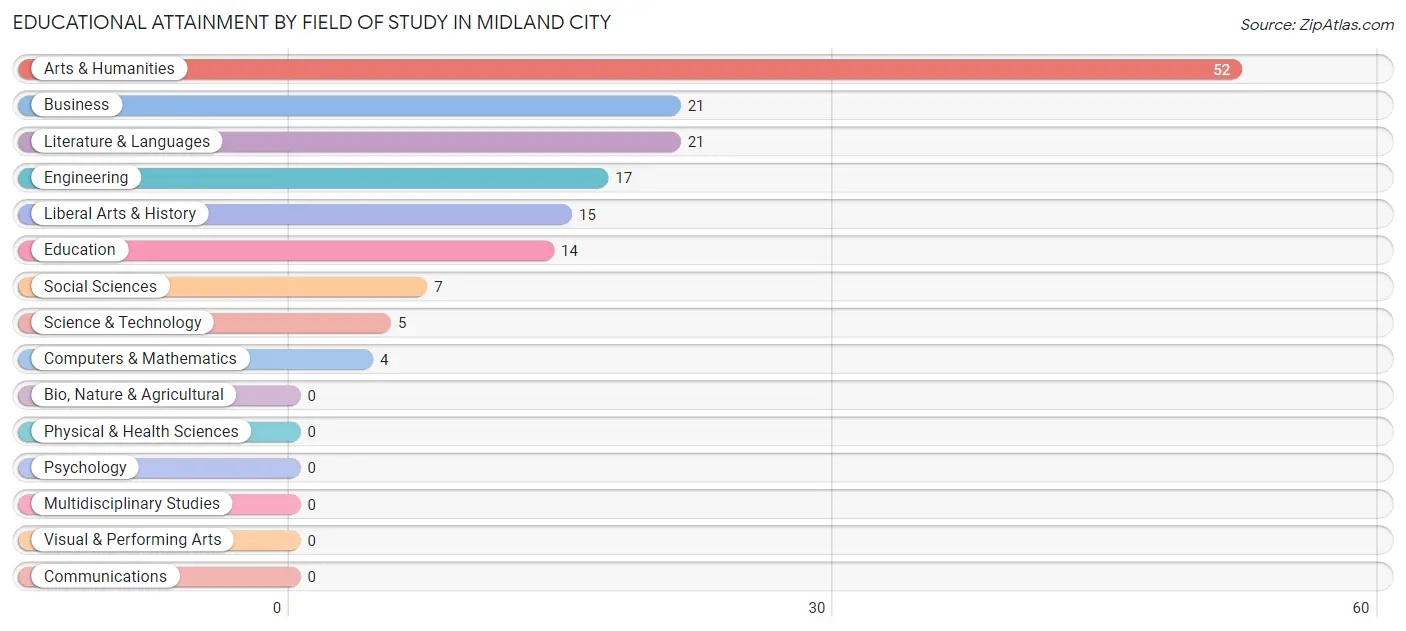
| Field of Study | # Graduates | % Graduates |
| Computers & Mathematics | 4 | 2.6% |
| Bio, Nature & Agricultural | 0 | 0.0% |
| Physical & Health Sciences | 0 | 0.0% |
| Psychology | 0 | 0.0% |
| Social Sciences | 7 | 4.5% |
| Engineering | 17 | 10.9% |
| Multidisciplinary Studies | 0 | 0.0% |
| Science & Technology | 5 | 3.2% |
| Business | 21 | 13.5% |
| Education | 14 | 9.0% |
| Literature & Languages | 21 | 13.5% |
| Liberal Arts & History | 15 | 9.6% |
| Visual & Performing Arts | 0 | 0.0% |
| Communications | 0 | 0.0% |
| Arts & Humanities | 52 | 33.3% |
| Total | 156 | 100.0% |
Transportation & Commute in Midland City
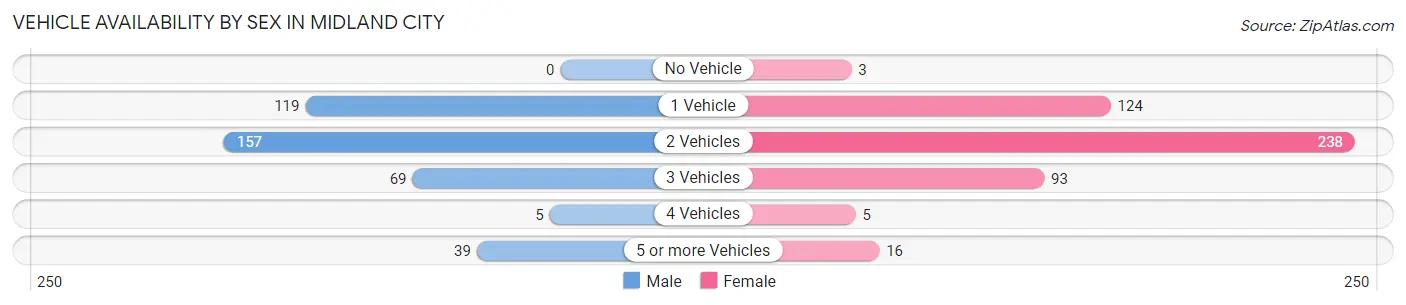
Vehicle Availability by Sex in Midland City
The most prevalent vehicle ownership categories in Midland City are males with 2 vehicles (157, accounting for 40.4%) and females with 2 vehicles (238, making up 32.8%).
| Vehicles Available | Male | Female |
| No Vehicle | 0 (0.0%) | 3 (0.6%) |
| 1 Vehicle | 119 (30.6%) | 124 (25.9%) |
| 2 Vehicles | 157 (40.4%) | 238 (49.7%) |
| 3 Vehicles | 69 (17.7%) | 93 (19.4%) |
| 4 Vehicles | 5 (1.3%) | 5 (1.0%) |
| 5 or more Vehicles | 39 (10.0%) | 16 (3.3%) |
| Total | 389 (100.0%) | 479 (100.0%) |
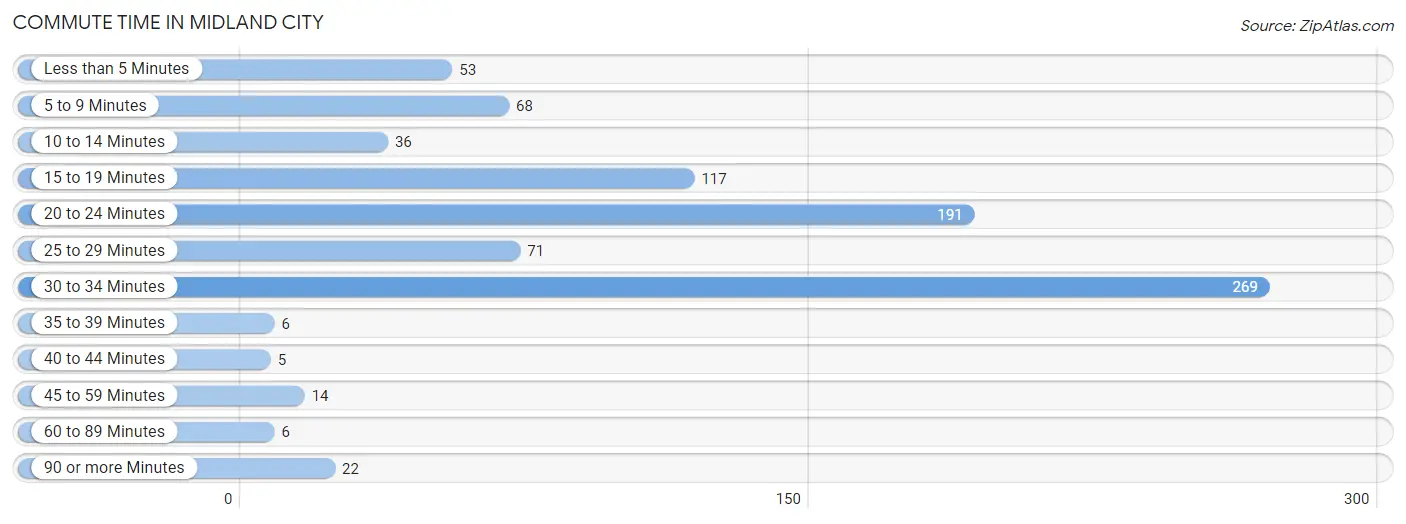
Commute Time in Midland City
The most frequently occuring commute durations in Midland City are 30 to 34 minutes (269 commuters, 31.4%), 20 to 24 minutes (191 commuters, 22.3%), and 15 to 19 minutes (117 commuters, 13.6%).
| Commute Time | # Commuters | % Commuters |
| Less than 5 Minutes | 53 | 6.2% |
| 5 to 9 Minutes | 68 | 7.9% |
| 10 to 14 Minutes | 36 | 4.2% |
| 15 to 19 Minutes | 117 | 13.6% |
| 20 to 24 Minutes | 191 | 22.3% |
| 25 to 29 Minutes | 71 | 8.3% |
| 30 to 34 Minutes | 269 | 31.4% |
| 35 to 39 Minutes | 6 | 0.7% |
| 40 to 44 Minutes | 5 | 0.6% |
| 45 to 59 Minutes | 14 | 1.6% |
| 60 to 89 Minutes | 6 | 0.7% |
| 90 or more Minutes | 22 | 2.6% |
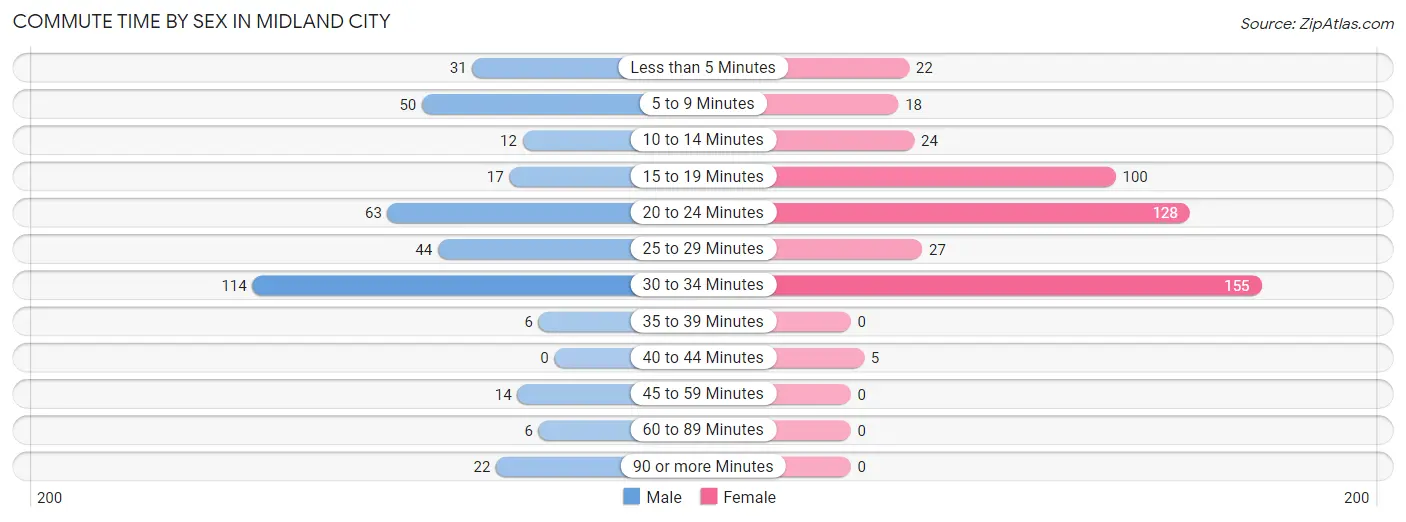
Commute Time by Sex in Midland City
The most common commute times in Midland City are 30 to 34 minutes (114 commuters, 30.1%) for males and 30 to 34 minutes (155 commuters, 32.4%) for females.
| Commute Time | Male | Female |
| Less than 5 Minutes | 31 (8.2%) | 22 (4.6%) |
| 5 to 9 Minutes | 50 (13.2%) | 18 (3.8%) |
| 10 to 14 Minutes | 12 (3.2%) | 24 (5.0%) |
| 15 to 19 Minutes | 17 (4.5%) | 100 (20.9%) |
| 20 to 24 Minutes | 63 (16.6%) | 128 (26.7%) |
| 25 to 29 Minutes | 44 (11.6%) | 27 (5.6%) |
| 30 to 34 Minutes | 114 (30.1%) | 155 (32.4%) |
| 35 to 39 Minutes | 6 (1.6%) | 0 (0.0%) |
| 40 to 44 Minutes | 0 (0.0%) | 5 (1.0%) |
| 45 to 59 Minutes | 14 (3.7%) | 0 (0.0%) |
| 60 to 89 Minutes | 6 (1.6%) | 0 (0.0%) |
| 90 or more Minutes | 22 (5.8%) | 0 (0.0%) |
Time of Departure to Work by Sex in Midland City
The most frequent times of departure to work in Midland City are 12:00 AM to 4:59 AM (74, 19.5%) for males and 7:00 AM to 7:29 AM (102, 21.3%) for females.
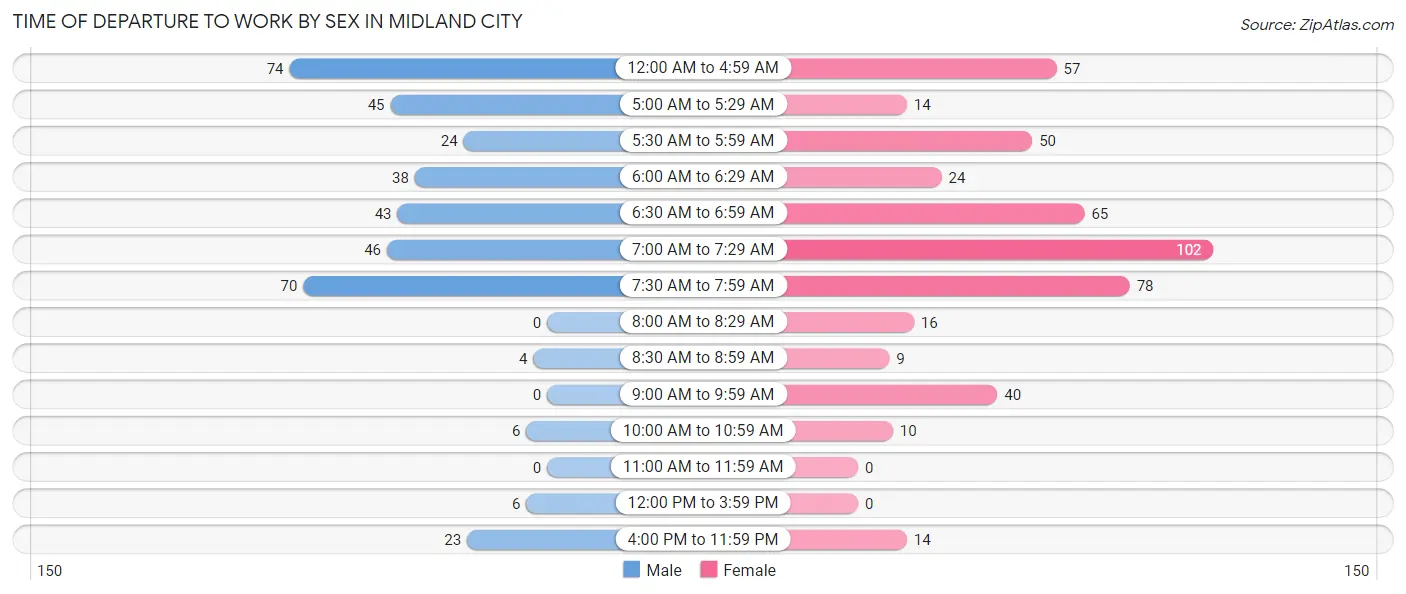
| Time of Departure | Male | Female |
| 12:00 AM to 4:59 AM | 74 (19.5%) | 57 (11.9%) |
| 5:00 AM to 5:29 AM | 45 (11.9%) | 14 (2.9%) |
| 5:30 AM to 5:59 AM | 24 (6.3%) | 50 (10.4%) |
| 6:00 AM to 6:29 AM | 38 (10.0%) | 24 (5.0%) |
| 6:30 AM to 6:59 AM | 43 (11.4%) | 65 (13.6%) |
| 7:00 AM to 7:29 AM | 46 (12.1%) | 102 (21.3%) |
| 7:30 AM to 7:59 AM | 70 (18.5%) | 78 (16.3%) |
| 8:00 AM to 8:29 AM | 0 (0.0%) | 16 (3.3%) |
| 8:30 AM to 8:59 AM | 4 (1.1%) | 9 (1.9%) |
| 9:00 AM to 9:59 AM | 0 (0.0%) | 40 (8.4%) |
| 10:00 AM to 10:59 AM | 6 (1.6%) | 10 (2.1%) |
| 11:00 AM to 11:59 AM | 0 (0.0%) | 0 (0.0%) |
| 12:00 PM to 3:59 PM | 6 (1.6%) | 0 (0.0%) |
| 4:00 PM to 11:59 PM | 23 (6.1%) | 14 (2.9%) |
| Total | 379 (100.0%) | 479 (100.0%) |
Housing Occupancy in Midland City
Occupancy by Ownership in Midland City
Of the total 840 dwellings in Midland City, owner-occupied units account for 292 (34.8%), while renter-occupied units make up 548 (65.2%).
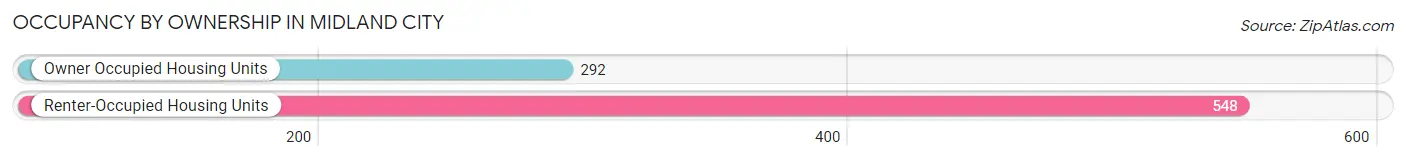
| Occupancy | # Housing Units | % Housing Units |
| Owner Occupied Housing Units | 292 | 34.8% |
| Renter-Occupied Housing Units | 548 | 65.2% |
| Total Occupied Housing Units | 840 | 100.0% |
Occupancy by Household Size in Midland City
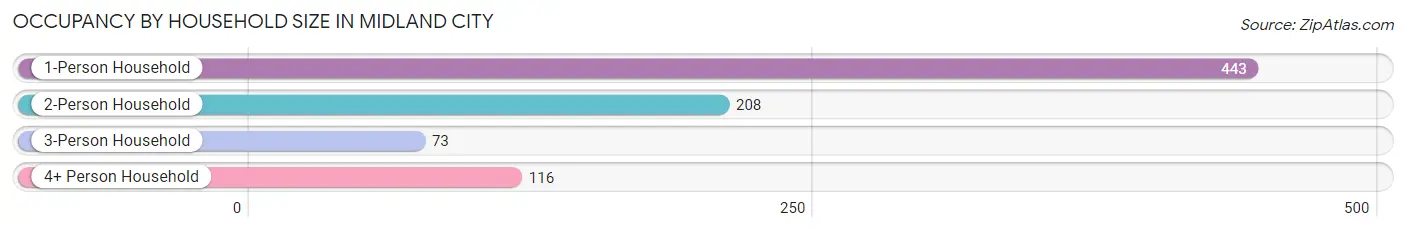
| Household Size | # Housing Units | % Housing Units |
| 1-Person Household | 443 | 52.7% |
| 2-Person Household | 208 | 24.8% |
| 3-Person Household | 73 | 8.7% |
| 4+ Person Household | 116 | 13.8% |
| Total Housing Units | 840 | 100.0% |
Occupancy by Ownership by Household Size in Midland City
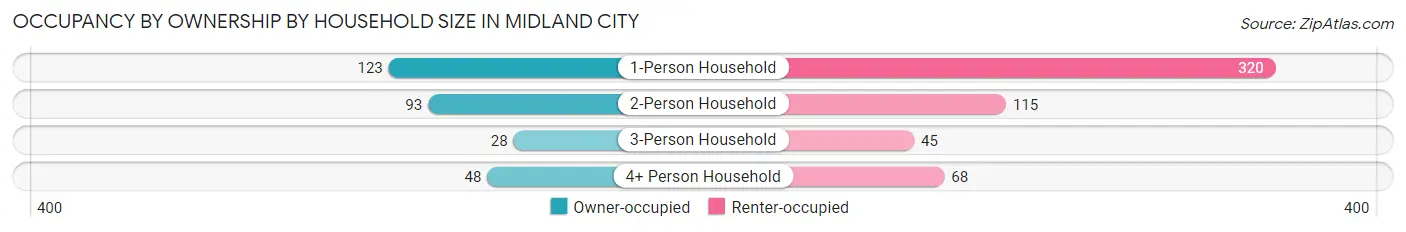
| Household Size | Owner-occupied | Renter-occupied |
| 1-Person Household | 123 (27.8%) | 320 (72.2%) |
| 2-Person Household | 93 (44.7%) | 115 (55.3%) |
| 3-Person Household | 28 (38.4%) | 45 (61.6%) |
| 4+ Person Household | 48 (41.4%) | 68 (58.6%) |
| Total Housing Units | 292 (34.8%) | 548 (65.2%) |
Occupancy by Educational Attainment in Midland City
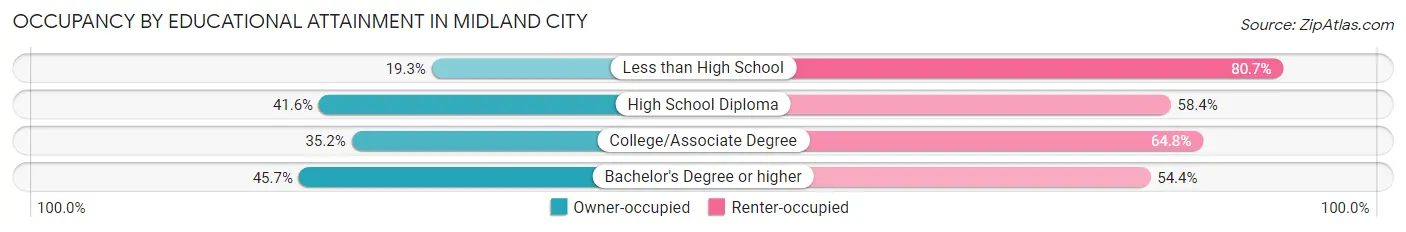
| Household Size | Owner-occupied | Renter-occupied |
| Less than High School | 38 (19.3%) | 159 (80.7%) |
| High School Diploma | 117 (41.6%) | 164 (58.4%) |
| College/Associate Degree | 95 (35.2%) | 175 (64.8%) |
| Bachelor's Degree or higher | 42 (45.7%) | 50 (54.3%) |
Occupancy by Age of Householder in Midland City
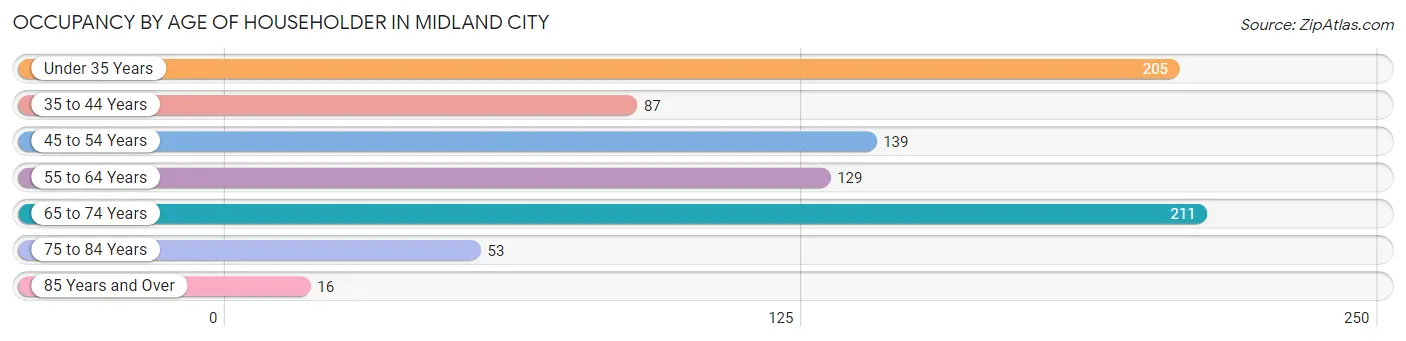
| Age Bracket | # Households | % Households |
| Under 35 Years | 205 | 24.4% |
| 35 to 44 Years | 87 | 10.4% |
| 45 to 54 Years | 139 | 16.6% |
| 55 to 64 Years | 129 | 15.4% |
| 65 to 74 Years | 211 | 25.1% |
| 75 to 84 Years | 53 | 6.3% |
| 85 Years and Over | 16 | 1.9% |
| Total | 840 | 100.0% |
Housing Finances in Midland City
Median Income by Occupancy in Midland City
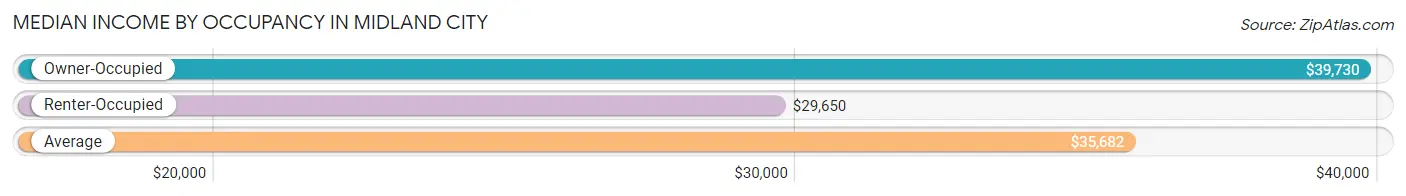
| Occupancy Type | # Households | Median Income |
| Owner-Occupied | 292 (34.8%) | $39,730 |
| Renter-Occupied | 548 (65.2%) | $29,650 |
| Average | 840 (100.0%) | $35,682 |
Occupancy by Householder Income Bracket in Midland City
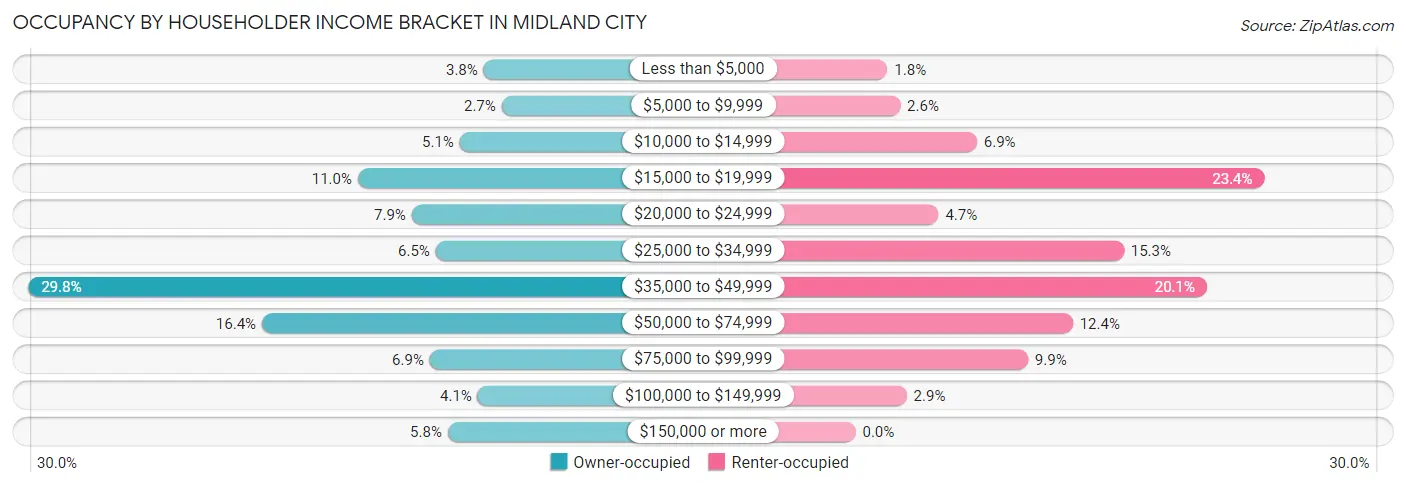
| Income Bracket | Owner-occupied | Renter-occupied |
| Less than $5,000 | 11 (3.8%) | 10 (1.8%) |
| $5,000 to $9,999 | 8 (2.7%) | 14 (2.5%) |
| $10,000 to $14,999 | 15 (5.1%) | 38 (6.9%) |
| $15,000 to $19,999 | 32 (11.0%) | 128 (23.4%) |
| $20,000 to $24,999 | 23 (7.9%) | 26 (4.7%) |
| $25,000 to $34,999 | 19 (6.5%) | 84 (15.3%) |
| $35,000 to $49,999 | 87 (29.8%) | 110 (20.1%) |
| $50,000 to $74,999 | 48 (16.4%) | 68 (12.4%) |
| $75,000 to $99,999 | 20 (6.9%) | 54 (9.9%) |
| $100,000 to $149,999 | 12 (4.1%) | 16 (2.9%) |
| $150,000 or more | 17 (5.8%) | 0 (0.0%) |
| Total | 292 (100.0%) | 548 (100.0%) |
Monthly Housing Cost Tiers in Midland City
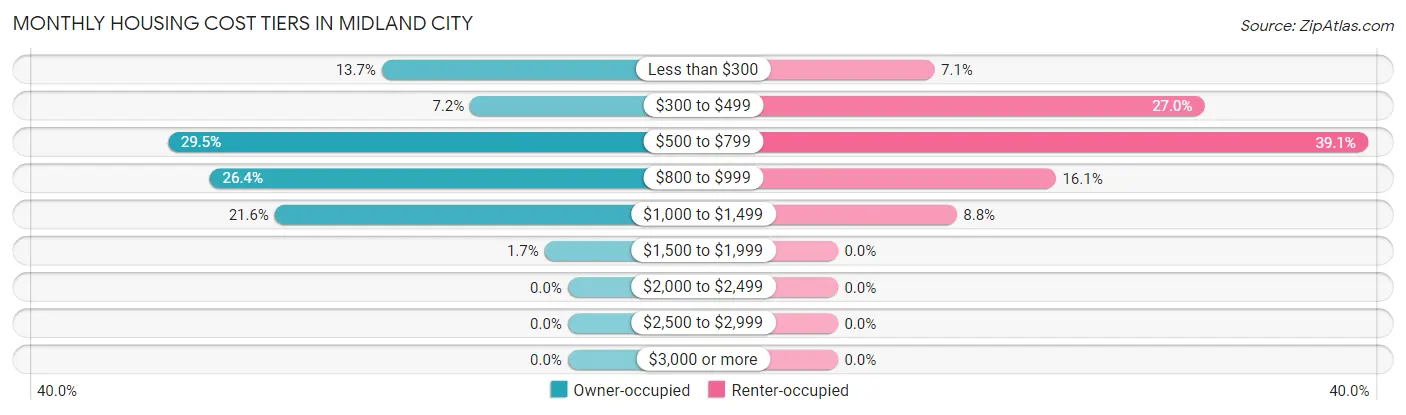
| Monthly Cost | Owner-occupied | Renter-occupied |
| Less than $300 | 40 (13.7%) | 39 (7.1%) |
| $300 to $499 | 21 (7.2%) | 148 (27.0%) |
| $500 to $799 | 86 (29.4%) | 214 (39.1%) |
| $800 to $999 | 77 (26.4%) | 88 (16.1%) |
| $1,000 to $1,499 | 63 (21.6%) | 48 (8.8%) |
| $1,500 to $1,999 | 5 (1.7%) | 0 (0.0%) |
| $2,000 to $2,499 | 0 (0.0%) | 0 (0.0%) |
| $2,500 to $2,999 | 0 (0.0%) | 0 (0.0%) |
| $3,000 or more | 0 (0.0%) | 0 (0.0%) |
| Total | 292 (100.0%) | 548 (100.0%) |
Physical Housing Characteristics in Midland City
Housing Structures in Midland City
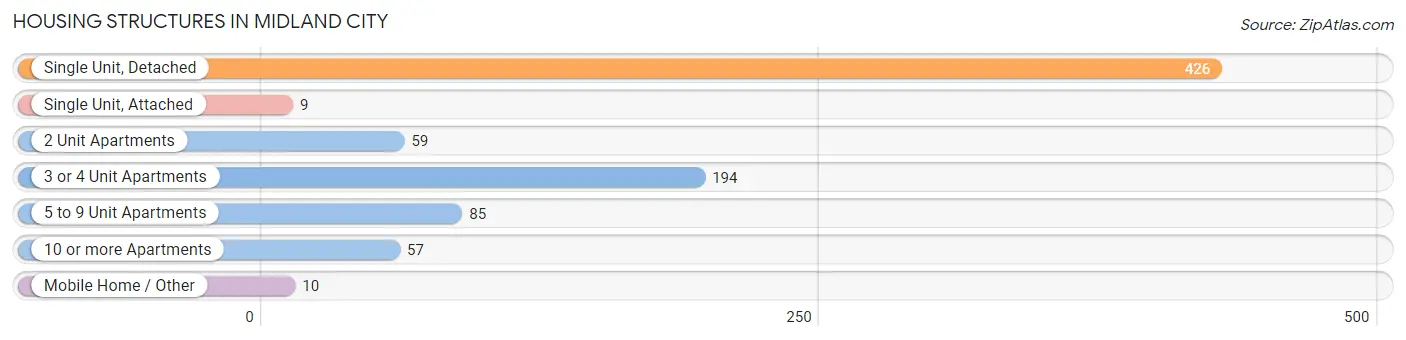
| Structure Type | # Housing Units | % Housing Units |
| Single Unit, Detached | 426 | 50.7% |
| Single Unit, Attached | 9 | 1.1% |
| 2 Unit Apartments | 59 | 7.0% |
| 3 or 4 Unit Apartments | 194 | 23.1% |
| 5 to 9 Unit Apartments | 85 | 10.1% |
| 10 or more Apartments | 57 | 6.8% |
| Mobile Home / Other | 10 | 1.2% |
| Total | 840 | 100.0% |
Housing Structures by Occupancy in Midland City
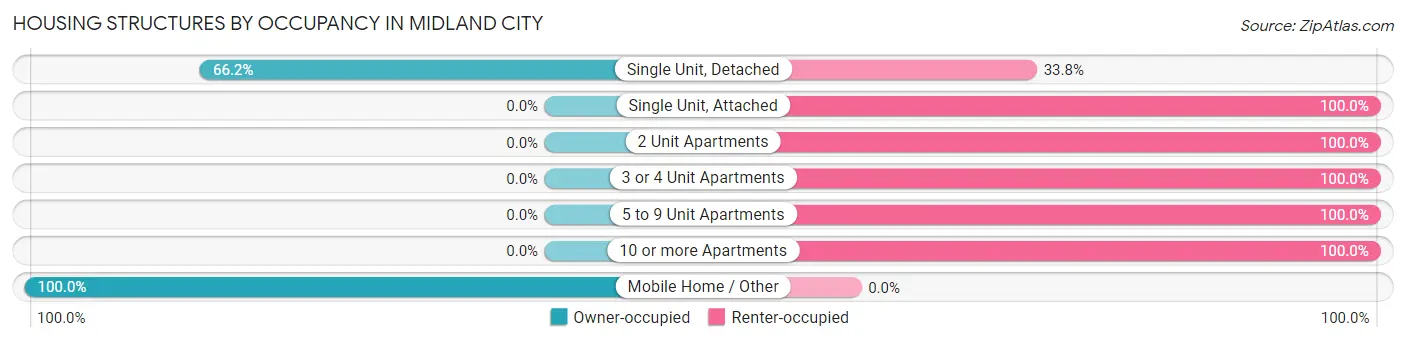
| Structure Type | Owner-occupied | Renter-occupied |
| Single Unit, Detached | 282 (66.2%) | 144 (33.8%) |
| Single Unit, Attached | 0 (0.0%) | 9 (100.0%) |
| 2 Unit Apartments | 0 (0.0%) | 59 (100.0%) |
| 3 or 4 Unit Apartments | 0 (0.0%) | 194 (100.0%) |
| 5 to 9 Unit Apartments | 0 (0.0%) | 85 (100.0%) |
| 10 or more Apartments | 0 (0.0%) | 57 (100.0%) |
| Mobile Home / Other | 10 (100.0%) | 0 (0.0%) |
| Total | 292 (34.8%) | 548 (65.2%) |
Housing Structures by Number of Rooms in Midland City
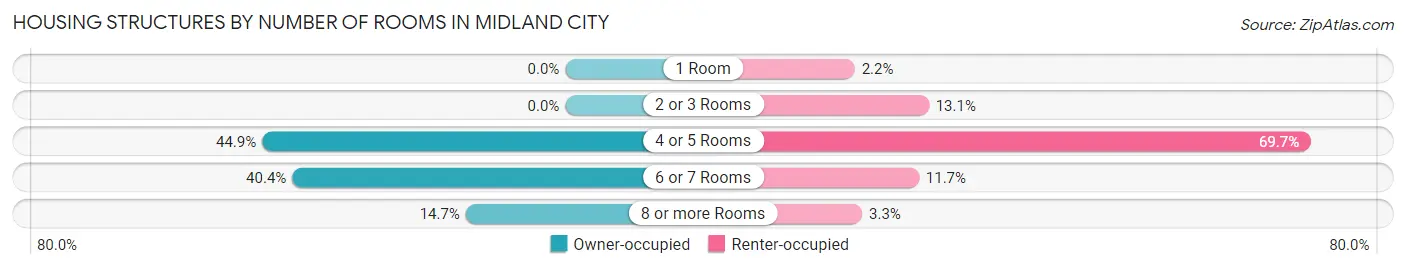
| Number of Rooms | Owner-occupied | Renter-occupied |
| 1 Room | 0 (0.0%) | 12 (2.2%) |
| 2 or 3 Rooms | 0 (0.0%) | 72 (13.1%) |
| 4 or 5 Rooms | 131 (44.9%) | 382 (69.7%) |
| 6 or 7 Rooms | 118 (40.4%) | 64 (11.7%) |
| 8 or more Rooms | 43 (14.7%) | 18 (3.3%) |
| Total | 292 (100.0%) | 548 (100.0%) |
Housing Structure by Heating Type in Midland City
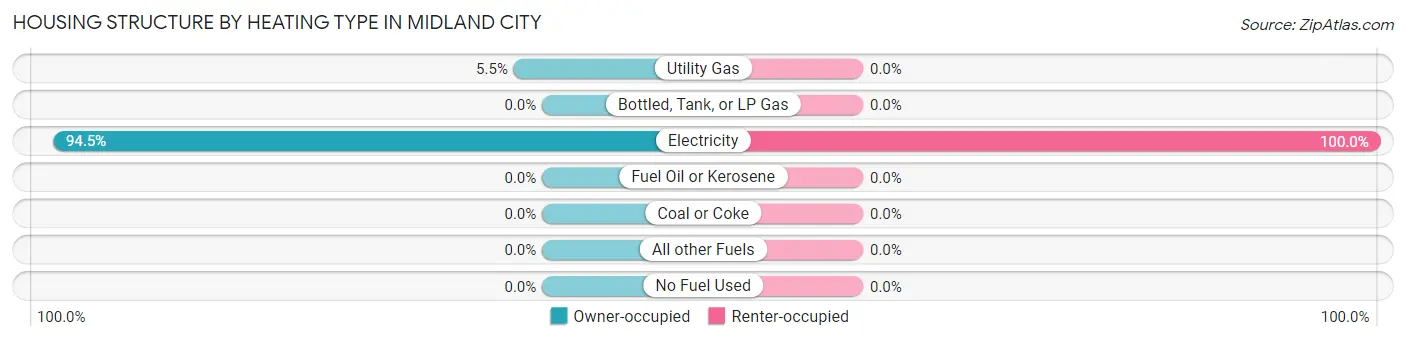
| Heating Type | Owner-occupied | Renter-occupied |
| Utility Gas | 16 (5.5%) | 0 (0.0%) |
| Bottled, Tank, or LP Gas | 0 (0.0%) | 0 (0.0%) |
| Electricity | 276 (94.5%) | 548 (100.0%) |
| Fuel Oil or Kerosene | 0 (0.0%) | 0 (0.0%) |
| Coal or Coke | 0 (0.0%) | 0 (0.0%) |
| All other Fuels | 0 (0.0%) | 0 (0.0%) |
| No Fuel Used | 0 (0.0%) | 0 (0.0%) |
| Total | 292 (100.0%) | 548 (100.0%) |
Household Vehicle Usage in Midland City
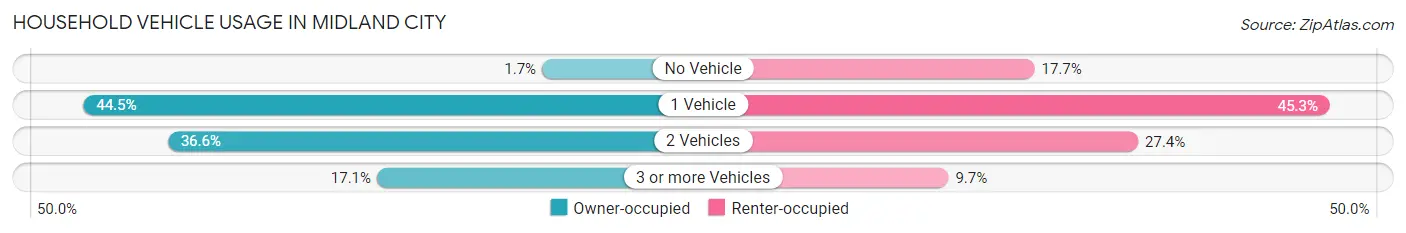
| Vehicles per Household | Owner-occupied | Renter-occupied |
| No Vehicle | 5 (1.7%) | 97 (17.7%) |
| 1 Vehicle | 130 (44.5%) | 248 (45.3%) |
| 2 Vehicles | 107 (36.6%) | 150 (27.4%) |
| 3 or more Vehicles | 50 (17.1%) | 53 (9.7%) |
| Total | 292 (100.0%) | 548 (100.0%) |
Real Estate & Mortgages in Midland City
Real Estate and Mortgage Overview in Midland City
| Characteristic | Without Mortgage | With Mortgage |
| Housing Units | 80 | 212 |
| Median Property Value | $96,400 | $134,000 |
| Median Household Income | - | - |
| Monthly Housing Costs | $300 | $0 |
| Real Estate Taxes | - | - |
Property Value by Mortgage Status in Midland City
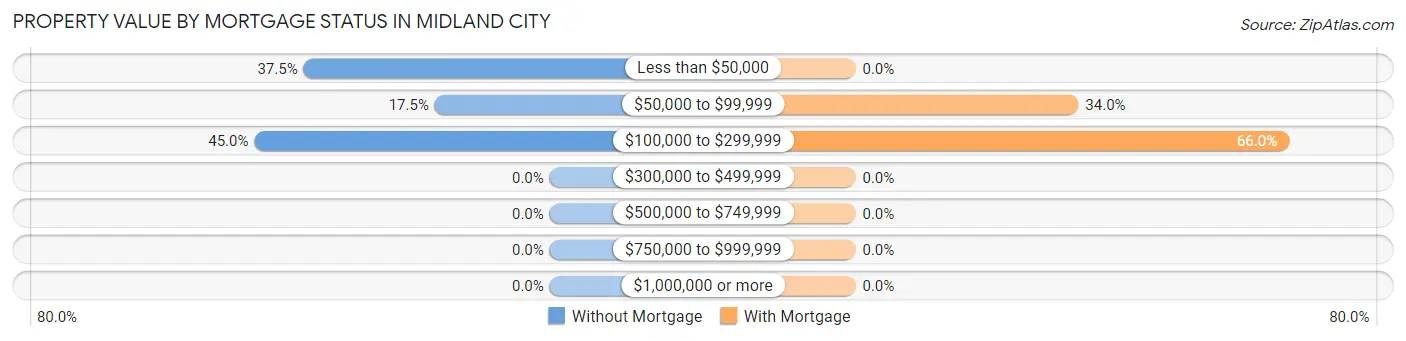
| Property Value | Without Mortgage | With Mortgage |
| Less than $50,000 | 30 (37.5%) | 0 (0.0%) |
| $50,000 to $99,999 | 14 (17.5%) | 72 (34.0%) |
| $100,000 to $299,999 | 36 (45.0%) | 140 (66.0%) |
| $300,000 to $499,999 | 0 (0.0%) | 0 (0.0%) |
| $500,000 to $749,999 | 0 (0.0%) | 0 (0.0%) |
| $750,000 to $999,999 | 0 (0.0%) | 0 (0.0%) |
| $1,000,000 or more | 0 (0.0%) | 0 (0.0%) |
| Total | 80 (100.0%) | 212 (100.0%) |
Household Income by Mortgage Status in Midland City
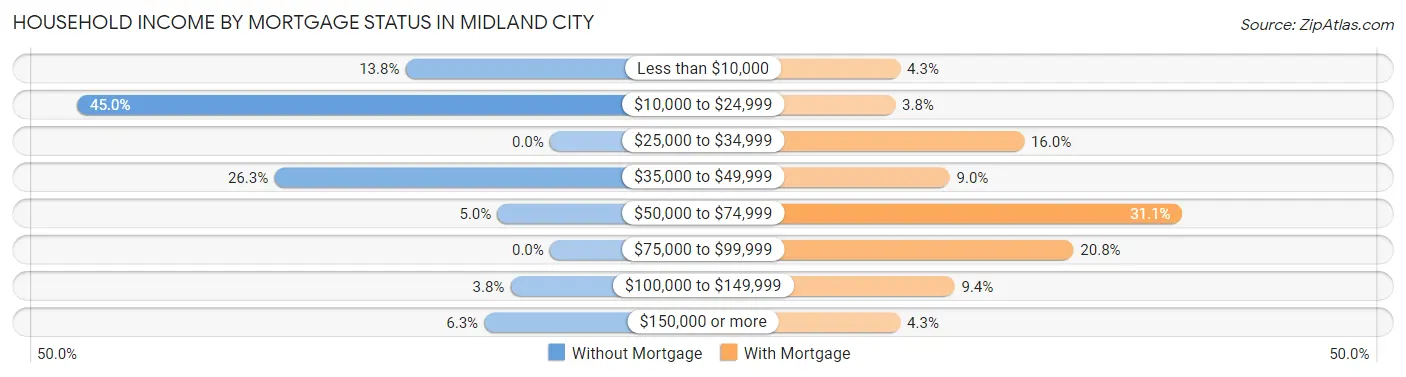
| Household Income | Without Mortgage | With Mortgage |
| Less than $10,000 | 11 (13.8%) | 9 (4.3%) |
| $10,000 to $24,999 | 36 (45.0%) | 8 (3.8%) |
| $25,000 to $34,999 | 0 (0.0%) | 34 (16.0%) |
| $35,000 to $49,999 | 21 (26.3%) | 19 (9.0%) |
| $50,000 to $74,999 | 4 (5.0%) | 66 (31.1%) |
| $75,000 to $99,999 | 0 (0.0%) | 44 (20.7%) |
| $100,000 to $149,999 | 3 (3.7%) | 20 (9.4%) |
| $150,000 or more | 5 (6.2%) | 9 (4.3%) |
| Total | 80 (100.0%) | 212 (100.0%) |
Property Value to Household Income Ratio in Midland City
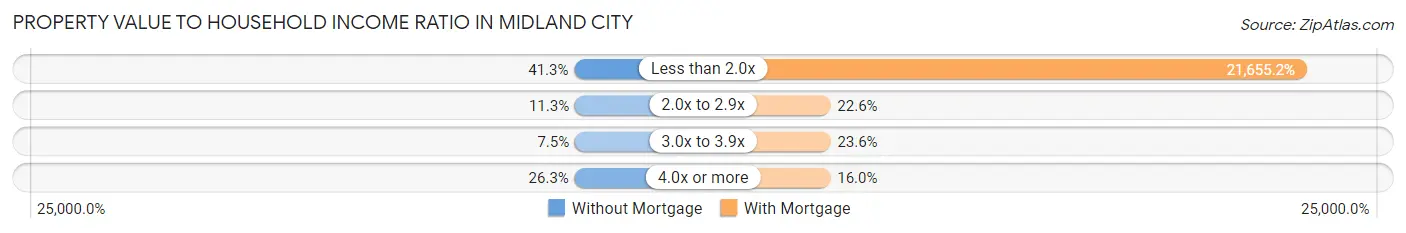
| Value-to-Income Ratio | Without Mortgage | With Mortgage |
| Less than 2.0x | 33 (41.2%) | 45,909 (21,655.2%) |
| 2.0x to 2.9x | 9 (11.3%) | 48 (22.6%) |
| 3.0x to 3.9x | 6 (7.5%) | 50 (23.6%) |
| 4.0x or more | 21 (26.3%) | 34 (16.0%) |
| Total | 80 (100.0%) | 212 (100.0%) |
Real Estate Taxes by Mortgage Status in Midland City
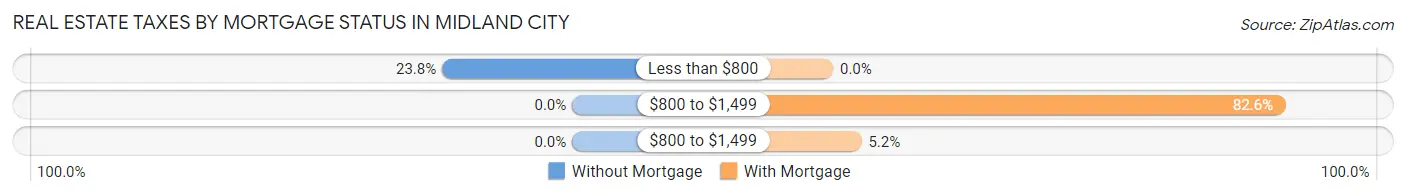
| Property Taxes | Without Mortgage | With Mortgage |
| Less than $800 | 19 (23.7%) | 0 (0.0%) |
| $800 to $1,499 | 0 (0.0%) | 175 (82.6%) |
| $800 to $1,499 | 0 (0.0%) | 11 (5.2%) |
| Total | 80 (100.0%) | 212 (100.0%) |
Health & Disability in Midland City
Health Insurance Coverage by Age in Midland City
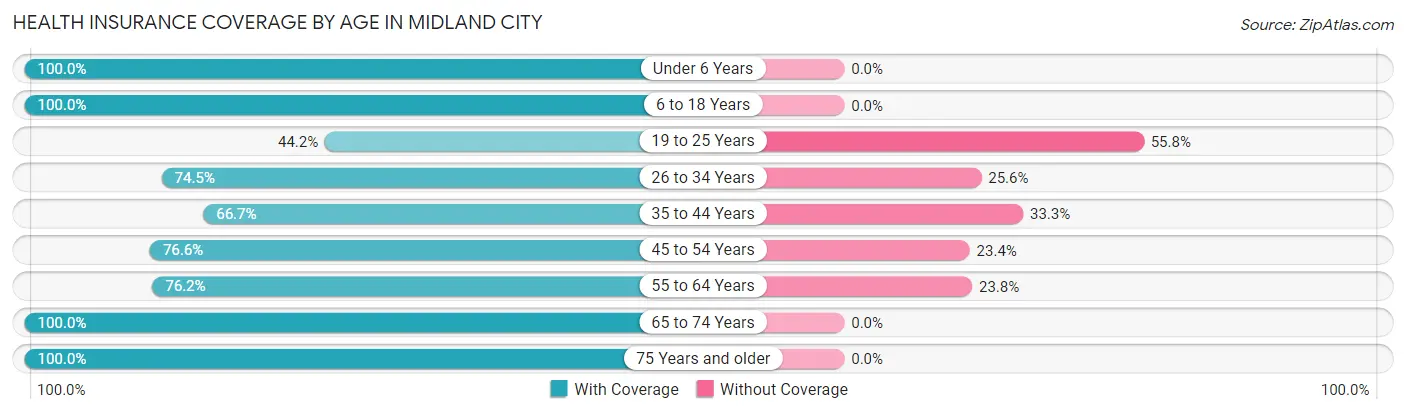
| Age Bracket | With Coverage | Without Coverage |
| Under 6 Years | 98 (100.0%) | 0 (0.0%) |
| 6 to 18 Years | 268 (100.0%) | 0 (0.0%) |
| 19 to 25 Years | 102 (44.2%) | 129 (55.8%) |
| 26 to 34 Years | 271 (74.5%) | 93 (25.6%) |
| 35 to 44 Years | 114 (66.7%) | 57 (33.3%) |
| 45 to 54 Years | 118 (76.6%) | 36 (23.4%) |
| 55 to 64 Years | 179 (76.2%) | 56 (23.8%) |
| 65 to 74 Years | 228 (100.0%) | 0 (0.0%) |
| 75 Years and older | 74 (100.0%) | 0 (0.0%) |
| Total | 1,452 (79.6%) | 371 (20.3%) |
Health Insurance Coverage by Citizenship Status in Midland City

| Citizenship Status | With Coverage | Without Coverage |
| Native Born | 98 (100.0%) | 0 (0.0%) |
| Foreign Born, Citizen | 268 (100.0%) | 0 (0.0%) |
| Foreign Born, not a Citizen | 102 (44.2%) | 129 (55.8%) |
Health Insurance Coverage by Household Income in Midland City
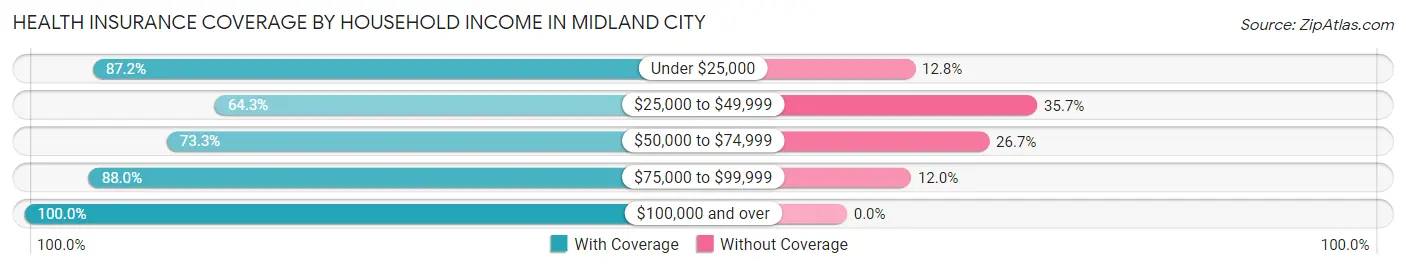
| Household Income | With Coverage | Without Coverage |
| Under $25,000 | 396 (87.2%) | 58 (12.8%) |
| $25,000 to $49,999 | 339 (64.3%) | 188 (35.7%) |
| $50,000 to $74,999 | 220 (73.3%) | 80 (26.7%) |
| $75,000 to $99,999 | 329 (88.0%) | 45 (12.0%) |
| $100,000 and over | 168 (100.0%) | 0 (0.0%) |
Public vs Private Health Insurance Coverage by Age in Midland City
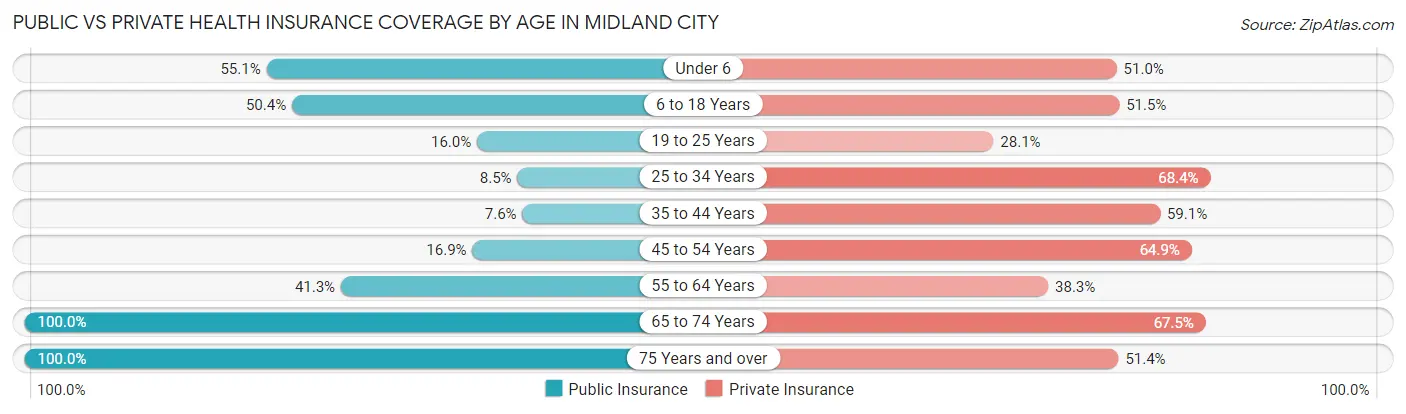
| Age Bracket | Public Insurance | Private Insurance |
| Under 6 | 54 (55.1%) | 50 (51.0%) |
| 6 to 18 Years | 135 (50.4%) | 138 (51.5%) |
| 19 to 25 Years | 37 (16.0%) | 65 (28.1%) |
| 25 to 34 Years | 31 (8.5%) | 249 (68.4%) |
| 35 to 44 Years | 13 (7.6%) | 101 (59.1%) |
| 45 to 54 Years | 26 (16.9%) | 100 (64.9%) |
| 55 to 64 Years | 97 (41.3%) | 90 (38.3%) |
| 65 to 74 Years | 228 (100.0%) | 154 (67.5%) |
| 75 Years and over | 74 (100.0%) | 38 (51.3%) |
| Total | 695 (38.1%) | 985 (54.0%) |
Disability Status by Sex by Age in Midland City
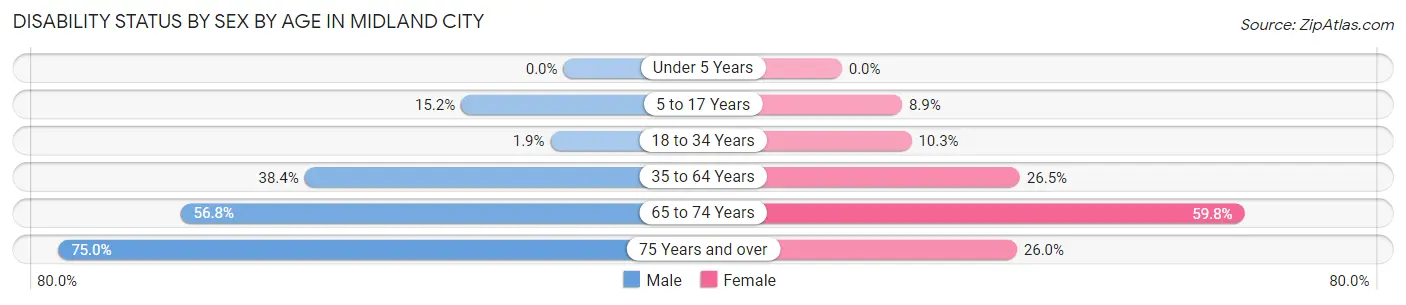
| Age Bracket | Male | Female |
| Under 5 Years | 0 (0.0%) | 0 (0.0%) |
| 5 to 17 Years | 24 (15.2%) | 11 (8.9%) |
| 18 to 34 Years | 7 (1.9%) | 24 (10.3%) |
| 35 to 64 Years | 83 (38.4%) | 91 (26.5%) |
| 65 to 74 Years | 25 (56.8%) | 110 (59.8%) |
| 75 Years and over | 18 (75.0%) | 13 (26.0%) |
Disability Class by Sex by Age in Midland City
Disability Class: Hearing Difficulty
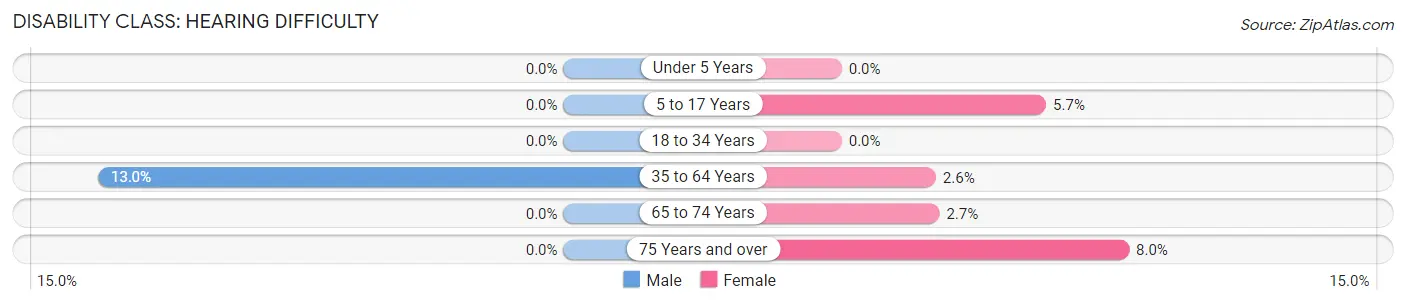
| Age Bracket | Male | Female |
| Under 5 Years | 0 (0.0%) | 0 (0.0%) |
| 5 to 17 Years | 0 (0.0%) | 7 (5.7%) |
| 18 to 34 Years | 0 (0.0%) | 0 (0.0%) |
| 35 to 64 Years | 28 (13.0%) | 9 (2.6%) |
| 65 to 74 Years | 0 (0.0%) | 5 (2.7%) |
| 75 Years and over | 0 (0.0%) | 4 (8.0%) |
Disability Class: Vision Difficulty
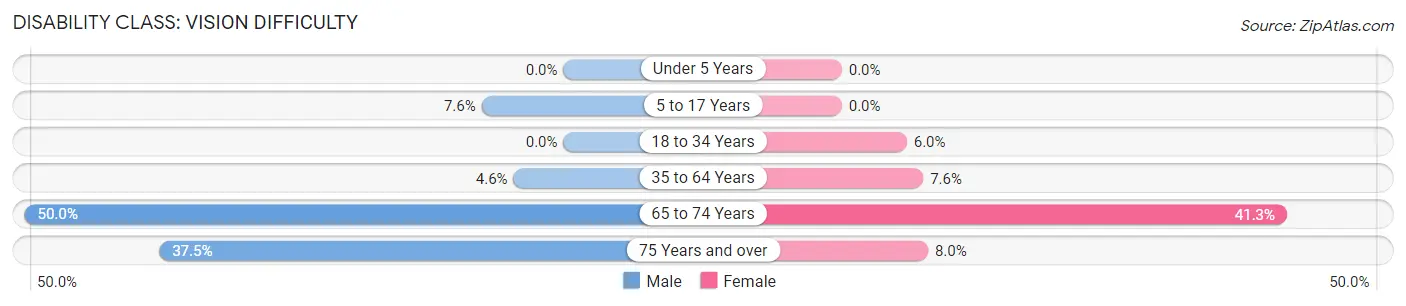
| Age Bracket | Male | Female |
| Under 5 Years | 0 (0.0%) | 0 (0.0%) |
| 5 to 17 Years | 12 (7.6%) | 0 (0.0%) |
| 18 to 34 Years | 0 (0.0%) | 14 (6.0%) |
| 35 to 64 Years | 10 (4.6%) | 26 (7.6%) |
| 65 to 74 Years | 22 (50.0%) | 76 (41.3%) |
| 75 Years and over | 9 (37.5%) | 4 (8.0%) |
Disability Class: Cognitive Difficulty
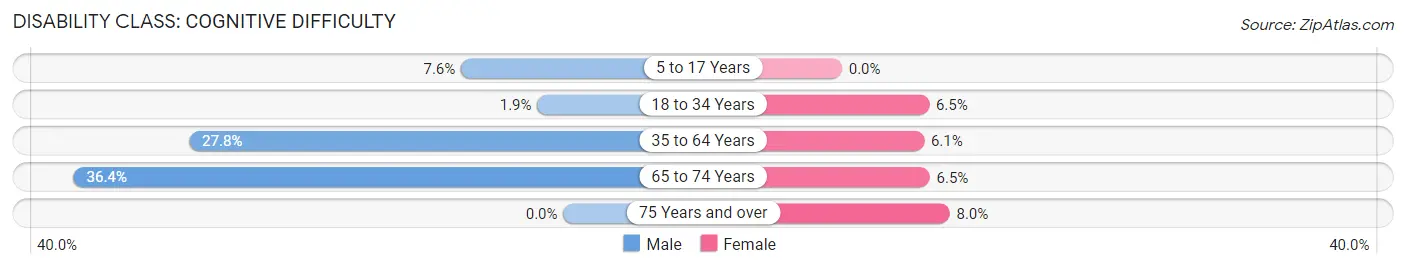
| Age Bracket | Male | Female |
| 5 to 17 Years | 12 (7.6%) | 0 (0.0%) |
| 18 to 34 Years | 7 (1.9%) | 15 (6.5%) |
| 35 to 64 Years | 60 (27.8%) | 21 (6.1%) |
| 65 to 74 Years | 16 (36.4%) | 12 (6.5%) |
| 75 Years and over | 0 (0.0%) | 4 (8.0%) |
Disability Class: Ambulatory Difficulty
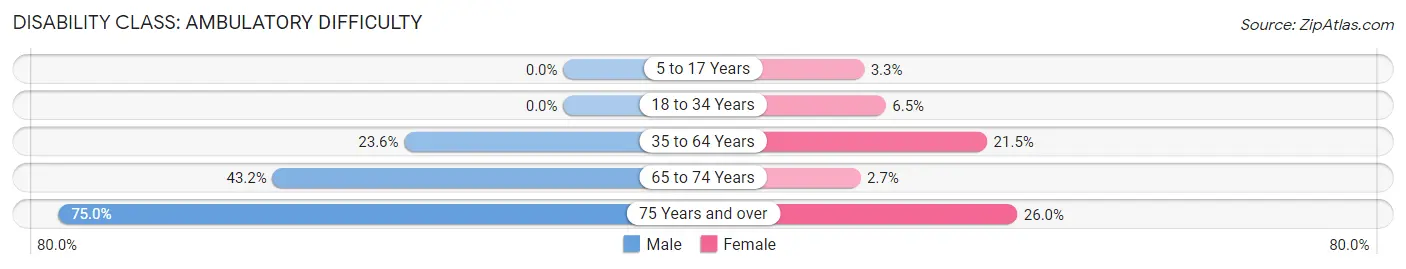
| Age Bracket | Male | Female |
| 5 to 17 Years | 0 (0.0%) | 4 (3.3%) |
| 18 to 34 Years | 0 (0.0%) | 15 (6.5%) |
| 35 to 64 Years | 51 (23.6%) | 74 (21.5%) |
| 65 to 74 Years | 19 (43.2%) | 5 (2.7%) |
| 75 Years and over | 18 (75.0%) | 13 (26.0%) |
Disability Class: Self-Care Difficulty
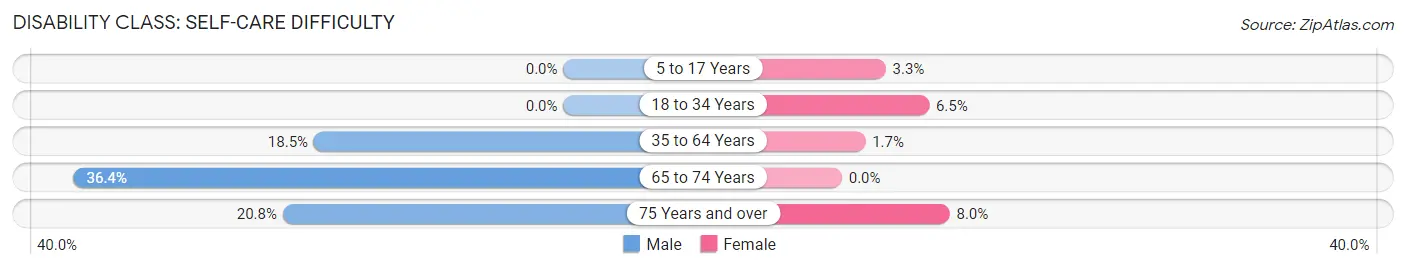
| Age Bracket | Male | Female |
| 5 to 17 Years | 0 (0.0%) | 4 (3.3%) |
| 18 to 34 Years | 0 (0.0%) | 15 (6.5%) |
| 35 to 64 Years | 40 (18.5%) | 6 (1.7%) |
| 65 to 74 Years | 16 (36.4%) | 0 (0.0%) |
| 75 Years and over | 5 (20.8%) | 4 (8.0%) |
Technology Access in Midland City
Computing Device Access in Midland City
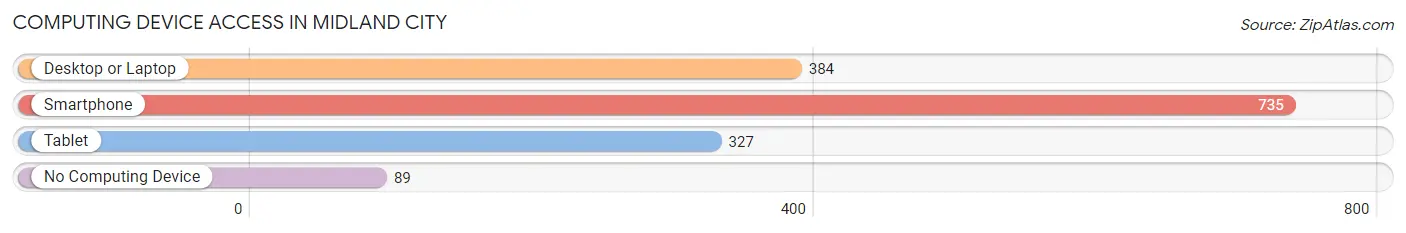
| Device Type | # Households | % Households |
| Desktop or Laptop | 384 | 45.7% |
| Smartphone | 735 | 87.5% |
| Tablet | 327 | 38.9% |
| No Computing Device | 89 | 10.6% |
| Total | 840 | 100.0% |
Internet Access in Midland City
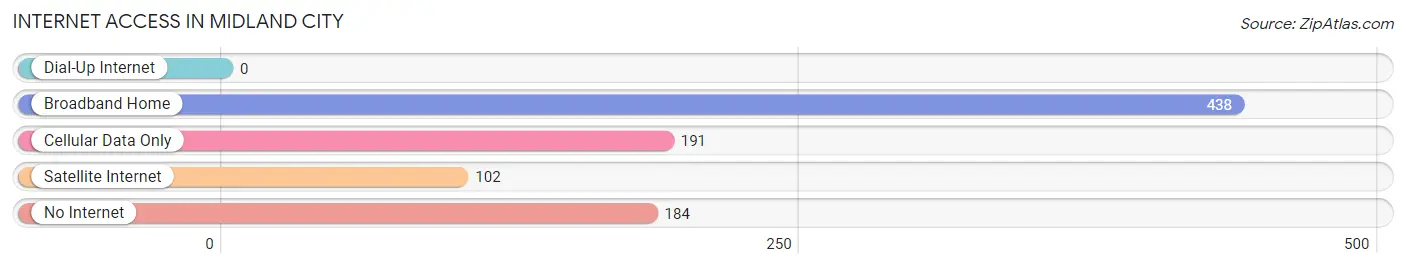
| Internet Type | # Households | % Households |
| Dial-Up Internet | 0 | 0.0% |
| Broadband Home | 438 | 52.1% |
| Cellular Data Only | 191 | 22.7% |
| Satellite Internet | 102 | 12.1% |
| No Internet | 184 | 21.9% |
| Total | 840 | 100.0% |
Midland City Summary
Midland City, Alabama is a small town located in Dale County, Alabama. It is situated on the banks of the Choctawhatchee River, approximately 20 miles south of Dothan, Alabama. The town was founded in 1883 and has a population of approximately 2,500 people.
History
Midland City was founded in 1883 by a group of settlers from Georgia and Florida. The town was named after the nearby Midland Railroad, which ran through the area. The railroad was built in 1881 and was the first railroad to connect the Gulf Coast to the Midwest. The town quickly grew and by the early 1900s, it had become a thriving agricultural center. Cotton, corn, and peanuts were the main crops grown in the area.
In the early 1900s, Midland City was also home to a number of sawmills and lumber companies. The town was also home to a number of small businesses, including a general store, a blacksmith shop, and a hotel.
In the 1920s, Midland City experienced a period of growth and prosperity. The town was home to a number of new businesses, including a movie theater, a bank, and a number of stores. The town also had a number of churches, including the First Baptist Church, which was founded in 1921.
In the 1950s, Midland City experienced a period of decline. The railroad was abandoned and the sawmills and lumber companies closed. The town’s population began to decline as people moved away in search of better opportunities.
In the late 1970s, Midland City began to experience a period of revitalization. The town was home to a number of new businesses, including a grocery store, a hardware store, and a number of restaurants. The town also had a number of new churches, including the Midland City Church of Christ, which was founded in 1978.
Geography
Midland City is located in Dale County, Alabama. The town is situated on the banks of the Choctawhatchee River, approximately 20 miles south of Dothan, Alabama. The town is located in the southeastern corner of the state, near the Florida border.
The town is located in a rural area and is surrounded by farmland. The town is located in a flat, low-lying area and is surrounded by pine forests. The town is located in a humid subtropical climate zone and experiences hot, humid summers and mild winters.
Economy
Midland City’s economy is largely based on agriculture. The town is home to a number of farms, which grow cotton, corn, and peanuts. The town is also home to a number of small businesses, including a grocery store, a hardware store, and a number of restaurants.
The town is also home to a number of manufacturing companies, including a furniture factory and a plastics factory. The town is also home to a number of service-based businesses, including a number of auto repair shops and a number of medical offices.
Demographics
As of the 2010 census, Midland City had a population of 2,500 people. The town is predominantly white, with approximately 75% of the population being white. The town is also home to a small African American population, with approximately 15% of the population being African American. The town is also home to a small Hispanic population, with approximately 5% of the population being Hispanic.
The town has a median household income of approximately $35,000. The town also has a poverty rate of approximately 20%. The town is home to a number of churches, including the First Baptist Church, the Midland City Church of Christ, and the Midland City United Methodist Church.
Common Questions
What is Per Capita Income in Midland City?
Per Capita income in Midland City is $22,235.
What is the Median Family Income in Midland City?
Median Family Income in Midland City is $45,972.
What is the Median Household income in Midland City?
Median Household Income in Midland City is $35,682.
What is Income or Wage Gap in Midland City?
Income or Wage Gap in Midland City is 43.2%.
Women in Midland City earn 56.8 cents for every dollar earned by a man.
What is Inequality or Gini Index in Midland City?
Inequality or Gini Index in Midland City is 0.42.
What is the Total Population of Midland City?
Total Population of Midland City is 1,823.
What is the Total Male Population of Midland City?
Total Male Population of Midland City is 841.
What is the Total Female Population of Midland City?
Total Female Population of Midland City is 982.
What is the Ratio of Males per 100 Females in Midland City?
There are 85.64 Males per 100 Females in Midland City.
What is the Ratio of Females per 100 Males in Midland City?
There are 116.77 Females per 100 Males in Midland City.
What is the Median Population Age in Midland City?
Median Population Age in Midland City is 32.7 Years.
What is the Average Family Size in Midland City
Average Family Size in Midland City is 3.5 People.
What is the Average Household Size in Midland City
Average Household Size in Midland City is 2.2 People.
How Large is the Labor Force in Midland City?
There are 898 People in the Labor Forcein in Midland City.
What is the Percentage of People in the Labor Force in Midland City?
60.4% of People are in the Labor Force in Midland City.
What is the Unemployment Rate in Midland City?
Unemployment Rate in Midland City is 1.8%.