Fairfield, AL Map & Demographics
Fairfield Map
Fairfield Overview
$23,085
PER CAPITA INCOME
$54,254
AVG FAMILY INCOME
$45,646
AVG HOUSEHOLD INCOME
15.7%
WAGE / INCOME GAP [ % ]
84.3¢/ $1
WAGE / INCOME GAP [ $ ]
$10,945
FAMILY INCOME DEFICIT
0.44
INEQUALITY / GINI INDEX
9,975
TOTAL POPULATION
4,336
MALE POPULATION
5,639
FEMALE POPULATION
76.89
MALES / 100 FEMALES
130.05
FEMALES / 100 MALES
30.7
MEDIAN AGE
3.2
AVG FAMILY SIZE
2.4
AVG HOUSEHOLD SIZE
4,306
LABOR FORCE [ PEOPLE ]
54.6%
PERCENT IN LABOR FORCE
8.3%
UNEMPLOYMENT RATE
Fairfield Zip Codes
Fairfield Area Codes
Income in Fairfield
Income Overview in Fairfield
Per Capita Income in Fairfield is $23,085, while median incomes of families and households are $54,254 and $45,646 respectively.
| Characteristic | Number | Measure |
| Per Capita Income | 9,975 | $23,085 |
| Median Family Income | 2,153 | $54,254 |
| Mean Family Income | 2,153 | $70,519 |
| Median Household Income | 3,783 | $45,646 |
| Mean Household Income | 3,783 | $56,599 |
| Income Deficit | 2,153 | $10,945 |
| Wage / Income Gap (%) | 9,975 | 15.74% |
| Wage / Income Gap ($) | 9,975 | 84.26¢ per $1 |
| Gini / Inequality Index | 9,975 | 0.44 |
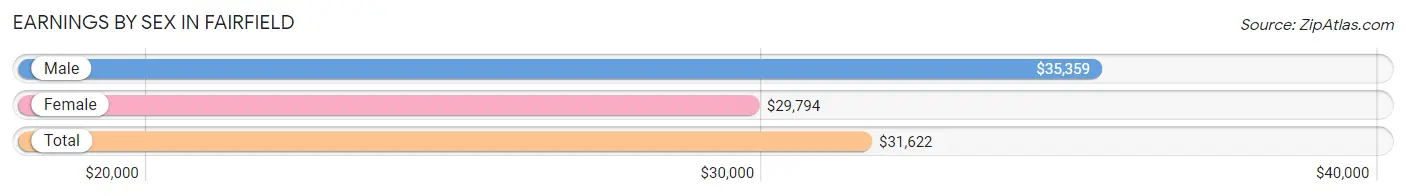
Earnings by Sex in Fairfield
Average Earnings in Fairfield are $31,622, $35,359 for men and $29,794 for women, a difference of 15.7%.
| Sex | Number | Average Earnings |
| Male | 2,191 (48.0%) | $35,359 |
| Female | 2,369 (51.9%) | $29,794 |
| Total | 4,560 (100.0%) | $31,622 |
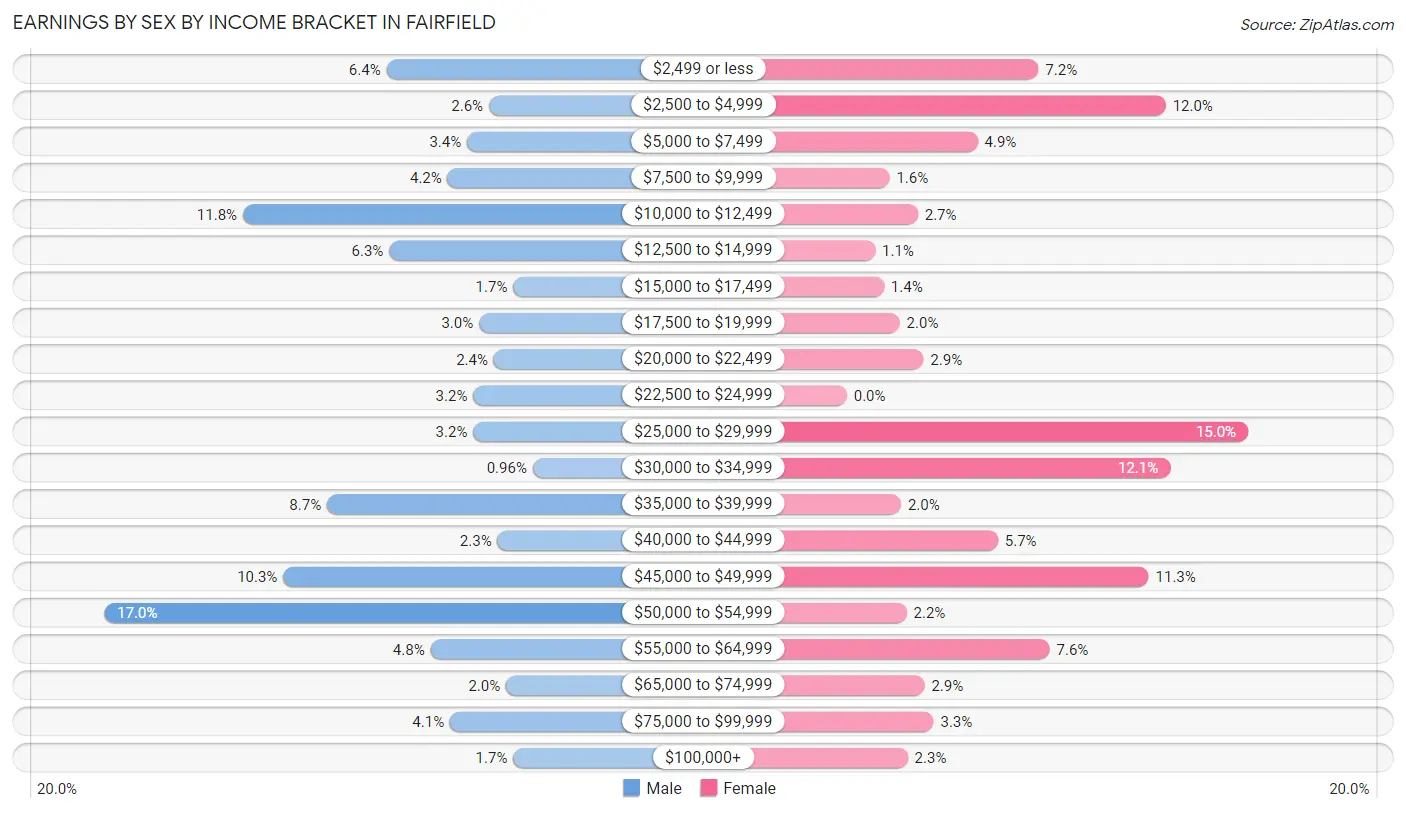
Earnings by Sex by Income Bracket in Fairfield
The most common earnings brackets in Fairfield are $50,000 to $54,999 for men (373 | 17.0%) and $25,000 to $29,999 for women (356 | 15.0%).
| Income | Male | Female |
| $2,499 or less | 141 (6.4%) | 170 (7.2%) |
| $2,500 to $4,999 | 57 (2.6%) | 283 (11.9%) |
| $5,000 to $7,499 | 75 (3.4%) | 116 (4.9%) |
| $7,500 to $9,999 | 91 (4.2%) | 38 (1.6%) |
| $10,000 to $12,499 | 259 (11.8%) | 63 (2.7%) |
| $12,500 to $14,999 | 139 (6.3%) | 25 (1.1%) |
| $15,000 to $17,499 | 37 (1.7%) | 33 (1.4%) |
| $17,500 to $19,999 | 65 (3.0%) | 47 (2.0%) |
| $20,000 to $22,499 | 53 (2.4%) | 68 (2.9%) |
| $22,500 to $24,999 | 70 (3.2%) | 0 (0.0%) |
| $25,000 to $29,999 | 70 (3.2%) | 356 (15.0%) |
| $30,000 to $34,999 | 21 (1.0%) | 287 (12.1%) |
| $35,000 to $39,999 | 190 (8.7%) | 48 (2.0%) |
| $40,000 to $44,999 | 50 (2.3%) | 134 (5.7%) |
| $45,000 to $49,999 | 226 (10.3%) | 268 (11.3%) |
| $50,000 to $54,999 | 373 (17.0%) | 53 (2.2%) |
| $55,000 to $64,999 | 105 (4.8%) | 180 (7.6%) |
| $65,000 to $74,999 | 43 (2.0%) | 69 (2.9%) |
| $75,000 to $99,999 | 89 (4.1%) | 77 (3.3%) |
| $100,000+ | 37 (1.7%) | 54 (2.3%) |
| Total | 2,191 (100.0%) | 2,369 (100.0%) |
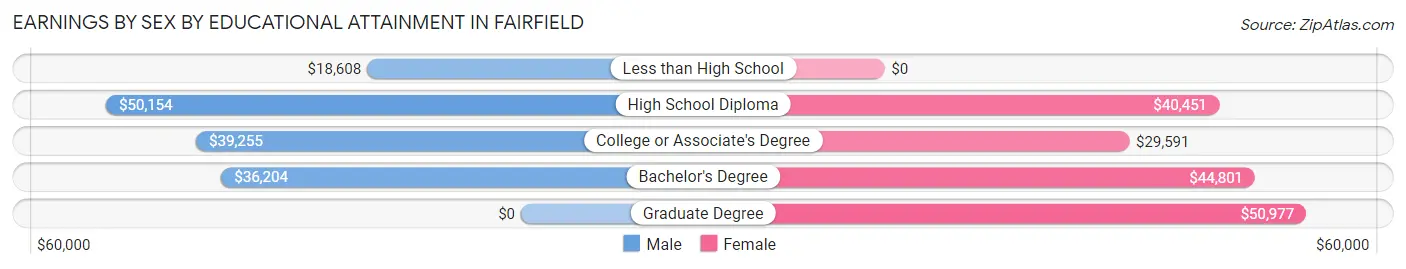
Earnings by Sex by Educational Attainment in Fairfield
Average earnings in Fairfield are $45,679 for men and $33,789 for women, a difference of 26.0%. Men with an educational attainment of high school diploma enjoy the highest average annual earnings of $50,154, while those with less than high school education earn the least with $18,608. Women with an educational attainment of graduate degree earn the most with the average annual earnings of $50,977, while those with college or associate's degree education have the smallest earnings of $29,591.
| Educational Attainment | Male Income | Female Income |
| Less than High School | $18,608 | $0 |
| High School Diploma | $50,154 | $40,451 |
| College or Associate's Degree | $39,255 | $29,591 |
| Bachelor's Degree | $36,204 | $44,801 |
| Graduate Degree | - | - |
| Total | $45,679 | $33,789 |
Family Income in Fairfield
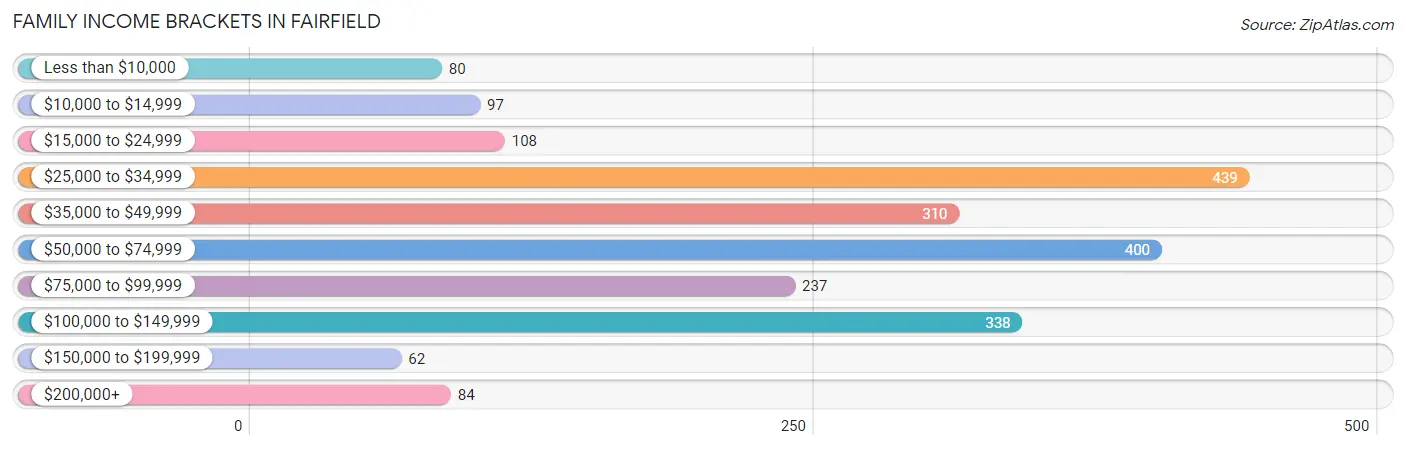
Family Income Brackets in Fairfield
According to the Fairfield family income data, there are 439 families falling into the $25,000 to $34,999 income range, which is the most common income bracket and makes up 20.4% of all families. Conversely, the $150,000 to $199,999 income bracket is the least frequent group with only 62 families (2.9%) belonging to this category.
| Income Bracket | # Families | % Families |
| Less than $10,000 | 80 | 3.7% |
| $10,000 to $14,999 | 97 | 4.5% |
| $15,000 to $24,999 | 108 | 5.0% |
| $25,000 to $34,999 | 439 | 20.4% |
| $35,000 to $49,999 | 310 | 14.4% |
| $50,000 to $74,999 | 400 | 18.6% |
| $75,000 to $99,999 | 237 | 11.0% |
| $100,000 to $149,999 | 338 | 15.7% |
| $150,000 to $199,999 | 62 | 2.9% |
| $200,000+ | 84 | 3.9% |
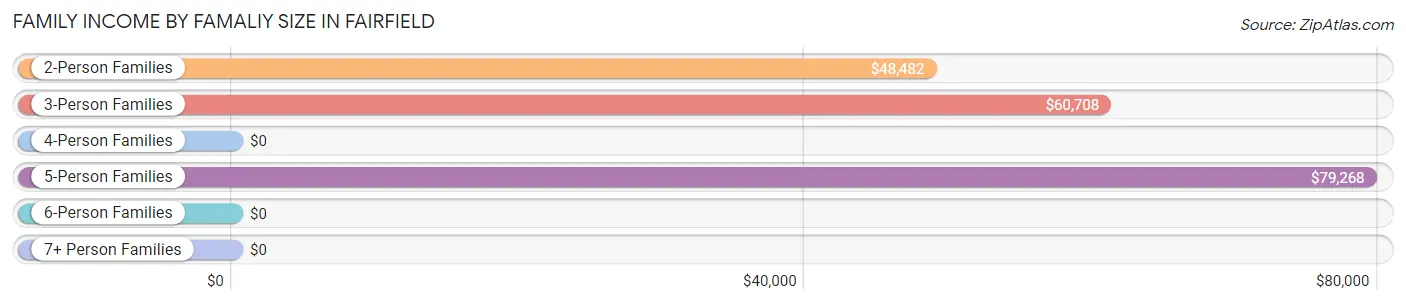
Family Income by Famaliy Size in Fairfield
5-person families (158 | 7.3%) account for the highest median family income in Fairfield with $79,268 per family, while 2-person families (955 | 44.4%) have the highest median income of $24,241 per family member.
| Income Bracket | # Families | Median Income |
| 2-Person Families | 955 (44.4%) | $48,482 |
| 3-Person Families | 643 (29.9%) | $60,708 |
| 4-Person Families | 340 (15.8%) | $0 |
| 5-Person Families | 158 (7.3%) | $79,268 |
| 6-Person Families | 17 (0.8%) | $0 |
| 7+ Person Families | 40 (1.9%) | $0 |
| Total | 2,153 (100.0%) | $54,254 |
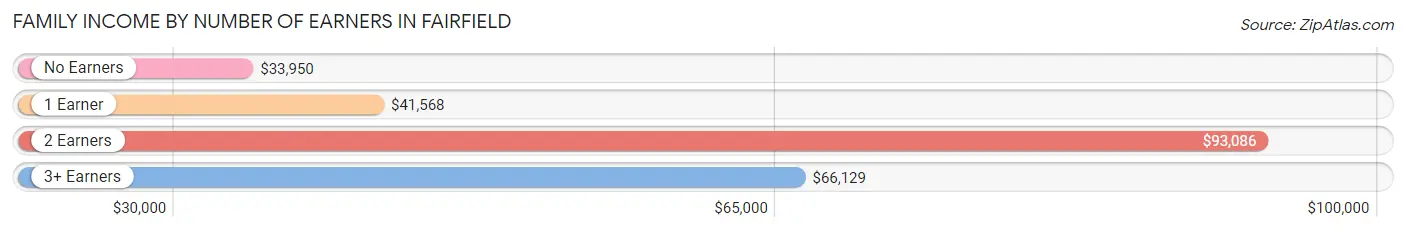
Family Income by Number of Earners in Fairfield
The median family income in Fairfield is $54,254, with families comprising 2 earners (591) having the highest median family income of $93,086, while families with no earners (261) have the lowest median family income of $33,950, accounting for 27.5% and 12.1% of families, respectively.
| Number of Earners | # Families | Median Income |
| No Earners | 261 (12.1%) | $33,950 |
| 1 Earner | 1,175 (54.6%) | $41,568 |
| 2 Earners | 591 (27.5%) | $93,086 |
| 3+ Earners | 126 (5.9%) | $66,129 |
| Total | 2,153 (100.0%) | $54,254 |
Household Income in Fairfield
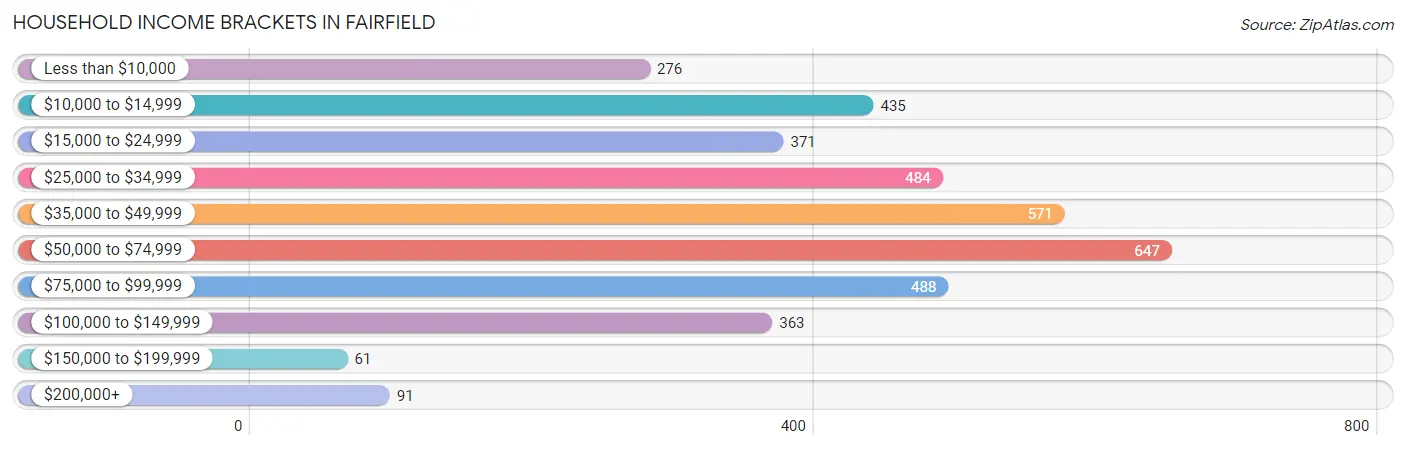
Household Income Brackets in Fairfield
With 647 households falling in the category, the $50,000 to $74,999 income range is the most frequent in Fairfield, accounting for 17.1% of all households. In contrast, only 61 households (1.6%) fall into the $150,000 to $199,999 income bracket, making it the least populous group.
| Income Bracket | # Households | % Households |
| Less than $10,000 | 276 | 7.3% |
| $10,000 to $14,999 | 435 | 11.5% |
| $15,000 to $24,999 | 371 | 9.8% |
| $25,000 to $34,999 | 484 | 12.8% |
| $35,000 to $49,999 | 571 | 15.1% |
| $50,000 to $74,999 | 647 | 17.1% |
| $75,000 to $99,999 | 488 | 12.9% |
| $100,000 to $149,999 | 363 | 9.6% |
| $150,000 to $199,999 | 61 | 1.6% |
| $200,000+ | 91 | 2.4% |
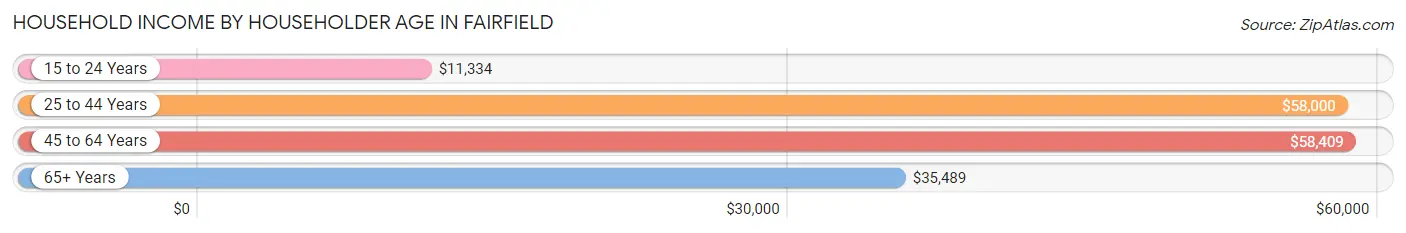
Household Income by Householder Age in Fairfield
The median household income in Fairfield is $45,646, with the highest median household income of $58,409 found in the 45 to 64 years age bracket for the primary householder. A total of 1,410 households (37.3%) fall into this category. Meanwhile, the 15 to 24 years age bracket for the primary householder has the lowest median household income of $11,334, with 256 households (6.8%) in this group.
| Income Bracket | # Households | Median Income |
| 15 to 24 Years | 256 (6.8%) | $11,334 |
| 25 to 44 Years | 998 (26.4%) | $58,000 |
| 45 to 64 Years | 1,410 (37.3%) | $58,409 |
| 65+ Years | 1,119 (29.6%) | $35,489 |
| Total | 3,783 (100.0%) | $45,646 |
Poverty in Fairfield
Income Below Poverty by Sex and Age in Fairfield
With 26.1% poverty level for males and 20.9% for females among the residents of Fairfield, 18 to 24 year old males and 15 year old females are the most vulnerable to poverty, with 309 males (78.6%) and 15 females (100.0%) in their respective age groups living below the poverty level.
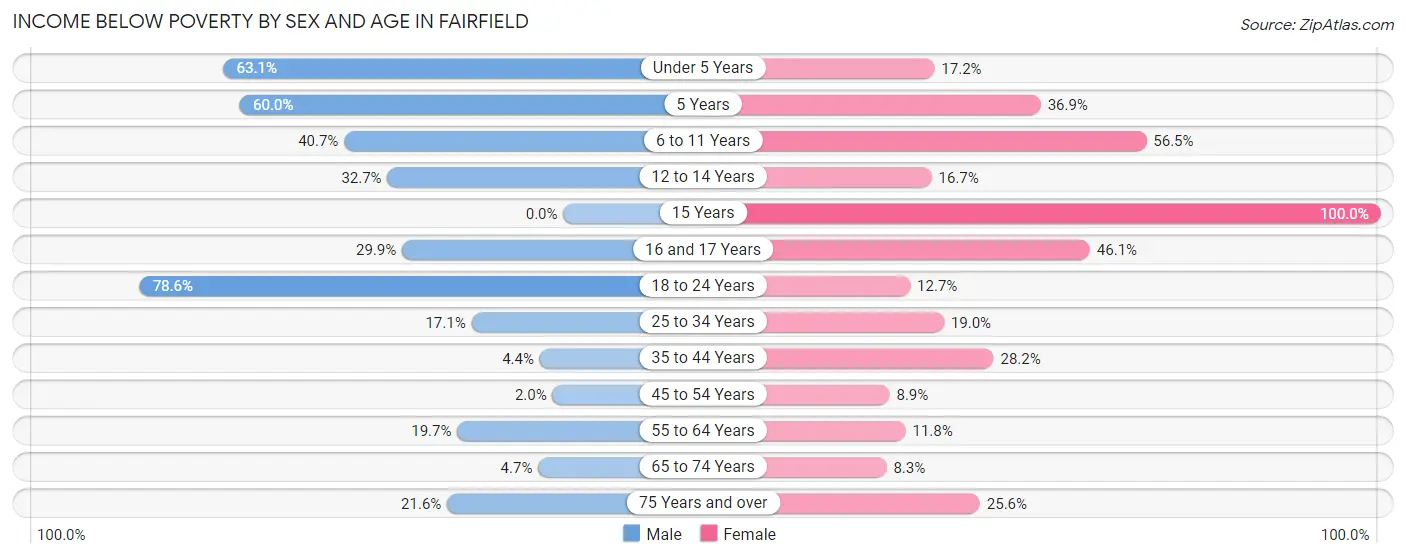
| Age Bracket | Male | Female |
| Under 5 Years | 157 (63.0%) | 60 (17.2%) |
| 5 Years | 30 (60.0%) | 24 (36.9%) |
| 6 to 11 Years | 144 (40.7%) | 303 (56.5%) |
| 12 to 14 Years | 32 (32.7%) | 62 (16.7%) |
| 15 Years | 0 (0.0%) | 15 (100.0%) |
| 16 and 17 Years | 47 (29.9%) | 35 (46.1%) |
| 18 to 24 Years | 309 (78.6%) | 33 (12.7%) |
| 25 to 34 Years | 141 (17.1%) | 149 (19.0%) |
| 35 to 44 Years | 16 (4.4%) | 111 (28.2%) |
| 45 to 54 Years | 7 (2.0%) | 41 (8.9%) |
| 55 to 64 Years | 113 (19.7%) | 98 (11.8%) |
| 65 to 74 Years | 21 (4.7%) | 51 (8.3%) |
| 75 Years and over | 33 (21.6%) | 71 (25.6%) |
| Total | 1,050 (26.1%) | 1,053 (20.9%) |
Income Above Poverty by Sex and Age in Fairfield
According to the poverty statistics in Fairfield, males aged 45 to 54 years and females aged 65 to 74 years are the age groups that are most secure financially, with 98.0% of males and 91.7% of females in these age groups living above the poverty line.
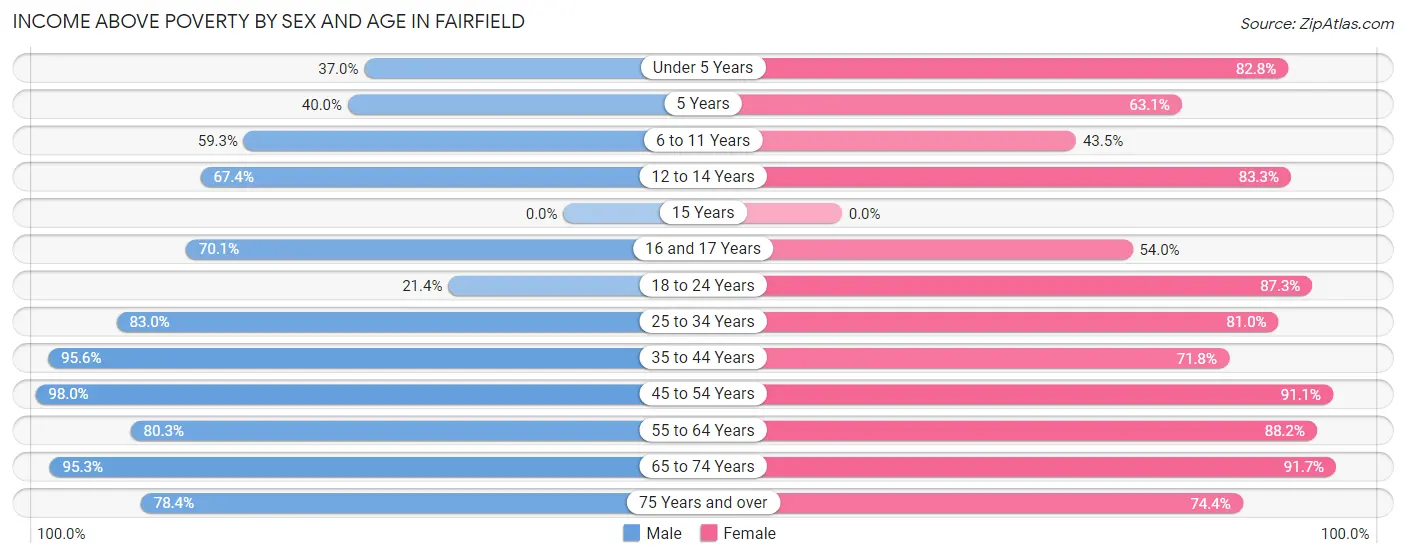
| Age Bracket | Male | Female |
| Under 5 Years | 92 (36.9%) | 289 (82.8%) |
| 5 Years | 20 (40.0%) | 41 (63.1%) |
| 6 to 11 Years | 210 (59.3%) | 233 (43.5%) |
| 12 to 14 Years | 66 (67.3%) | 310 (83.3%) |
| 15 Years | 0 (0.0%) | 0 (0.0%) |
| 16 and 17 Years | 110 (70.1%) | 41 (53.9%) |
| 18 to 24 Years | 84 (21.4%) | 227 (87.3%) |
| 25 to 34 Years | 686 (83.0%) | 637 (81.0%) |
| 35 to 44 Years | 350 (95.6%) | 283 (71.8%) |
| 45 to 54 Years | 341 (98.0%) | 422 (91.1%) |
| 55 to 64 Years | 461 (80.3%) | 730 (88.2%) |
| 65 to 74 Years | 430 (95.3%) | 564 (91.7%) |
| 75 Years and over | 120 (78.4%) | 206 (74.4%) |
| Total | 2,970 (73.9%) | 3,983 (79.1%) |
Income Below Poverty Among Married-Couple Families in Fairfield
The poverty statistics for married-couple families in Fairfield show that 2.4% or 22 of the total 930 families live below the poverty line. Families with no children have the highest poverty rate of 3.2%, comprising of 22 families. On the other hand, families with 1 or 2 children have the lowest poverty rate of 0.0%, which includes 0 families.
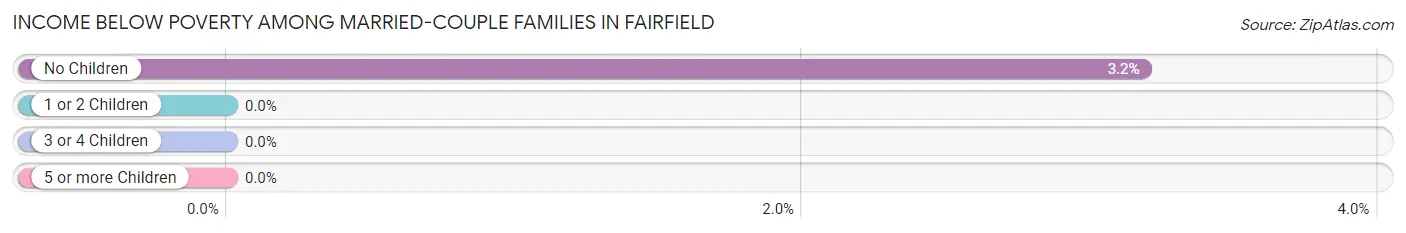
| Children | Above Poverty | Below Poverty |
| No Children | 669 (96.8%) | 22 (3.2%) |
| 1 or 2 Children | 181 (100.0%) | 0 (0.0%) |
| 3 or 4 Children | 58 (100.0%) | 0 (0.0%) |
| 5 or more Children | 0 (0.0%) | 0 (0.0%) |
| Total | 908 (97.6%) | 22 (2.4%) |
Income Below Poverty Among Single-Parent Households in Fairfield
According to the poverty data in Fairfield, 40.6% or 110 single-father households and 22.9% or 218 single-mother households are living below the poverty line. Among single-father households, those with 3 or 4 children have the highest poverty rate, with 54 households (56.2%) experiencing poverty. Likewise, among single-mother households, those with 5 or more children have the highest poverty rate, with 14 households (100.0%) falling below the poverty line.
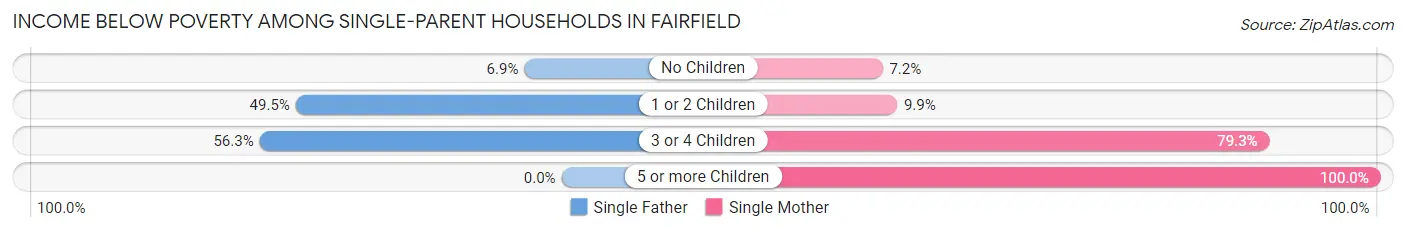
| Children | Single Father | Single Mother |
| No Children | 5 (6.9%) | 17 (7.2%) |
| 1 or 2 Children | 51 (49.5%) | 53 (9.9%) |
| 3 or 4 Children | 54 (56.2%) | 134 (79.3%) |
| 5 or more Children | 0 (0.0%) | 14 (100.0%) |
| Total | 110 (40.6%) | 218 (22.9%) |
Income Below Poverty Among Married-Couple vs Single-Parent Households in Fairfield
The poverty data for Fairfield shows that 22 of the married-couple family households (2.4%) and 328 of the single-parent households (26.8%) are living below the poverty level. Within the married-couple family households, those with no children have the highest poverty rate, with 22 households (3.2%) falling below the poverty line. Among the single-parent households, those with 5 or more children have the highest poverty rate, with 14 household (100.0%) living below poverty.
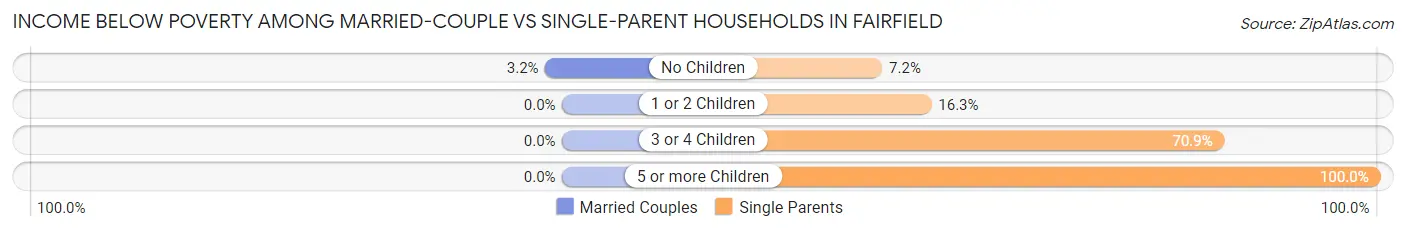
| Children | Married-Couple Families | Single-Parent Households |
| No Children | 22 (3.2%) | 22 (7.2%) |
| 1 or 2 Children | 0 (0.0%) | 104 (16.3%) |
| 3 or 4 Children | 0 (0.0%) | 188 (70.9%) |
| 5 or more Children | 0 (0.0%) | 14 (100.0%) |
| Total | 22 (2.4%) | 328 (26.8%) |
Race in Fairfield
The most populous races in Fairfield are Black / African American (9,233 | 92.6%), White / Caucasian (523 | 5.2%), and Two or more Races (194 | 1.9%).
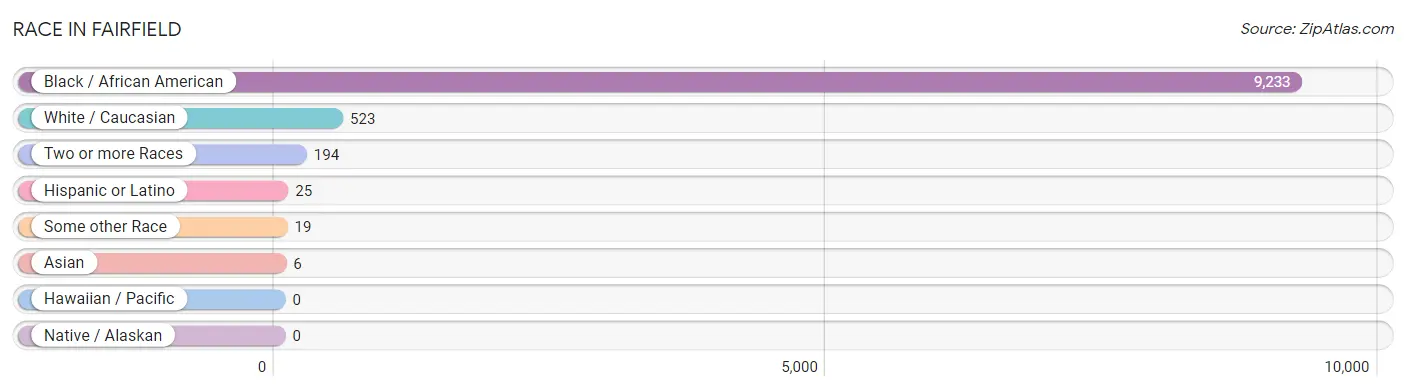
| Race | # Population | % Population |
| Asian | 6 | 0.1% |
| Black / African American | 9,233 | 92.6% |
| Hawaiian / Pacific | 0 | 0.0% |
| Hispanic or Latino | 25 | 0.3% |
| Native / Alaskan | 0 | 0.0% |
| White / Caucasian | 523 | 5.2% |
| Two or more Races | 194 | 1.9% |
| Some other Race | 19 | 0.2% |
| Total | 9,975 | 100.0% |
Ancestry in Fairfield
The most populous ancestries reported in Fairfield are American (1,106 | 11.1%), Subsaharan African (501 | 5.0%), African (462 | 4.6%), English (105 | 1.1%), and German (57 | 0.6%), together accounting for 22.4% of all Fairfield residents.
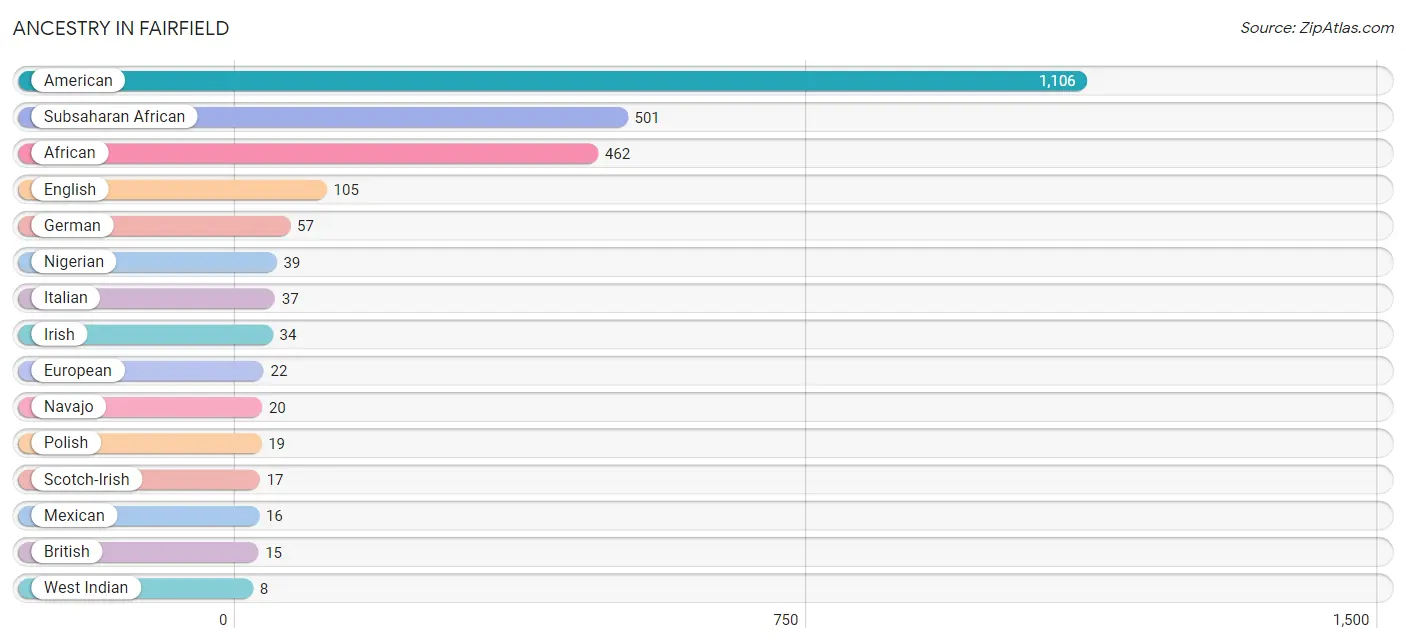
| Ancestry | # Population | % Population |
| African | 462 | 4.6% |
| American | 1,106 | 11.1% |
| British | 15 | 0.2% |
| English | 105 | 1.1% |
| European | 22 | 0.2% |
| German | 57 | 0.6% |
| Indian (Asian) | 6 | 0.1% |
| Irish | 34 | 0.3% |
| Italian | 37 | 0.4% |
| Mexican | 16 | 0.2% |
| Navajo | 20 | 0.2% |
| Nigerian | 39 | 0.4% |
| Polish | 19 | 0.2% |
| Scotch-Irish | 17 | 0.2% |
| Subsaharan African | 501 | 5.0% |
| West Indian | 8 | 0.1% | View All 16 Rows |
Immigrants in Fairfield
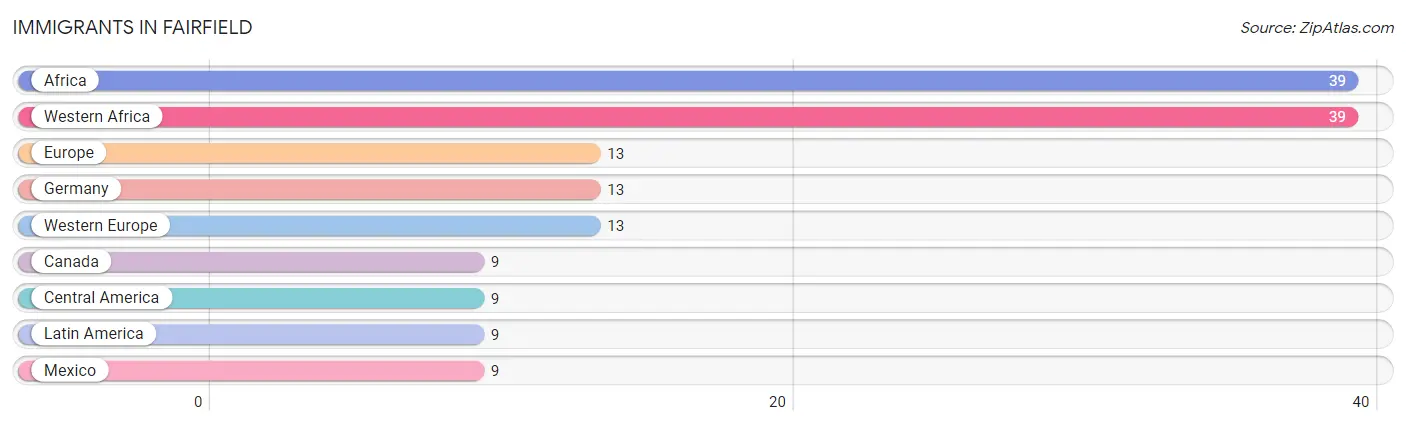
The most numerous immigrant groups reported in Fairfield came from Africa (39 | 0.4%), Western Africa (39 | 0.4%), Europe (13 | 0.1%), Germany (13 | 0.1%), and Western Europe (13 | 0.1%), together accounting for 1.2% of all Fairfield residents.
| Immigration Origin | # Population | % Population |
| Africa | 39 | 0.4% |
| Canada | 9 | 0.1% |
| Central America | 9 | 0.1% |
| Europe | 13 | 0.1% |
| Germany | 13 | 0.1% |
| Latin America | 9 | 0.1% |
| Mexico | 9 | 0.1% |
| Western Africa | 39 | 0.4% |
| Western Europe | 13 | 0.1% | View All 9 Rows |
Sex and Age in Fairfield
Sex and Age in Fairfield
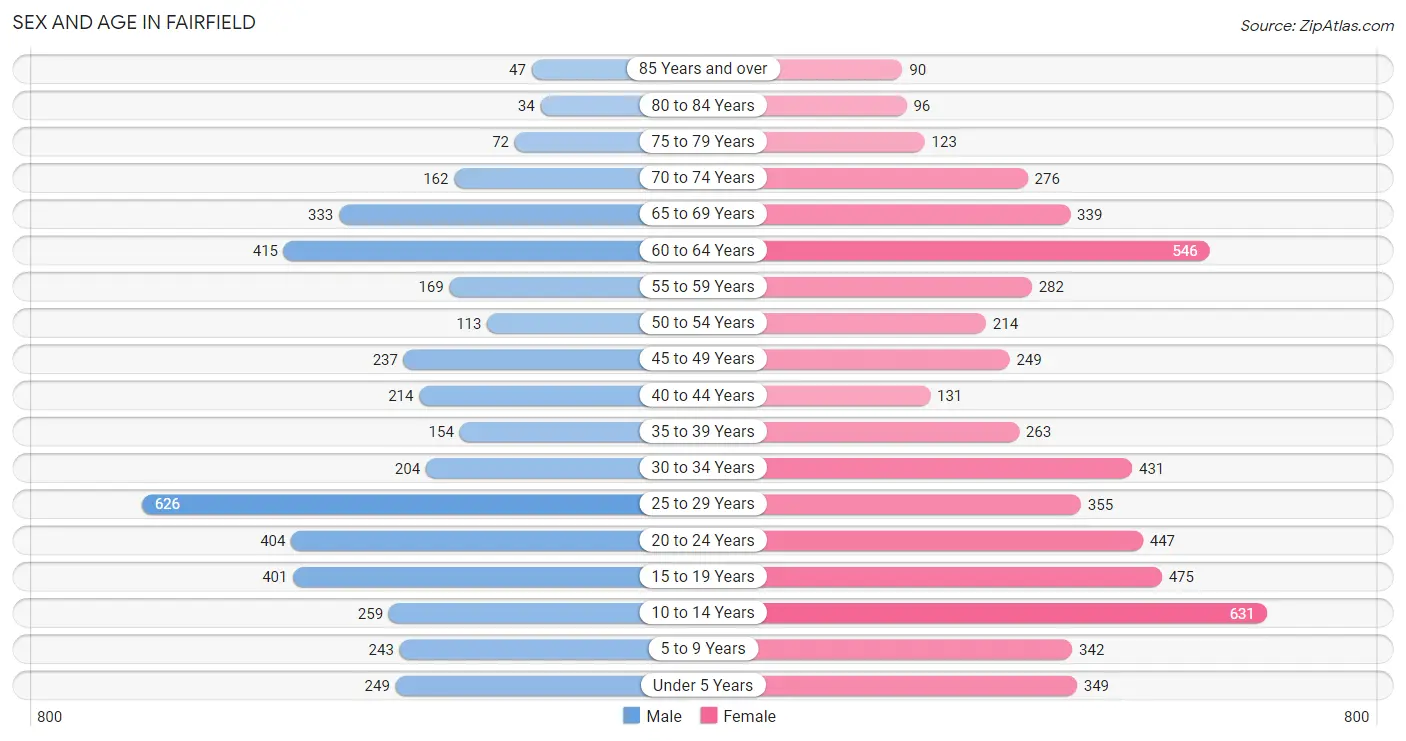
The most populous age groups in Fairfield are 25 to 29 Years (626 | 14.4%) for men and 10 to 14 Years (631 | 11.2%) for women.
| Age Bracket | Male | Female |
| Under 5 Years | 249 (5.7%) | 349 (6.2%) |
| 5 to 9 Years | 243 (5.6%) | 342 (6.1%) |
| 10 to 14 Years | 259 (6.0%) | 631 (11.2%) |
| 15 to 19 Years | 401 (9.2%) | 475 (8.4%) |
| 20 to 24 Years | 404 (9.3%) | 447 (7.9%) |
| 25 to 29 Years | 626 (14.4%) | 355 (6.3%) |
| 30 to 34 Years | 204 (4.7%) | 431 (7.6%) |
| 35 to 39 Years | 154 (3.5%) | 263 (4.7%) |
| 40 to 44 Years | 214 (4.9%) | 131 (2.3%) |
| 45 to 49 Years | 237 (5.5%) | 249 (4.4%) |
| 50 to 54 Years | 113 (2.6%) | 214 (3.8%) |
| 55 to 59 Years | 169 (3.9%) | 282 (5.0%) |
| 60 to 64 Years | 415 (9.6%) | 546 (9.7%) |
| 65 to 69 Years | 333 (7.7%) | 339 (6.0%) |
| 70 to 74 Years | 162 (3.7%) | 276 (4.9%) |
| 75 to 79 Years | 72 (1.7%) | 123 (2.2%) |
| 80 to 84 Years | 34 (0.8%) | 96 (1.7%) |
| 85 Years and over | 47 (1.1%) | 90 (1.6%) |
| Total | 4,336 (100.0%) | 5,639 (100.0%) |
Families and Households in Fairfield
Median Family Size in Fairfield
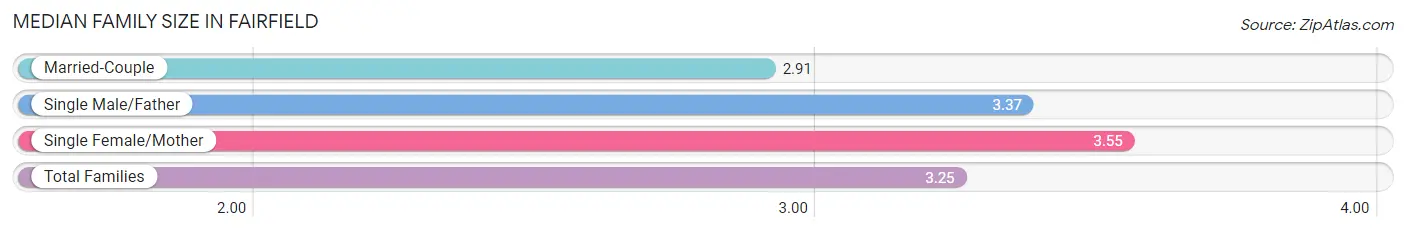
The median family size in Fairfield is 3.25 persons per family, with single female/mother families (952 | 44.2%) accounting for the largest median family size of 3.55 persons per family. On the other hand, married-couple families (930 | 43.2%) represent the smallest median family size with 2.91 persons per family.
| Family Type | # Families | Family Size |
| Married-Couple | 930 (43.2%) | 2.91 |
| Single Male/Father | 271 (12.6%) | 3.37 |
| Single Female/Mother | 952 (44.2%) | 3.55 |
| Total Families | 2,153 (100.0%) | 3.25 |
Median Household Size in Fairfield
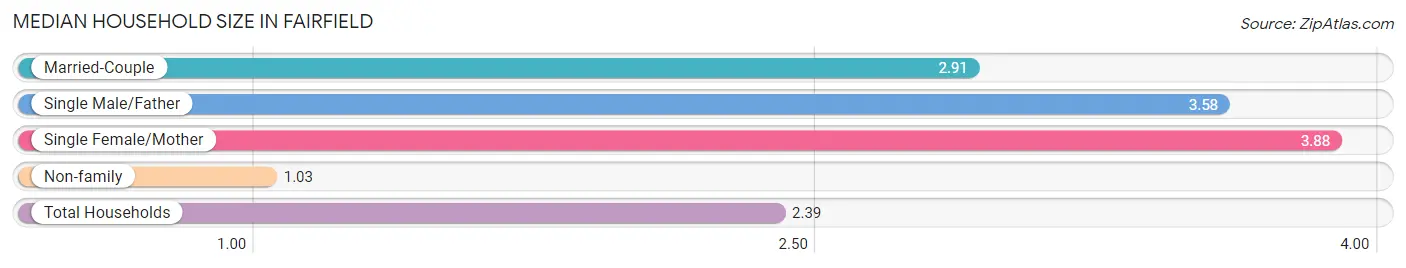
The median household size in Fairfield is 2.39 persons per household, with single female/mother households (952 | 25.2%) accounting for the largest median household size of 3.88 persons per household. non-family households (1,630 | 43.1%) represent the smallest median household size with 1.03 persons per household.
| Household Type | # Households | Household Size |
| Married-Couple | 930 (24.6%) | 2.91 |
| Single Male/Father | 271 (7.2%) | 3.58 |
| Single Female/Mother | 952 (25.2%) | 3.88 |
| Non-family | 1,630 (43.1%) | 1.03 |
| Total Households | 3,783 (100.0%) | 2.39 |
Household Size by Marriage Status in Fairfield
Out of a total of 3,783 households in Fairfield, 2,153 (56.9%) are family households, while 1,630 (43.1%) are nonfamily households. The most numerous type of family households are 3-person households, comprising 789, and the most common type of nonfamily households are 1-person households, comprising 1,596.
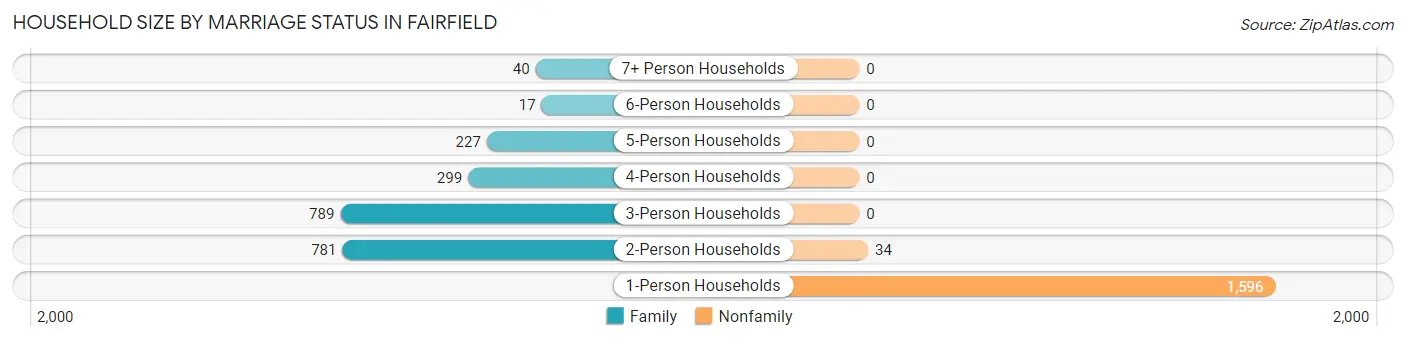
| Household Size | Family Households | Nonfamily Households |
| 1-Person Households | - | 1,596 (42.2%) |
| 2-Person Households | 781 (20.6%) | 34 (0.9%) |
| 3-Person Households | 789 (20.9%) | 0 (0.0%) |
| 4-Person Households | 299 (7.9%) | 0 (0.0%) |
| 5-Person Households | 227 (6.0%) | 0 (0.0%) |
| 6-Person Households | 17 (0.4%) | 0 (0.0%) |
| 7+ Person Households | 40 (1.1%) | 0 (0.0%) |
| Total | 2,153 (56.9%) | 1,630 (43.1%) |
Female Fertility in Fairfield
Fertility by Age in Fairfield
Average fertility rate in Fairfield is 63.0 births per 1,000 women. Women in the age bracket of 20 to 34 years have the highest fertility rate with 109.0 births per 1,000 women. Women in the age bracket of 20 to 34 years acount for 89.9% of all women with births.
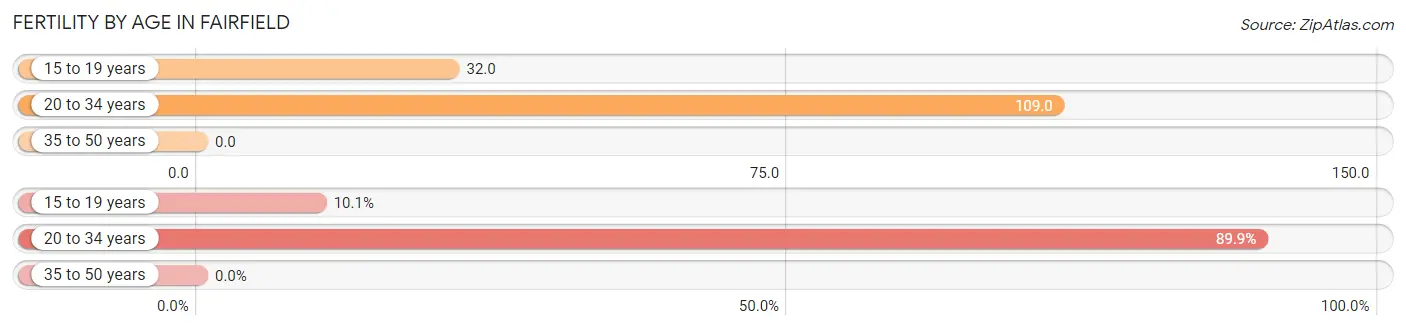
| Age Bracket | Women with Births | Births / 1,000 Women |
| 15 to 19 years | 15 (10.1%) | 32.0 |
| 20 to 34 years | 134 (89.9%) | 109.0 |
| 35 to 50 years | 0 (0.0%) | 0.0 |
| Total | 149 (100.0%) | 63.0 |
Fertility by Age by Marriage Status in Fairfield
31.5% of women with births (149) in Fairfield are married. The highest percentage of unmarried women with births falls into 20 to 34 years age bracket with 76.1% of them unmarried at the time of birth, while the lowest percentage of unmarried women with births belong to 15 to 19 years age bracket with 0.0% of them unmarried.
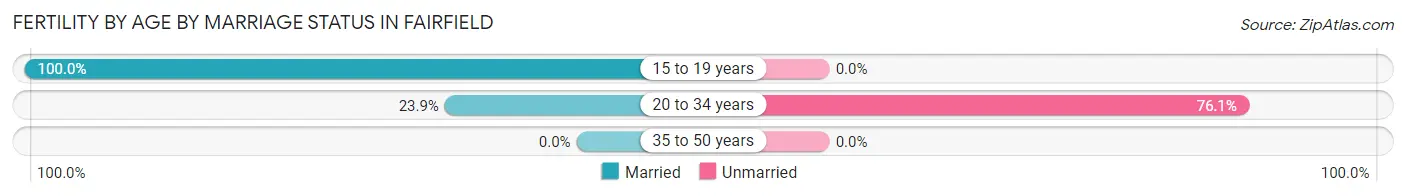
| Age Bracket | Married | Unmarried |
| 15 to 19 years | 15 (100.0%) | 0 (0.0%) |
| 20 to 34 years | 32 (23.9%) | 102 (76.1%) |
| 35 to 50 years | 0 (0.0%) | 0 (0.0%) |
| Total | 47 (31.5%) | 102 (68.5%) |
Fertility by Education in Fairfield
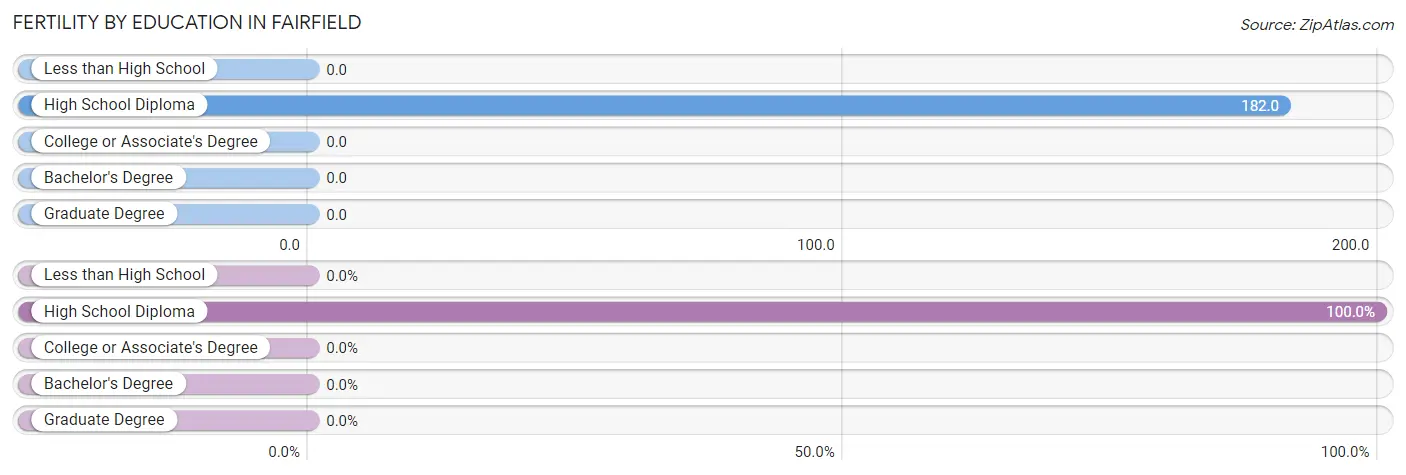
| Educational Attainment | Women with Births | Births / 1,000 Women |
| Less than High School | 0 (0.0%) | 0.0 |
| High School Diploma | 149 (100.0%) | 182.0 |
| College or Associate's Degree | 0 (0.0%) | 0.0 |
| Bachelor's Degree | 0 (0.0%) | 0.0 |
| Graduate Degree | 0 (0.0%) | 0.0 |
| Total | 149 (100.0%) | 63.0 |
Fertility by Education by Marriage Status in Fairfield
68.5% of women with births in Fairfield are unmarried. Women with the educational attainment of high school diploma are most likely to be married with 31.5% of them married at childbirth, while women with the educational attainment of high school diploma are least likely to be married with 68.5% of them unmarried at childbirth.
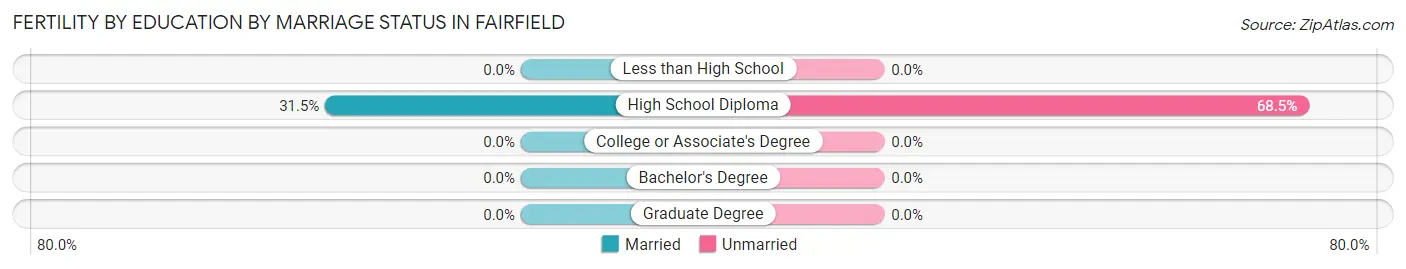
| Educational Attainment | Married | Unmarried |
| Less than High School | 0 (0.0%) | 0 (0.0%) |
| High School Diploma | 47 (31.5%) | 102 (68.5%) |
| College or Associate's Degree | 0 (0.0%) | 0 (0.0%) |
| Bachelor's Degree | 0 (0.0%) | 0 (0.0%) |
| Graduate Degree | 0 (0.0%) | 0 (0.0%) |
| Total | 47 (31.5%) | 102 (68.5%) |
Employment Characteristics in Fairfield
Employment by Class of Employer in Fairfield
Among the 3,800 employed individuals in Fairfield, private company employees (2,370 | 62.4%), not-for-profit organizations (315 | 8.3%), and state government employees (309 | 8.1%) make up the most common classes of employment.
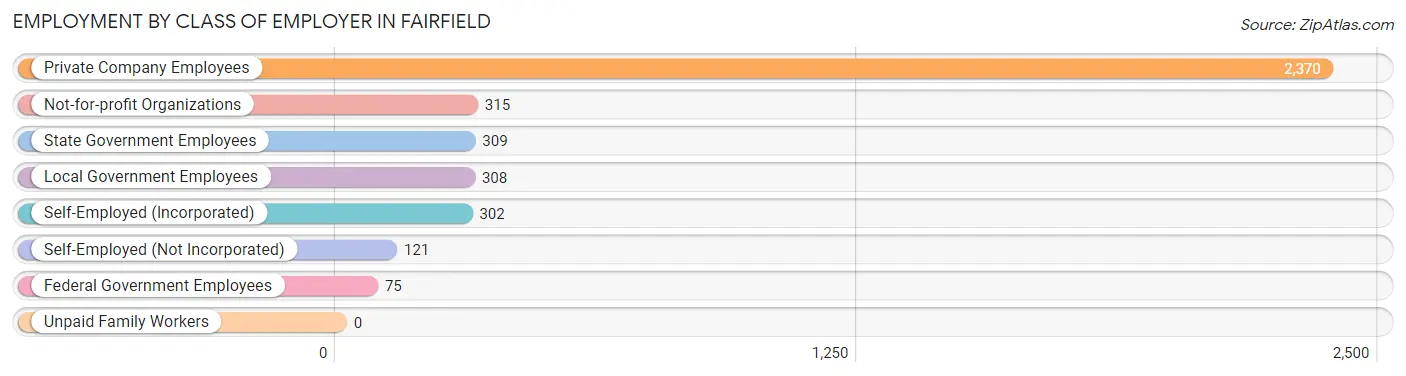
| Employer Class | # Employees | % Employees |
| Private Company Employees | 2,370 | 62.4% |
| Self-Employed (Incorporated) | 302 | 8.0% |
| Self-Employed (Not Incorporated) | 121 | 3.2% |
| Not-for-profit Organizations | 315 | 8.3% |
| Local Government Employees | 308 | 8.1% |
| State Government Employees | 309 | 8.1% |
| Federal Government Employees | 75 | 2.0% |
| Unpaid Family Workers | 0 | 0.0% |
| Total | 3,800 | 100.0% |
Employment Status by Age in Fairfield
According to the labor force statistics for Fairfield, out of the total population over 16 years of age (7,887), 54.6% or 4,306 individuals are in the labor force, with 8.3% or 357 of them unemployed. The age group with the highest labor force participation rate is 30 to 34 years, with 100.0% or 635 individuals in the labor force. Within the labor force, the 75 years and over age range has the highest percentage of unemployed individuals, with 41.2% or 7 of them being unemployed.
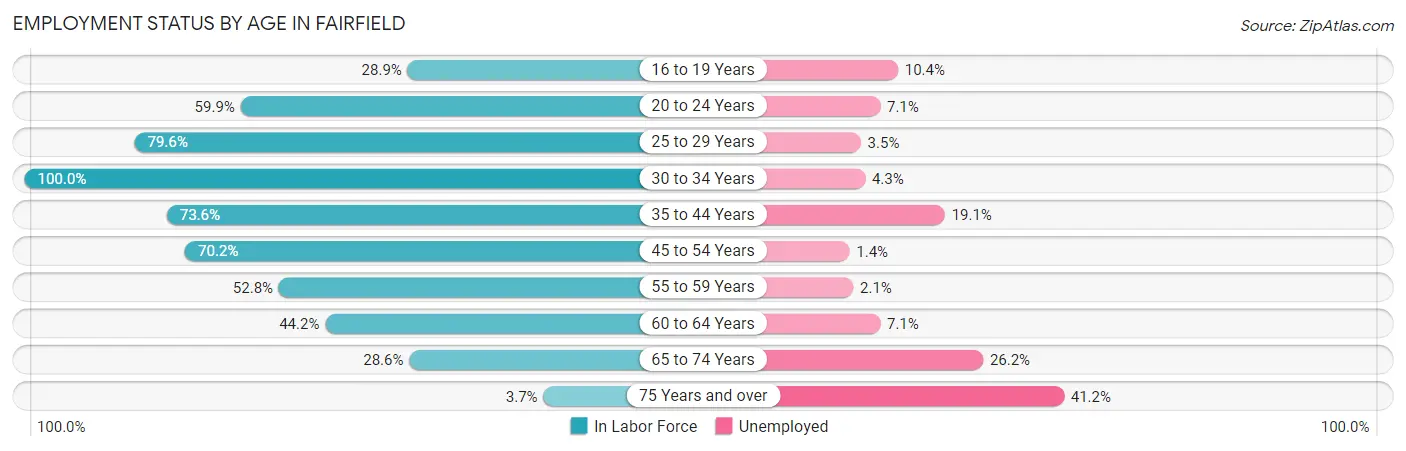
| Age Bracket | In Labor Force | Unemployed |
| 16 to 19 Years | 249 (28.9%) | 26 (10.4%) |
| 20 to 24 Years | 510 (59.9%) | 36 (7.1%) |
| 25 to 29 Years | 781 (79.6%) | 27 (3.5%) |
| 30 to 34 Years | 635 (100.0%) | 27 (4.3%) |
| 35 to 44 Years | 561 (73.6%) | 107 (19.1%) |
| 45 to 54 Years | 571 (70.2%) | 8 (1.4%) |
| 55 to 59 Years | 238 (52.8%) | 5 (2.1%) |
| 60 to 64 Years | 425 (44.2%) | 30 (7.1%) |
| 65 to 74 Years | 317 (28.6%) | 83 (26.2%) |
| 75 Years and over | 17 (3.7%) | 7 (41.2%) |
| Total | 4,306 (54.6%) | 357 (8.3%) |
Employment Status by Educational Attainment in Fairfield
According to labor force statistics for Fairfield, 69.8% of individuals (3,213) out of the total population between 25 and 64 years of age (4,603) are in the labor force, with 6.4% or 206 of them being unemployed. The group with the highest labor force participation rate are those with the educational attainment of college / associate degree, with 78.3% or 1,005 individuals in the labor force. Within the labor force, individuals with high school diploma education have the highest percentage of unemployment, with 9.1% or 129 of them being unemployed.
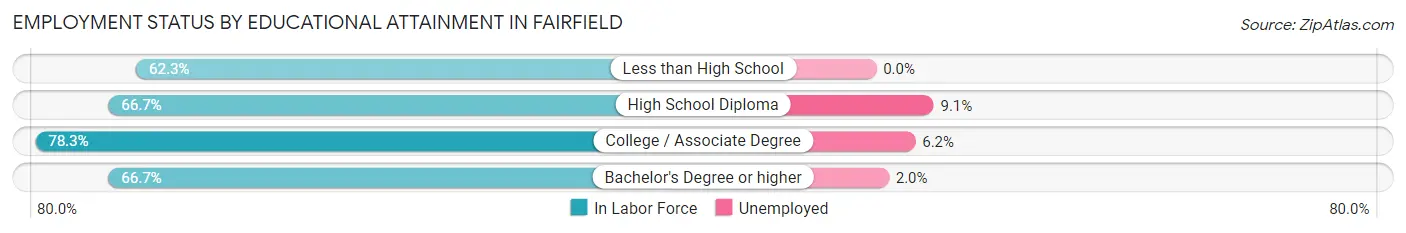
| Educational Attainment | In Labor Force | Unemployed |
| Less than High School | 139 (62.3%) | 0 (0.0%) |
| High School Diploma | 1,420 (66.7%) | 194 (9.1%) |
| College / Associate Degree | 1,005 (78.3%) | 80 (6.2%) |
| Bachelor's Degree or higher | 646 (66.7%) | 19 (2.0%) |
| Total | 3,213 (69.8%) | 295 (6.4%) |
Employment Occupations by Sex in Fairfield
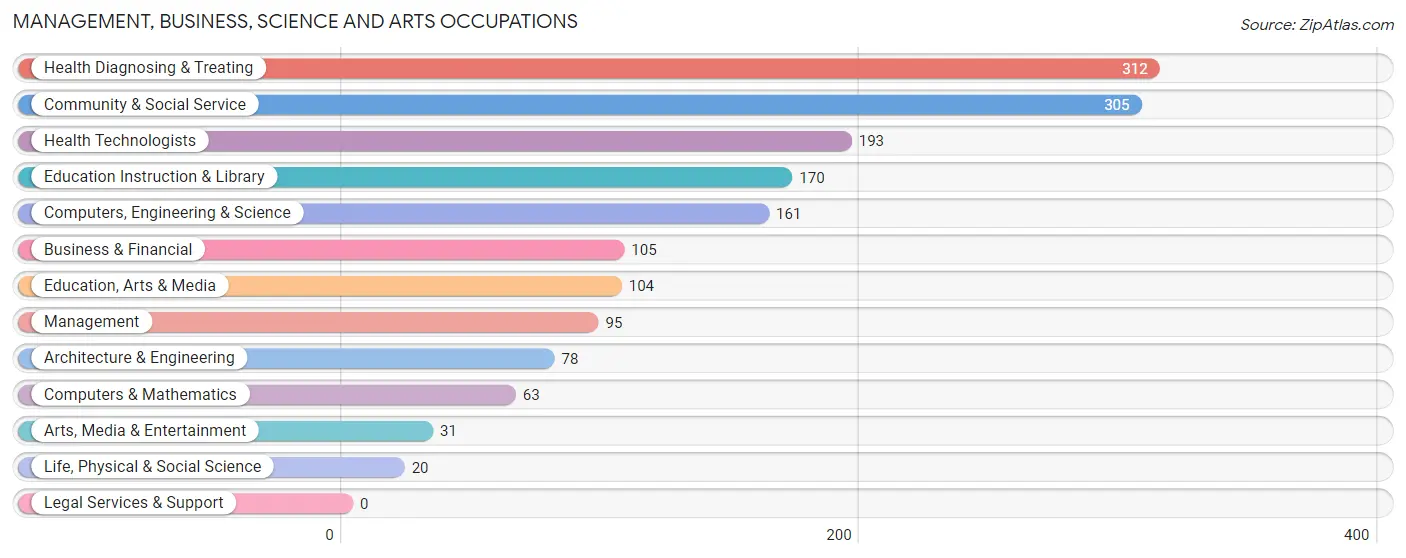
Management, Business, Science and Arts Occupations
The most common Management, Business, Science and Arts occupations in Fairfield are Health Diagnosing & Treating (312 | 7.9%), Community & Social Service (305 | 7.7%), Health Technologists (193 | 4.9%), Education Instruction & Library (170 | 4.3%), and Computers, Engineering & Science (161 | 4.1%).
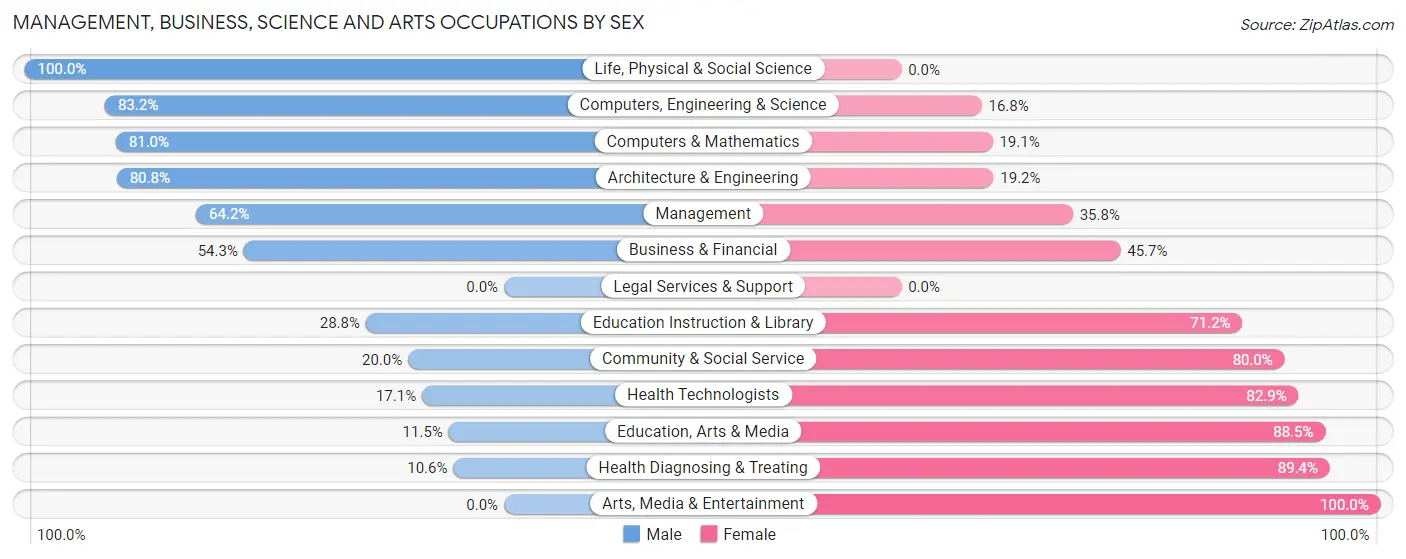
Management, Business, Science and Arts Occupations by Sex
Within the Management, Business, Science and Arts occupations in Fairfield, the most male-oriented occupations are Life, Physical & Social Science (100.0%), Computers, Engineering & Science (83.2%), and Computers & Mathematics (80.9%), while the most female-oriented occupations are Arts, Media & Entertainment (100.0%), Health Diagnosing & Treating (89.4%), and Education, Arts & Media (88.5%).
| Occupation | Male | Female |
| Management | 61 (64.2%) | 34 (35.8%) |
| Business & Financial | 57 (54.3%) | 48 (45.7%) |
| Computers, Engineering & Science | 134 (83.2%) | 27 (16.8%) |
| Computers & Mathematics | 51 (80.9%) | 12 (19.1%) |
| Architecture & Engineering | 63 (80.8%) | 15 (19.2%) |
| Life, Physical & Social Science | 20 (100.0%) | 0 (0.0%) |
| Community & Social Service | 61 (20.0%) | 244 (80.0%) |
| Education, Arts & Media | 12 (11.5%) | 92 (88.5%) |
| Legal Services & Support | 0 (0.0%) | 0 (0.0%) |
| Education Instruction & Library | 49 (28.8%) | 121 (71.2%) |
| Arts, Media & Entertainment | 0 (0.0%) | 31 (100.0%) |
| Health Diagnosing & Treating | 33 (10.6%) | 279 (89.4%) |
| Health Technologists | 33 (17.1%) | 160 (82.9%) |
| Total (Category) | 346 (35.4%) | 632 (64.6%) |
| Total (Overall) | 1,911 (48.4%) | 2,037 (51.6%) |
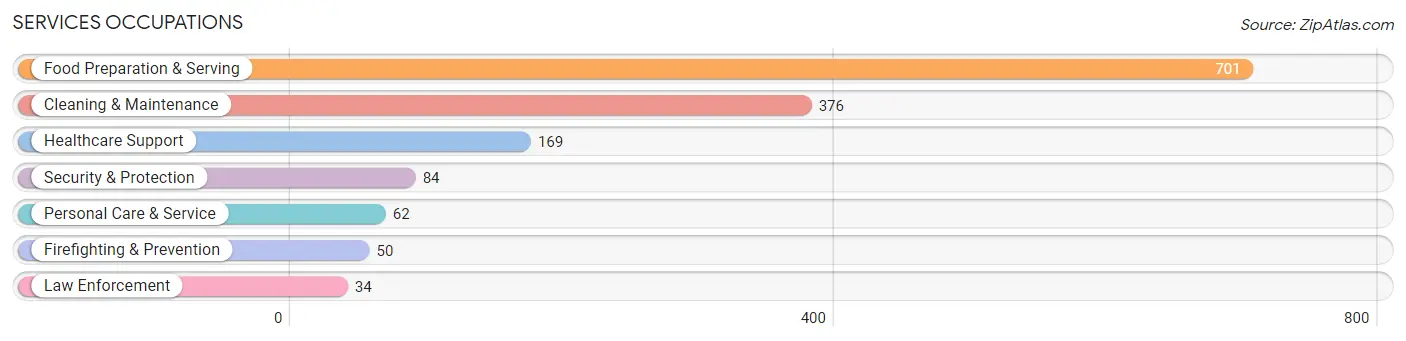
Services Occupations
The most common Services occupations in Fairfield are Food Preparation & Serving (701 | 17.8%), Cleaning & Maintenance (376 | 9.5%), Healthcare Support (169 | 4.3%), Security & Protection (84 | 2.1%), and Personal Care & Service (62 | 1.6%).
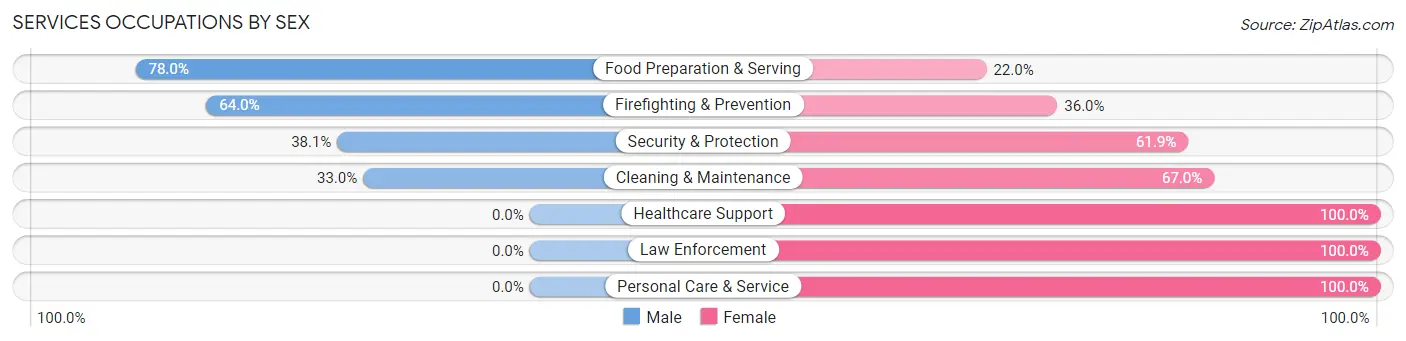
Services Occupations by Sex
Within the Services occupations in Fairfield, the most male-oriented occupations are Food Preparation & Serving (78.0%), Firefighting & Prevention (64.0%), and Security & Protection (38.1%), while the most female-oriented occupations are Healthcare Support (100.0%), Law Enforcement (100.0%), and Personal Care & Service (100.0%).
| Occupation | Male | Female |
| Healthcare Support | 0 (0.0%) | 169 (100.0%) |
| Security & Protection | 32 (38.1%) | 52 (61.9%) |
| Firefighting & Prevention | 32 (64.0%) | 18 (36.0%) |
| Law Enforcement | 0 (0.0%) | 34 (100.0%) |
| Food Preparation & Serving | 547 (78.0%) | 154 (22.0%) |
| Cleaning & Maintenance | 124 (33.0%) | 252 (67.0%) |
| Personal Care & Service | 0 (0.0%) | 62 (100.0%) |
| Total (Category) | 703 (50.5%) | 689 (49.5%) |
| Total (Overall) | 1,911 (48.4%) | 2,037 (51.6%) |
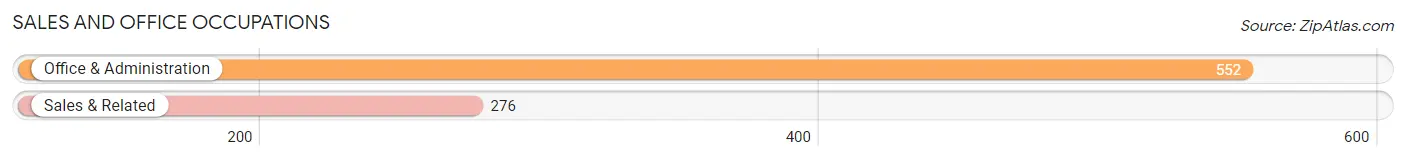
Sales and Office Occupations
The most common Sales and Office occupations in Fairfield are Office & Administration (552 | 14.0%), and Sales & Related (276 | 7.0%).
Sales and Office Occupations by Sex
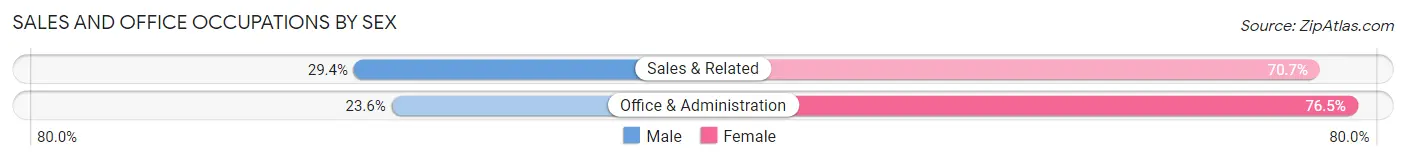
| Occupation | Male | Female |
| Sales & Related | 81 (29.3%) | 195 (70.7%) |
| Office & Administration | 130 (23.5%) | 422 (76.4%) |
| Total (Category) | 211 (25.5%) | 617 (74.5%) |
| Total (Overall) | 1,911 (48.4%) | 2,037 (51.6%) |
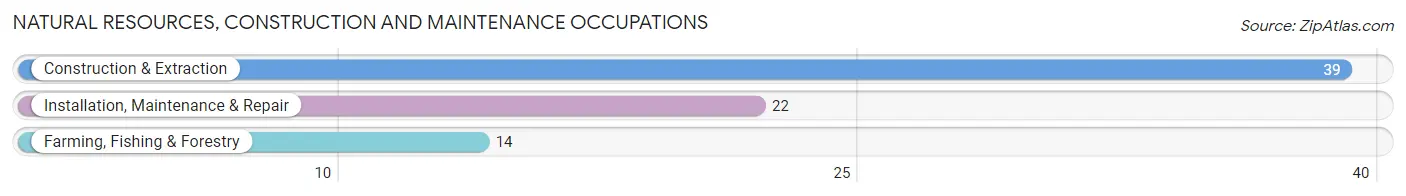
Natural Resources, Construction and Maintenance Occupations
The most common Natural Resources, Construction and Maintenance occupations in Fairfield are Construction & Extraction (39 | 1.0%), Installation, Maintenance & Repair (22 | 0.6%), and Farming, Fishing & Forestry (14 | 0.4%).
Natural Resources, Construction and Maintenance Occupations by Sex
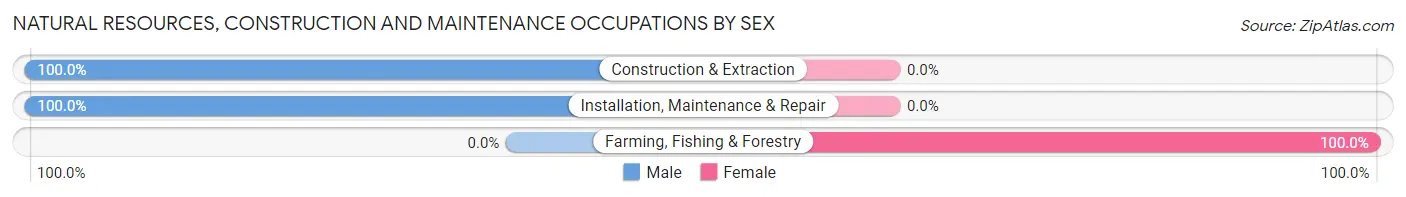
| Occupation | Male | Female |
| Farming, Fishing & Forestry | 0 (0.0%) | 14 (100.0%) |
| Construction & Extraction | 39 (100.0%) | 0 (0.0%) |
| Installation, Maintenance & Repair | 22 (100.0%) | 0 (0.0%) |
| Total (Category) | 61 (81.3%) | 14 (18.7%) |
| Total (Overall) | 1,911 (48.4%) | 2,037 (51.6%) |
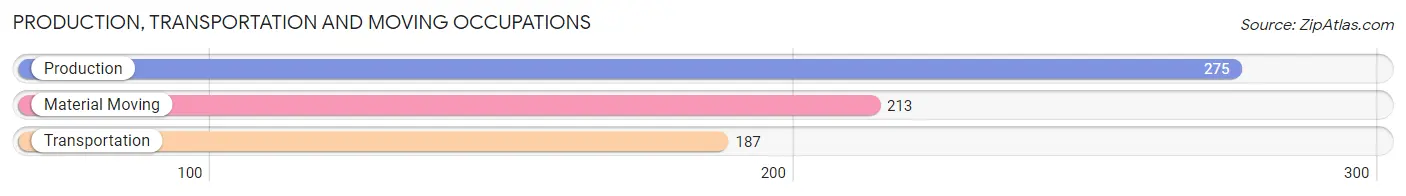
Production, Transportation and Moving Occupations
The most common Production, Transportation and Moving occupations in Fairfield are Production (275 | 7.0%), Material Moving (213 | 5.4%), and Transportation (187 | 4.7%).
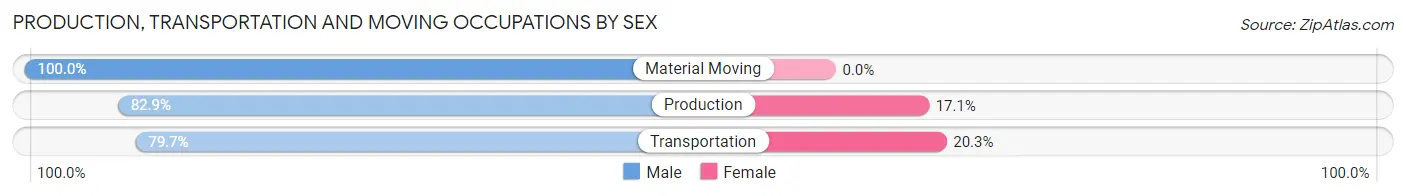
Production, Transportation and Moving Occupations by Sex
| Occupation | Male | Female |
| Production | 228 (82.9%) | 47 (17.1%) |
| Transportation | 149 (79.7%) | 38 (20.3%) |
| Material Moving | 213 (100.0%) | 0 (0.0%) |
| Total (Category) | 590 (87.4%) | 85 (12.6%) |
| Total (Overall) | 1,911 (48.4%) | 2,037 (51.6%) |
Employment Industries by Sex in Fairfield
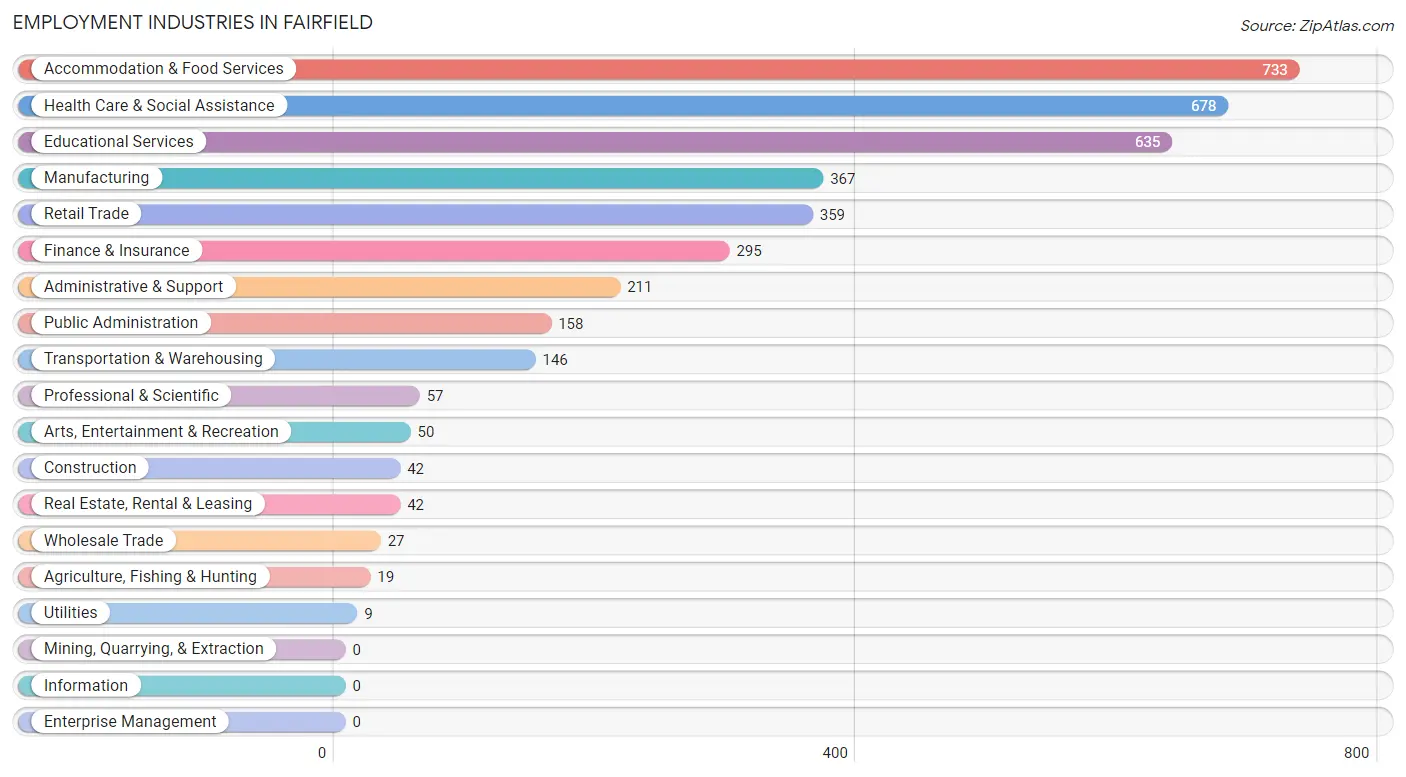
Employment Industries in Fairfield
The major employment industries in Fairfield include Accommodation & Food Services (733 | 18.6%), Health Care & Social Assistance (678 | 17.2%), Educational Services (635 | 16.1%), Manufacturing (367 | 9.3%), and Retail Trade (359 | 9.1%).
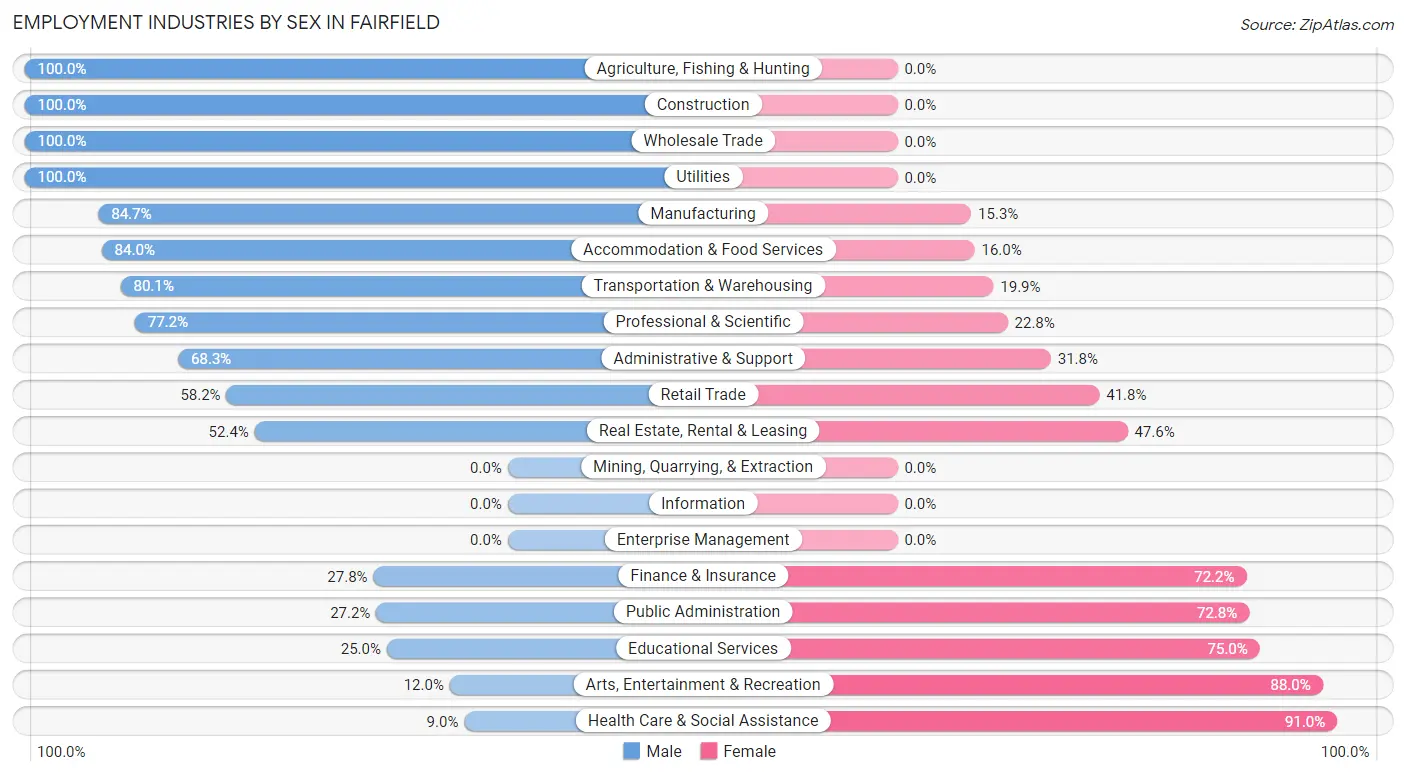
Employment Industries by Sex in Fairfield
The Fairfield industries that see more men than women are Agriculture, Fishing & Hunting (100.0%), Construction (100.0%), and Wholesale Trade (100.0%), whereas the industries that tend to have a higher number of women are Health Care & Social Assistance (91.0%), Arts, Entertainment & Recreation (88.0%), and Educational Services (75.0%).
| Industry | Male | Female |
| Agriculture, Fishing & Hunting | 19 (100.0%) | 0 (0.0%) |
| Mining, Quarrying, & Extraction | 0 (0.0%) | 0 (0.0%) |
| Construction | 42 (100.0%) | 0 (0.0%) |
| Manufacturing | 311 (84.7%) | 56 (15.3%) |
| Wholesale Trade | 27 (100.0%) | 0 (0.0%) |
| Retail Trade | 209 (58.2%) | 150 (41.8%) |
| Transportation & Warehousing | 117 (80.1%) | 29 (19.9%) |
| Utilities | 9 (100.0%) | 0 (0.0%) |
| Information | 0 (0.0%) | 0 (0.0%) |
| Finance & Insurance | 82 (27.8%) | 213 (72.2%) |
| Real Estate, Rental & Leasing | 22 (52.4%) | 20 (47.6%) |
| Professional & Scientific | 44 (77.2%) | 13 (22.8%) |
| Enterprise Management | 0 (0.0%) | 0 (0.0%) |
| Administrative & Support | 144 (68.2%) | 67 (31.8%) |
| Educational Services | 159 (25.0%) | 476 (75.0%) |
| Health Care & Social Assistance | 61 (9.0%) | 617 (91.0%) |
| Arts, Entertainment & Recreation | 6 (12.0%) | 44 (88.0%) |
| Accommodation & Food Services | 616 (84.0%) | 117 (16.0%) |
| Public Administration | 43 (27.2%) | 115 (72.8%) |
| Total | 1,911 (48.4%) | 2,037 (51.6%) |
Education in Fairfield
School Enrollment in Fairfield
The most common levels of schooling among the 3,131 students in Fairfield are college / undergraduate (1,133 | 36.2%), middle school (657 | 21.0%), and elementary school (563 | 18.0%).
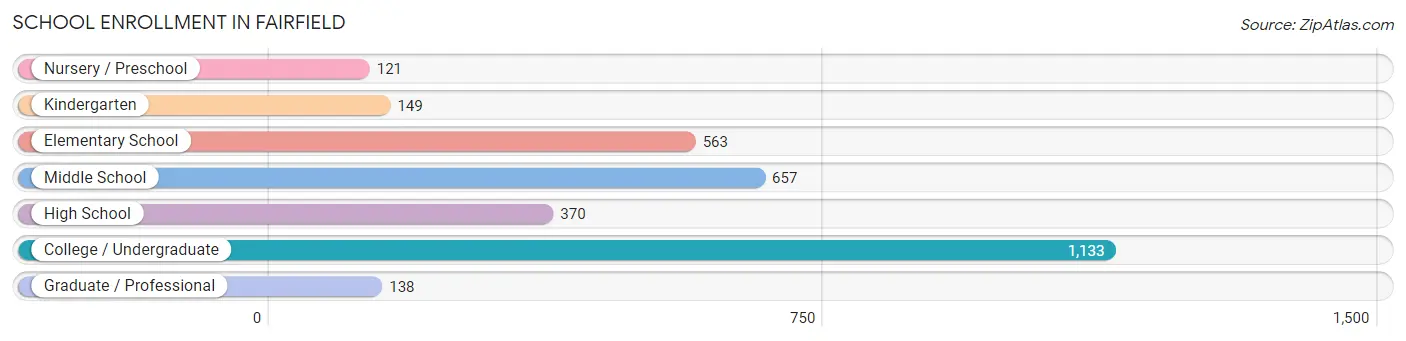
| School Level | # Students | % Students |
| Nursery / Preschool | 121 | 3.9% |
| Kindergarten | 149 | 4.8% |
| Elementary School | 563 | 18.0% |
| Middle School | 657 | 21.0% |
| High School | 370 | 11.8% |
| College / Undergraduate | 1,133 | 36.2% |
| Graduate / Professional | 138 | 4.4% |
| Total | 3,131 | 100.0% |
School Enrollment by Age by Funding Source in Fairfield
Out of a total of 3,131 students who are enrolled in schools in Fairfield, 902 (28.8%) attend a private institution, while the remaining 2,229 (71.2%) are enrolled in public schools. The age group of 20 to 24 year olds has the highest likelihood of being enrolled in private schools, with 284 (71.5% in the age bracket) enrolled. Conversely, the age group of 3 to 4 year olds has the lowest likelihood of being enrolled in a private school, with 151 (92.6% in the age bracket) attending a public institution.
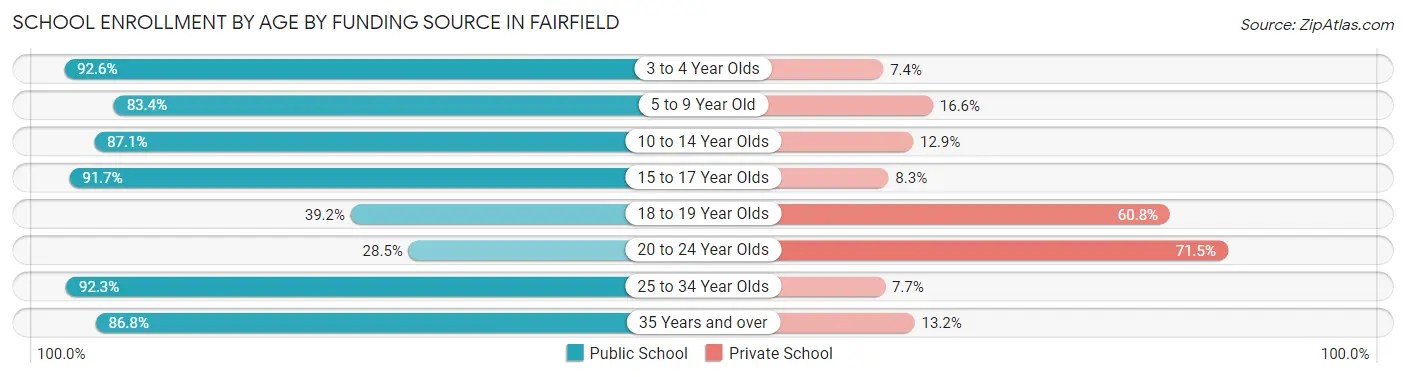
| Age Bracket | Public School | Private School |
| 3 to 4 Year Olds | 151 (92.6%) | 12 (7.4%) |
| 5 to 9 Year Old | 472 (83.4%) | 94 (16.6%) |
| 10 to 14 Year Olds | 761 (87.1%) | 113 (12.9%) |
| 15 to 17 Year Olds | 209 (91.7%) | 19 (8.3%) |
| 18 to 19 Year Olds | 226 (39.2%) | 350 (60.8%) |
| 20 to 24 Year Olds | 113 (28.5%) | 284 (71.5%) |
| 25 to 34 Year Olds | 204 (92.3%) | 17 (7.7%) |
| 35 Years and over | 92 (86.8%) | 14 (13.2%) |
| Total | 2,229 (71.2%) | 902 (28.8%) |
Educational Attainment by Field of Study in Fairfield
Science & technology (308 | 20.2%), education (277 | 18.2%), business (258 | 17.0%), arts & humanities (184 | 12.1%), and computers & mathematics (118 | 7.7%) are the most common fields of study among 1,522 individuals in Fairfield who have obtained a bachelor's degree or higher.
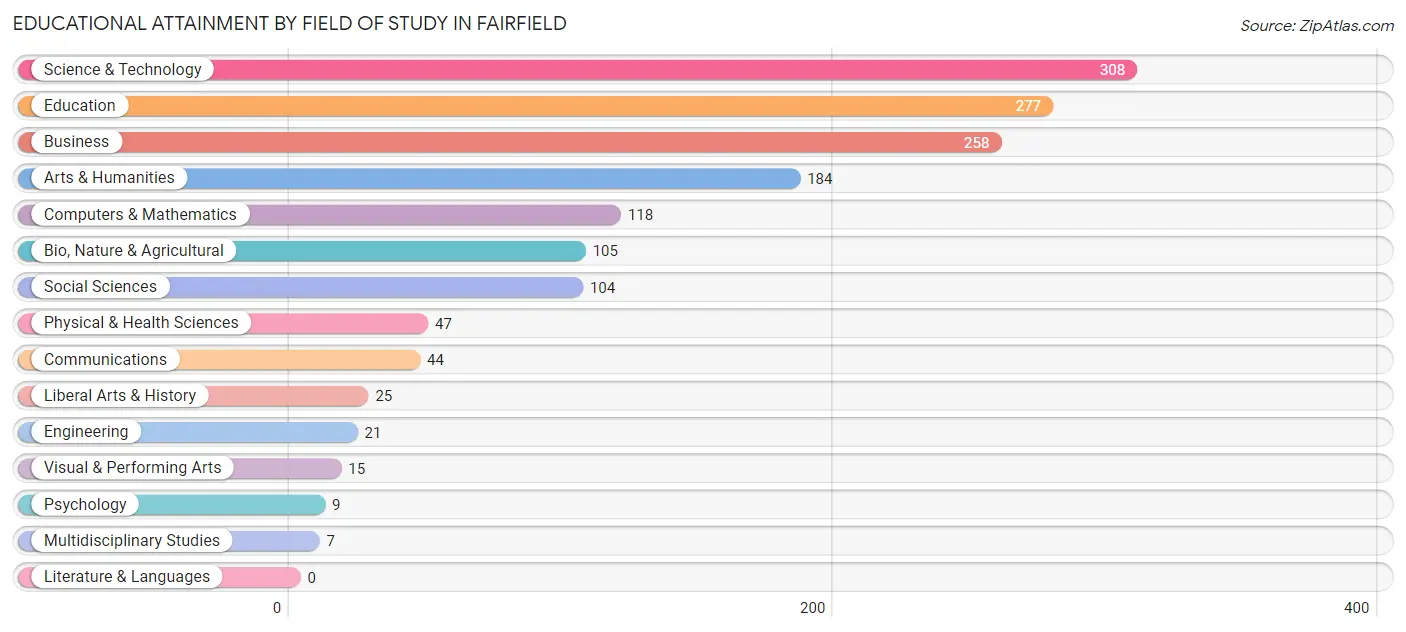
| Field of Study | # Graduates | % Graduates |
| Computers & Mathematics | 118 | 7.7% |
| Bio, Nature & Agricultural | 105 | 6.9% |
| Physical & Health Sciences | 47 | 3.1% |
| Psychology | 9 | 0.6% |
| Social Sciences | 104 | 6.8% |
| Engineering | 21 | 1.4% |
| Multidisciplinary Studies | 7 | 0.5% |
| Science & Technology | 308 | 20.2% |
| Business | 258 | 17.0% |
| Education | 277 | 18.2% |
| Literature & Languages | 0 | 0.0% |
| Liberal Arts & History | 25 | 1.6% |
| Visual & Performing Arts | 15 | 1.0% |
| Communications | 44 | 2.9% |
| Arts & Humanities | 184 | 12.1% |
| Total | 1,522 | 100.0% |
Transportation & Commute in Fairfield
Vehicle Availability by Sex in Fairfield
The most prevalent vehicle ownership categories in Fairfield are males with 2 vehicles (714, accounting for 38.7%) and females with 2 vehicles (579, making up 39.5%).
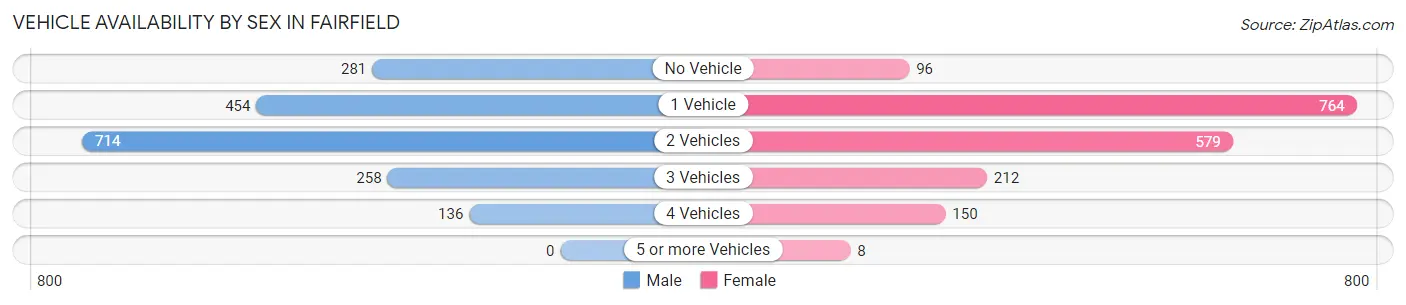
| Vehicles Available | Male | Female |
| No Vehicle | 281 (15.2%) | 96 (5.3%) |
| 1 Vehicle | 454 (24.6%) | 764 (42.2%) |
| 2 Vehicles | 714 (38.7%) | 579 (32.0%) |
| 3 Vehicles | 258 (14.0%) | 212 (11.7%) |
| 4 Vehicles | 136 (7.4%) | 150 (8.3%) |
| 5 or more Vehicles | 0 (0.0%) | 8 (0.4%) |
| Total | 1,843 (100.0%) | 1,809 (100.0%) |
Commute Time in Fairfield
The most frequently occuring commute durations in Fairfield are 20 to 24 minutes (1,232 commuters, 36.0%), 30 to 34 minutes (512 commuters, 15.0%), and 15 to 19 minutes (443 commuters, 13.0%).
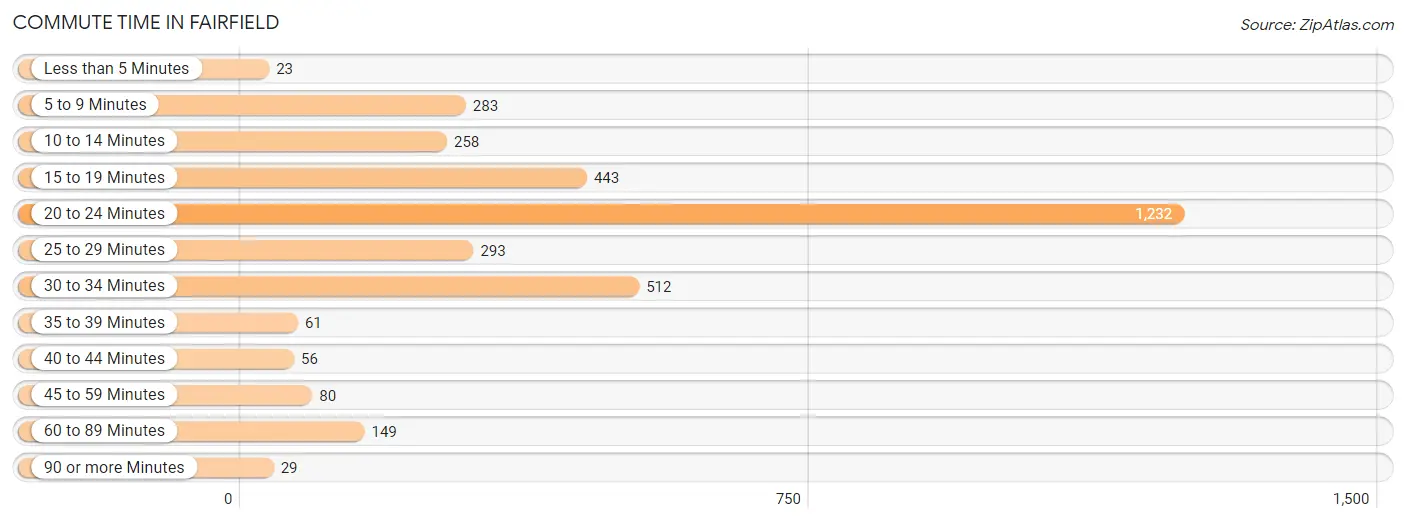
| Commute Time | # Commuters | % Commuters |
| Less than 5 Minutes | 23 | 0.7% |
| 5 to 9 Minutes | 283 | 8.3% |
| 10 to 14 Minutes | 258 | 7.5% |
| 15 to 19 Minutes | 443 | 13.0% |
| 20 to 24 Minutes | 1,232 | 36.0% |
| 25 to 29 Minutes | 293 | 8.6% |
| 30 to 34 Minutes | 512 | 15.0% |
| 35 to 39 Minutes | 61 | 1.8% |
| 40 to 44 Minutes | 56 | 1.6% |
| 45 to 59 Minutes | 80 | 2.3% |
| 60 to 89 Minutes | 149 | 4.4% |
| 90 or more Minutes | 29 | 0.9% |
Commute Time by Sex in Fairfield
The most common commute times in Fairfield are 20 to 24 minutes (916 commuters, 49.1%) for males and 15 to 19 minutes (349 commuters, 22.5%) for females.
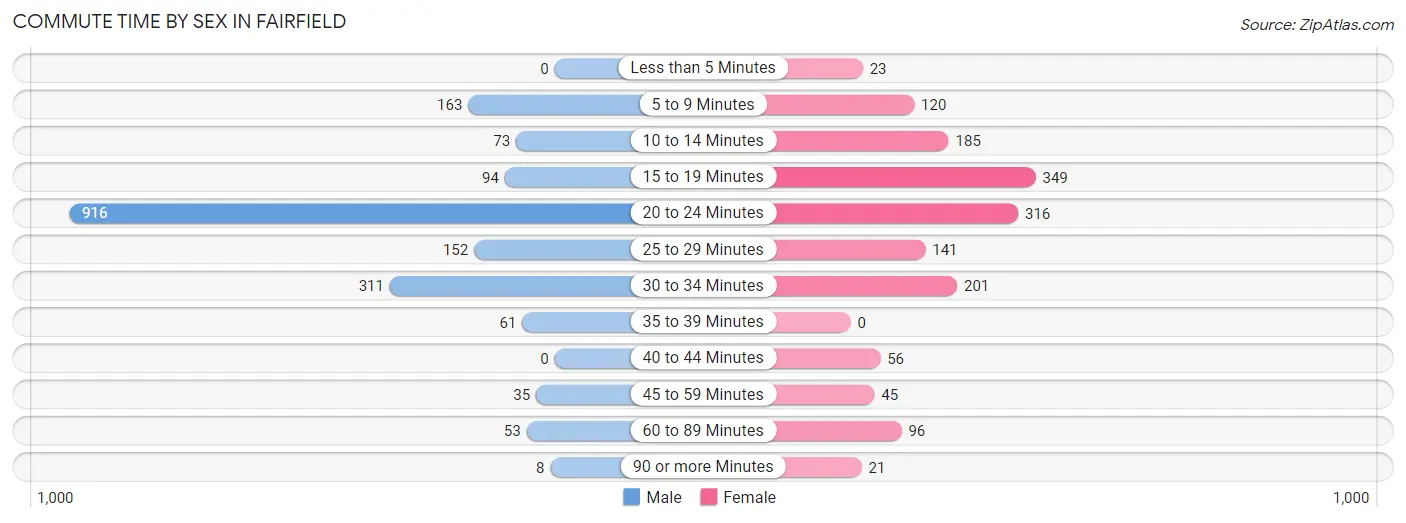
| Commute Time | Male | Female |
| Less than 5 Minutes | 0 (0.0%) | 23 (1.5%) |
| 5 to 9 Minutes | 163 (8.7%) | 120 (7.7%) |
| 10 to 14 Minutes | 73 (3.9%) | 185 (11.9%) |
| 15 to 19 Minutes | 94 (5.0%) | 349 (22.5%) |
| 20 to 24 Minutes | 916 (49.1%) | 316 (20.3%) |
| 25 to 29 Minutes | 152 (8.2%) | 141 (9.1%) |
| 30 to 34 Minutes | 311 (16.7%) | 201 (12.9%) |
| 35 to 39 Minutes | 61 (3.3%) | 0 (0.0%) |
| 40 to 44 Minutes | 0 (0.0%) | 56 (3.6%) |
| 45 to 59 Minutes | 35 (1.9%) | 45 (2.9%) |
| 60 to 89 Minutes | 53 (2.8%) | 96 (6.2%) |
| 90 or more Minutes | 8 (0.4%) | 21 (1.3%) |
Time of Departure to Work by Sex in Fairfield
The most frequent times of departure to work in Fairfield are 7:00 AM to 7:29 AM (343, 18.4%) for males and 7:30 AM to 7:59 AM (205, 13.2%) for females.
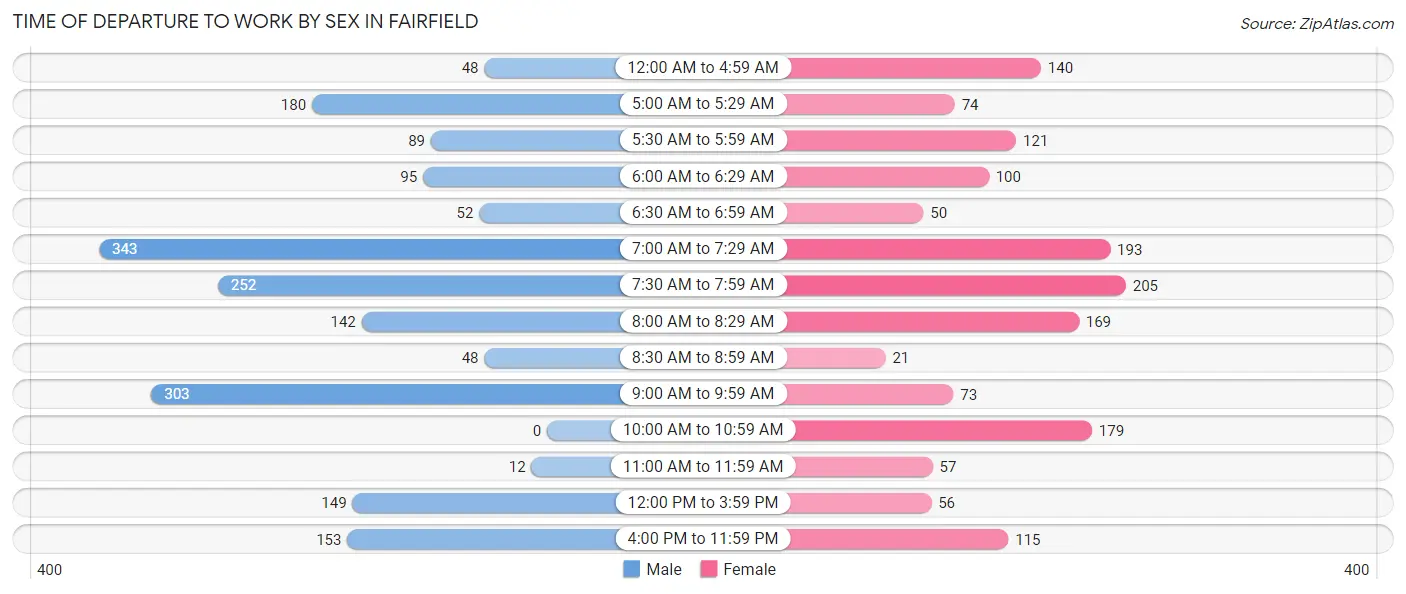
| Time of Departure | Male | Female |
| 12:00 AM to 4:59 AM | 48 (2.6%) | 140 (9.0%) |
| 5:00 AM to 5:29 AM | 180 (9.7%) | 74 (4.8%) |
| 5:30 AM to 5:59 AM | 89 (4.8%) | 121 (7.8%) |
| 6:00 AM to 6:29 AM | 95 (5.1%) | 100 (6.4%) |
| 6:30 AM to 6:59 AM | 52 (2.8%) | 50 (3.2%) |
| 7:00 AM to 7:29 AM | 343 (18.4%) | 193 (12.4%) |
| 7:30 AM to 7:59 AM | 252 (13.5%) | 205 (13.2%) |
| 8:00 AM to 8:29 AM | 142 (7.6%) | 169 (10.9%) |
| 8:30 AM to 8:59 AM | 48 (2.6%) | 21 (1.3%) |
| 9:00 AM to 9:59 AM | 303 (16.2%) | 73 (4.7%) |
| 10:00 AM to 10:59 AM | 0 (0.0%) | 179 (11.5%) |
| 11:00 AM to 11:59 AM | 12 (0.6%) | 57 (3.7%) |
| 12:00 PM to 3:59 PM | 149 (8.0%) | 56 (3.6%) |
| 4:00 PM to 11:59 PM | 153 (8.2%) | 115 (7.4%) |
| Total | 1,866 (100.0%) | 1,553 (100.0%) |
Housing Occupancy in Fairfield
Occupancy by Ownership in Fairfield
Of the total 3,783 dwellings in Fairfield, owner-occupied units account for 2,130 (56.3%), while renter-occupied units make up 1,653 (43.7%).
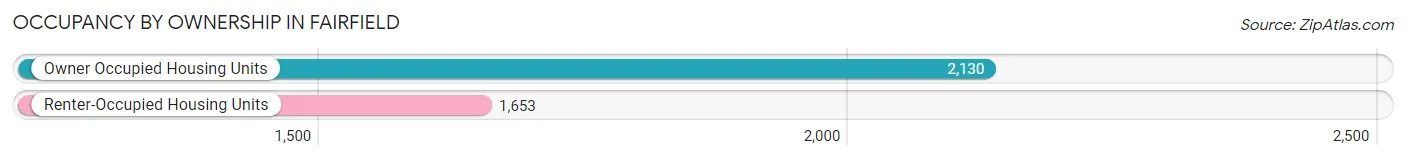
| Occupancy | # Housing Units | % Housing Units |
| Owner Occupied Housing Units | 2,130 | 56.3% |
| Renter-Occupied Housing Units | 1,653 | 43.7% |
| Total Occupied Housing Units | 3,783 | 100.0% |
Occupancy by Household Size in Fairfield
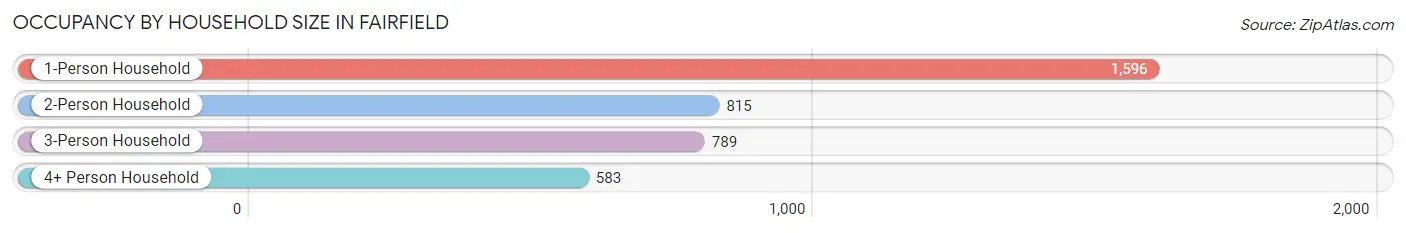
| Household Size | # Housing Units | % Housing Units |
| 1-Person Household | 1,596 | 42.2% |
| 2-Person Household | 815 | 21.5% |
| 3-Person Household | 789 | 20.9% |
| 4+ Person Household | 583 | 15.4% |
| Total Housing Units | 3,783 | 100.0% |
Occupancy by Ownership by Household Size in Fairfield
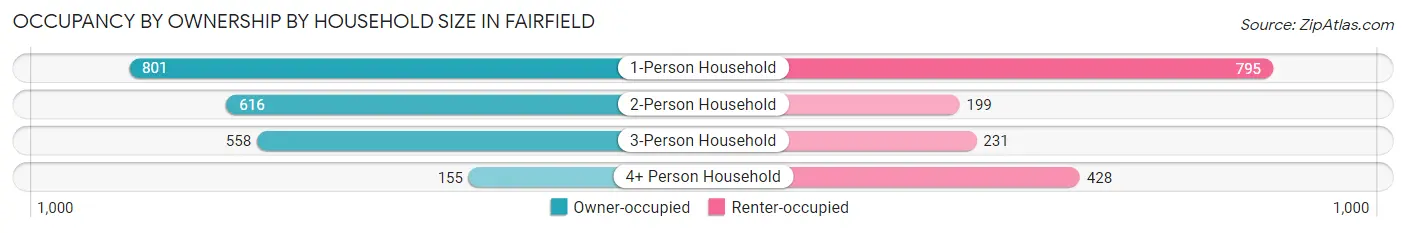
| Household Size | Owner-occupied | Renter-occupied |
| 1-Person Household | 801 (50.2%) | 795 (49.8%) |
| 2-Person Household | 616 (75.6%) | 199 (24.4%) |
| 3-Person Household | 558 (70.7%) | 231 (29.3%) |
| 4+ Person Household | 155 (26.6%) | 428 (73.4%) |
| Total Housing Units | 2,130 (56.3%) | 1,653 (43.7%) |
Occupancy by Educational Attainment in Fairfield
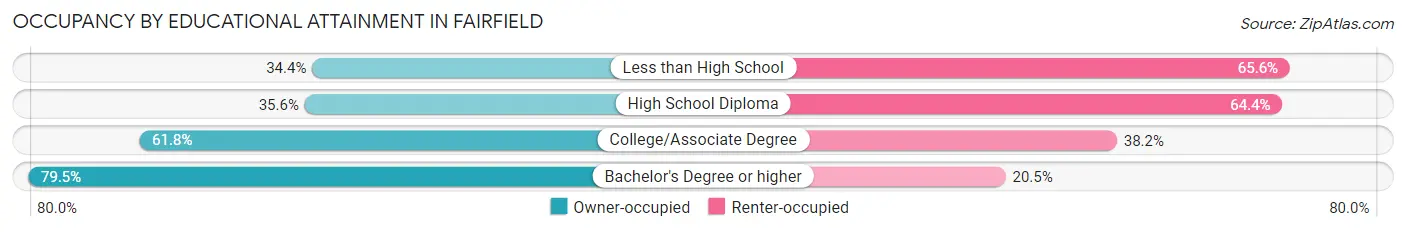
| Household Size | Owner-occupied | Renter-occupied |
| Less than High School | 33 (34.4%) | 63 (65.6%) |
| High School Diploma | 461 (35.6%) | 835 (64.4%) |
| College/Associate Degree | 927 (61.8%) | 572 (38.2%) |
| Bachelor's Degree or higher | 709 (79.5%) | 183 (20.5%) |
Occupancy by Age of Householder in Fairfield
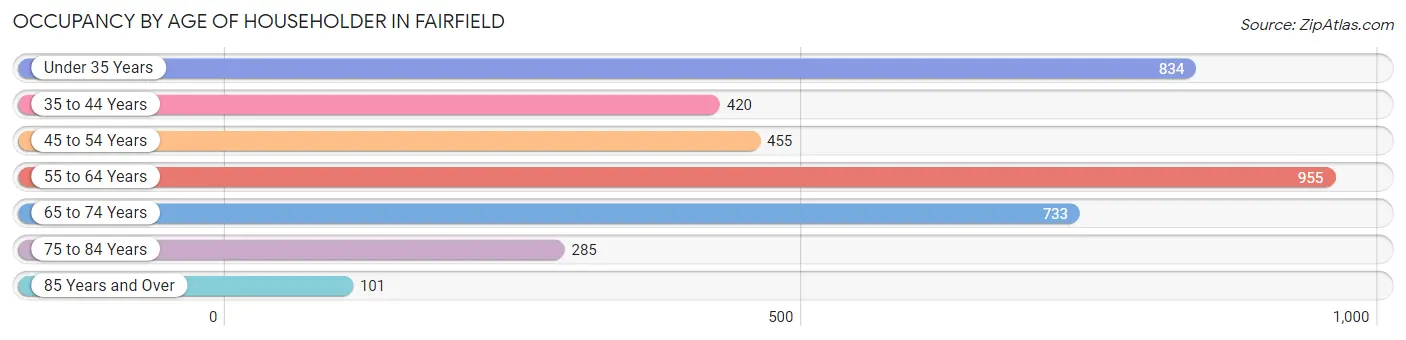
| Age Bracket | # Households | % Households |
| Under 35 Years | 834 | 22.1% |
| 35 to 44 Years | 420 | 11.1% |
| 45 to 54 Years | 455 | 12.0% |
| 55 to 64 Years | 955 | 25.2% |
| 65 to 74 Years | 733 | 19.4% |
| 75 to 84 Years | 285 | 7.5% |
| 85 Years and Over | 101 | 2.7% |
| Total | 3,783 | 100.0% |
Housing Finances in Fairfield
Median Income by Occupancy in Fairfield
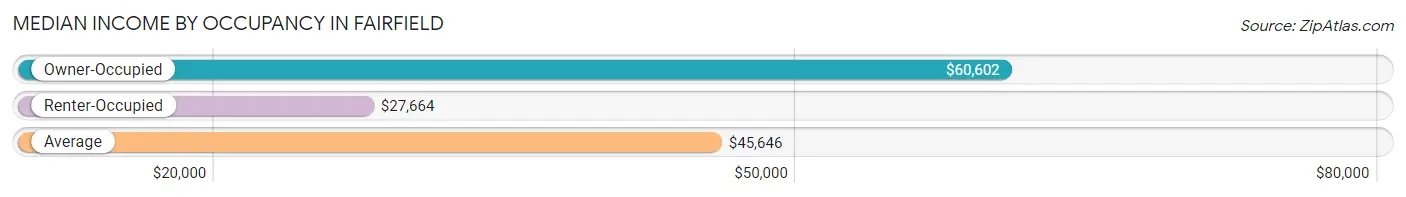
| Occupancy Type | # Households | Median Income |
| Owner-Occupied | 2,130 (56.3%) | $60,602 |
| Renter-Occupied | 1,653 (43.7%) | $27,664 |
| Average | 3,783 (100.0%) | $45,646 |
Occupancy by Householder Income Bracket in Fairfield
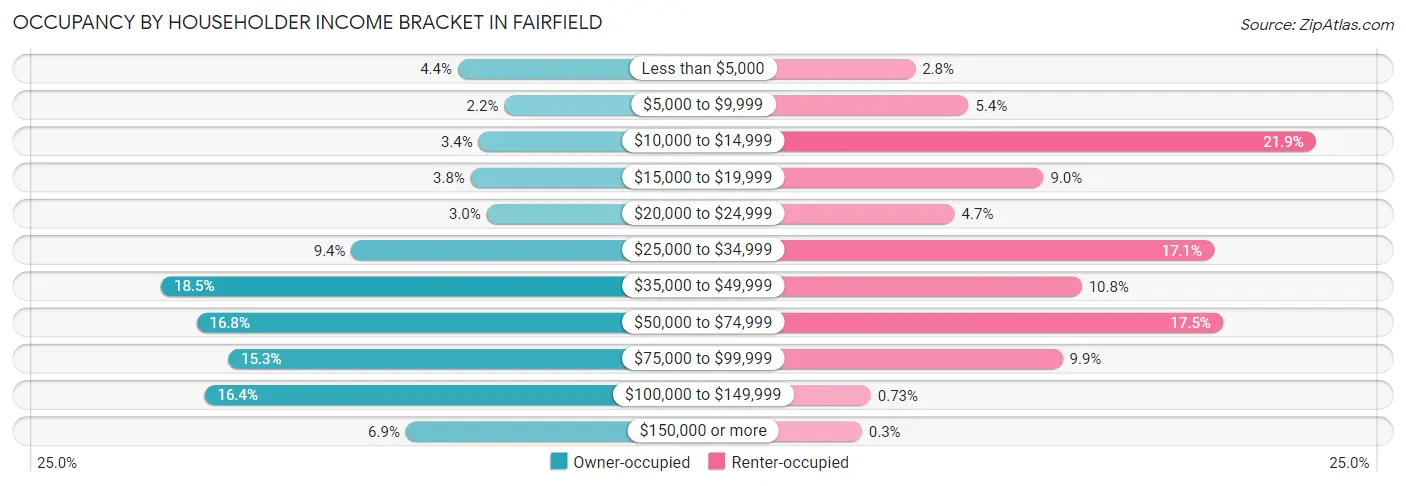
| Income Bracket | Owner-occupied | Renter-occupied |
| Less than $5,000 | 93 (4.4%) | 47 (2.8%) |
| $5,000 to $9,999 | 46 (2.2%) | 89 (5.4%) |
| $10,000 to $14,999 | 72 (3.4%) | 362 (21.9%) |
| $15,000 to $19,999 | 80 (3.8%) | 148 (8.9%) |
| $20,000 to $24,999 | 64 (3.0%) | 78 (4.7%) |
| $25,000 to $34,999 | 201 (9.4%) | 282 (17.1%) |
| $35,000 to $49,999 | 394 (18.5%) | 178 (10.8%) |
| $50,000 to $74,999 | 358 (16.8%) | 289 (17.5%) |
| $75,000 to $99,999 | 326 (15.3%) | 163 (9.9%) |
| $100,000 to $149,999 | 350 (16.4%) | 12 (0.7%) |
| $150,000 or more | 146 (6.9%) | 5 (0.3%) |
| Total | 2,130 (100.0%) | 1,653 (100.0%) |
Monthly Housing Cost Tiers in Fairfield
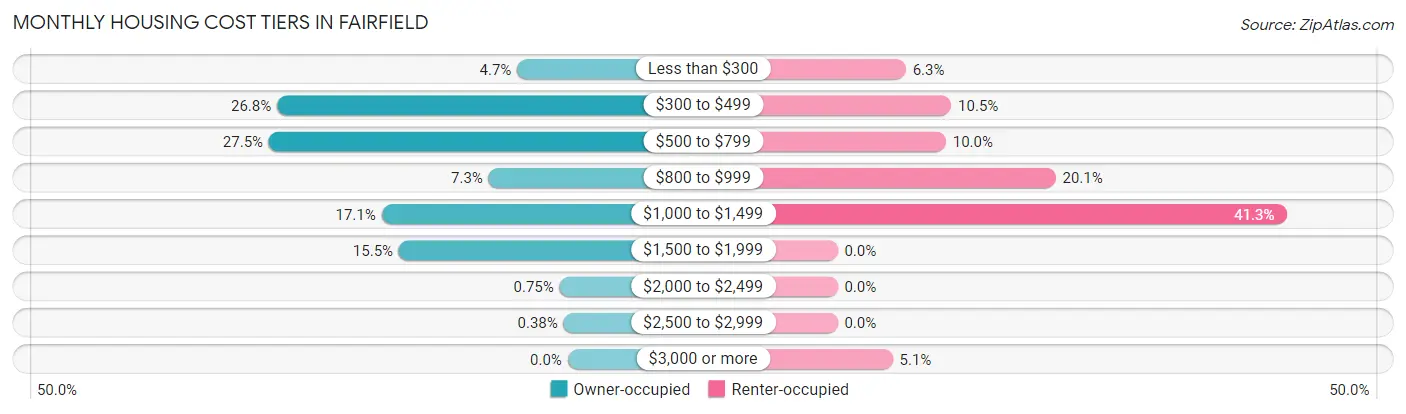
| Monthly Cost | Owner-occupied | Renter-occupied |
| Less than $300 | 99 (4.6%) | 104 (6.3%) |
| $300 to $499 | 570 (26.8%) | 173 (10.5%) |
| $500 to $799 | 586 (27.5%) | 165 (10.0%) |
| $800 to $999 | 155 (7.3%) | 332 (20.1%) |
| $1,000 to $1,499 | 365 (17.1%) | 683 (41.3%) |
| $1,500 to $1,999 | 331 (15.5%) | 0 (0.0%) |
| $2,000 to $2,499 | 16 (0.7%) | 0 (0.0%) |
| $2,500 to $2,999 | 8 (0.4%) | 0 (0.0%) |
| $3,000 or more | 0 (0.0%) | 84 (5.1%) |
| Total | 2,130 (100.0%) | 1,653 (100.0%) |
Physical Housing Characteristics in Fairfield
Housing Structures in Fairfield
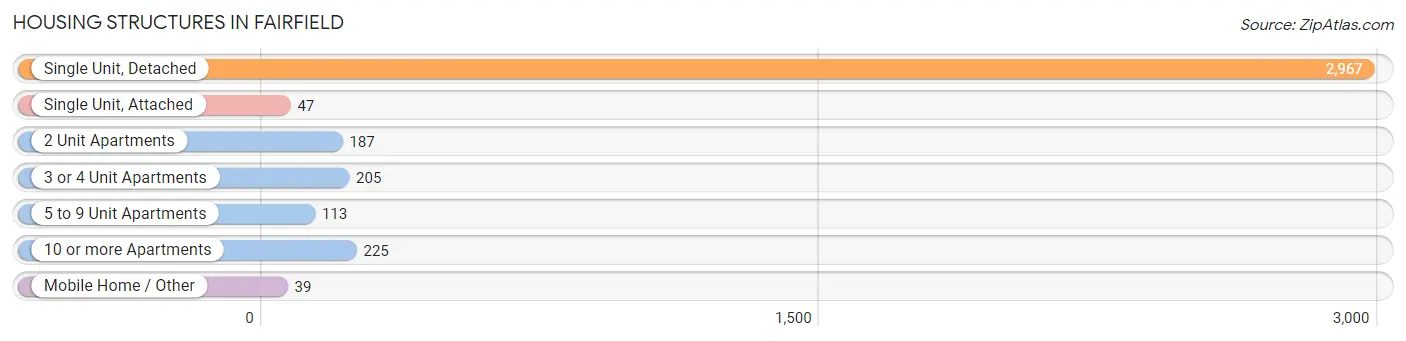
| Structure Type | # Housing Units | % Housing Units |
| Single Unit, Detached | 2,967 | 78.4% |
| Single Unit, Attached | 47 | 1.2% |
| 2 Unit Apartments | 187 | 4.9% |
| 3 or 4 Unit Apartments | 205 | 5.4% |
| 5 to 9 Unit Apartments | 113 | 3.0% |
| 10 or more Apartments | 225 | 5.9% |
| Mobile Home / Other | 39 | 1.0% |
| Total | 3,783 | 100.0% |
Housing Structures by Occupancy in Fairfield
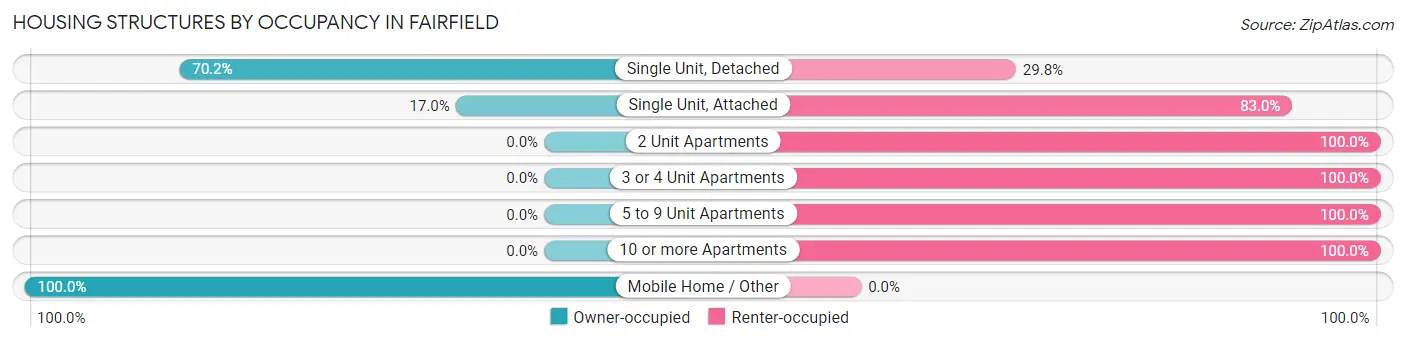
| Structure Type | Owner-occupied | Renter-occupied |
| Single Unit, Detached | 2,083 (70.2%) | 884 (29.8%) |
| Single Unit, Attached | 8 (17.0%) | 39 (83.0%) |
| 2 Unit Apartments | 0 (0.0%) | 187 (100.0%) |
| 3 or 4 Unit Apartments | 0 (0.0%) | 205 (100.0%) |
| 5 to 9 Unit Apartments | 0 (0.0%) | 113 (100.0%) |
| 10 or more Apartments | 0 (0.0%) | 225 (100.0%) |
| Mobile Home / Other | 39 (100.0%) | 0 (0.0%) |
| Total | 2,130 (56.3%) | 1,653 (43.7%) |
Housing Structures by Number of Rooms in Fairfield
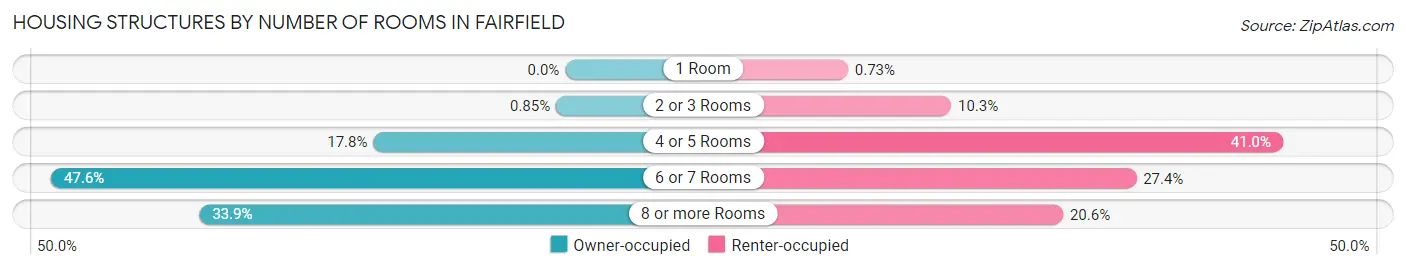
| Number of Rooms | Owner-occupied | Renter-occupied |
| 1 Room | 0 (0.0%) | 12 (0.7%) |
| 2 or 3 Rooms | 18 (0.9%) | 170 (10.3%) |
| 4 or 5 Rooms | 378 (17.7%) | 677 (41.0%) |
| 6 or 7 Rooms | 1,013 (47.6%) | 453 (27.4%) |
| 8 or more Rooms | 721 (33.9%) | 341 (20.6%) |
| Total | 2,130 (100.0%) | 1,653 (100.0%) |
Housing Structure by Heating Type in Fairfield
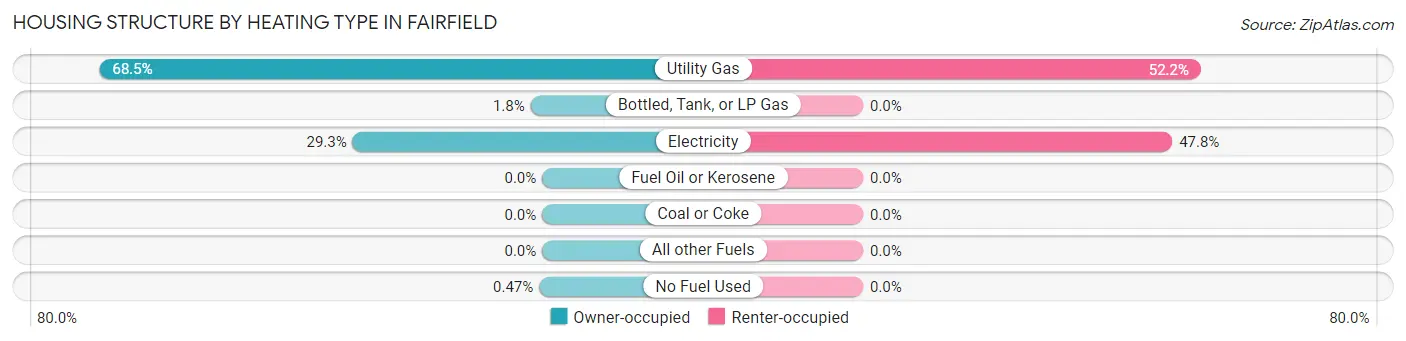
| Heating Type | Owner-occupied | Renter-occupied |
| Utility Gas | 1,458 (68.4%) | 863 (52.2%) |
| Bottled, Tank, or LP Gas | 38 (1.8%) | 0 (0.0%) |
| Electricity | 624 (29.3%) | 790 (47.8%) |
| Fuel Oil or Kerosene | 0 (0.0%) | 0 (0.0%) |
| Coal or Coke | 0 (0.0%) | 0 (0.0%) |
| All other Fuels | 0 (0.0%) | 0 (0.0%) |
| No Fuel Used | 10 (0.5%) | 0 (0.0%) |
| Total | 2,130 (100.0%) | 1,653 (100.0%) |
Household Vehicle Usage in Fairfield
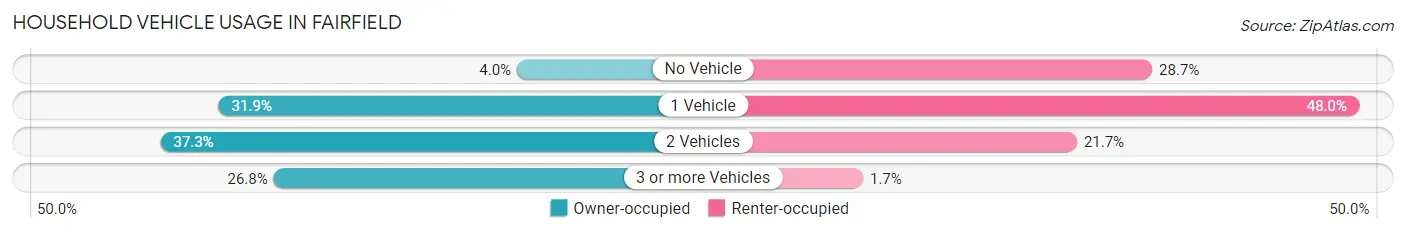
| Vehicles per Household | Owner-occupied | Renter-occupied |
| No Vehicle | 86 (4.0%) | 474 (28.7%) |
| 1 Vehicle | 679 (31.9%) | 793 (48.0%) |
| 2 Vehicles | 795 (37.3%) | 358 (21.7%) |
| 3 or more Vehicles | 570 (26.8%) | 28 (1.7%) |
| Total | 2,130 (100.0%) | 1,653 (100.0%) |
Real Estate & Mortgages in Fairfield
Real Estate and Mortgage Overview in Fairfield
| Characteristic | Without Mortgage | With Mortgage |
| Housing Units | 1,042 | 1,088 |
| Median Property Value | $106,200 | $134,400 |
| Median Household Income | $62,733 | $76 |
| Monthly Housing Costs | $477 | $0 |
| Real Estate Taxes | $917 | $269 |
Property Value by Mortgage Status in Fairfield
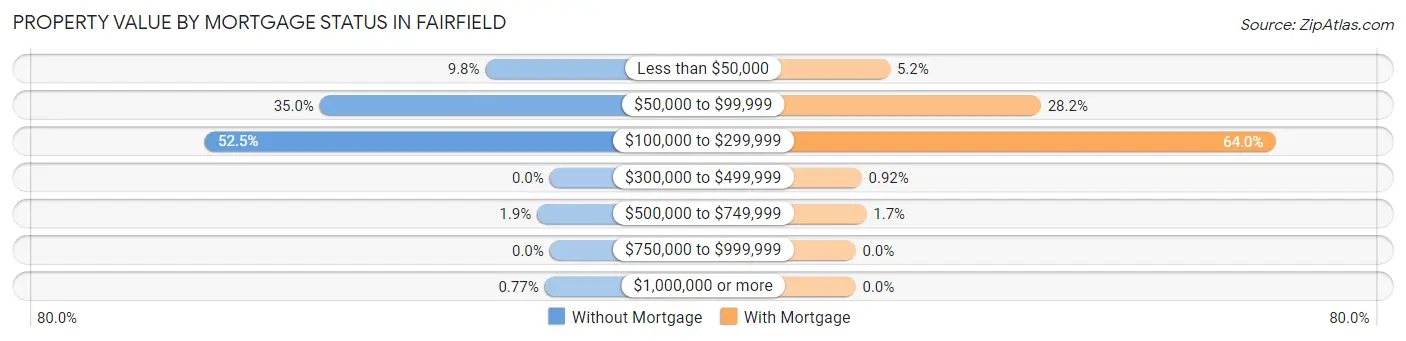
| Property Value | Without Mortgage | With Mortgage |
| Less than $50,000 | 102 (9.8%) | 57 (5.2%) |
| $50,000 to $99,999 | 365 (35.0%) | 307 (28.2%) |
| $100,000 to $299,999 | 547 (52.5%) | 696 (64.0%) |
| $300,000 to $499,999 | 0 (0.0%) | 10 (0.9%) |
| $500,000 to $749,999 | 20 (1.9%) | 18 (1.7%) |
| $750,000 to $999,999 | 0 (0.0%) | 0 (0.0%) |
| $1,000,000 or more | 8 (0.8%) | 0 (0.0%) |
| Total | 1,042 (100.0%) | 1,088 (100.0%) |
Household Income by Mortgage Status in Fairfield
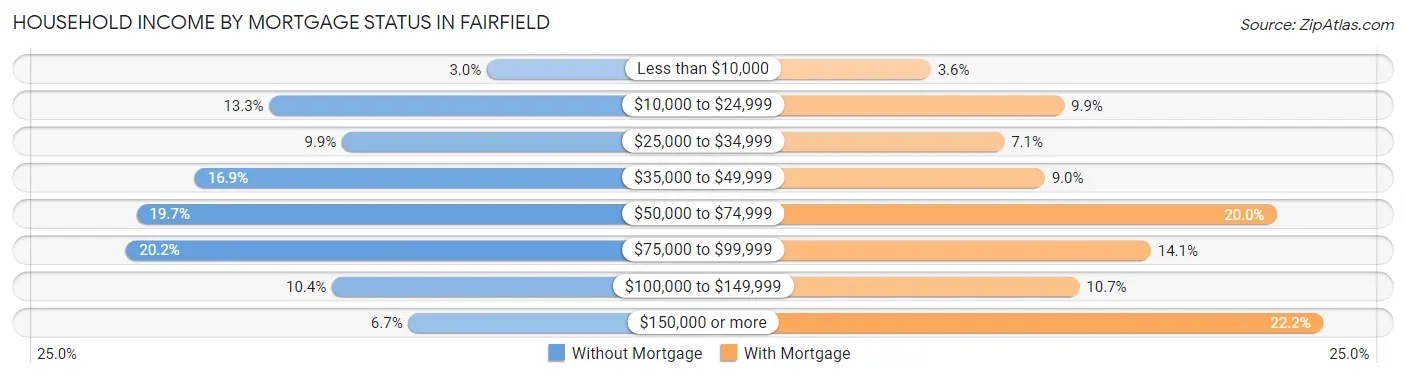
| Household Income | Without Mortgage | With Mortgage |
| Less than $10,000 | 31 (3.0%) | 39 (3.6%) |
| $10,000 to $24,999 | 139 (13.3%) | 108 (9.9%) |
| $25,000 to $34,999 | 103 (9.9%) | 77 (7.1%) |
| $35,000 to $49,999 | 176 (16.9%) | 98 (9.0%) |
| $50,000 to $74,999 | 205 (19.7%) | 218 (20.0%) |
| $75,000 to $99,999 | 210 (20.2%) | 153 (14.1%) |
| $100,000 to $149,999 | 108 (10.4%) | 116 (10.7%) |
| $150,000 or more | 70 (6.7%) | 242 (22.2%) |
| Total | 1,042 (100.0%) | 1,088 (100.0%) |
Property Value to Household Income Ratio in Fairfield
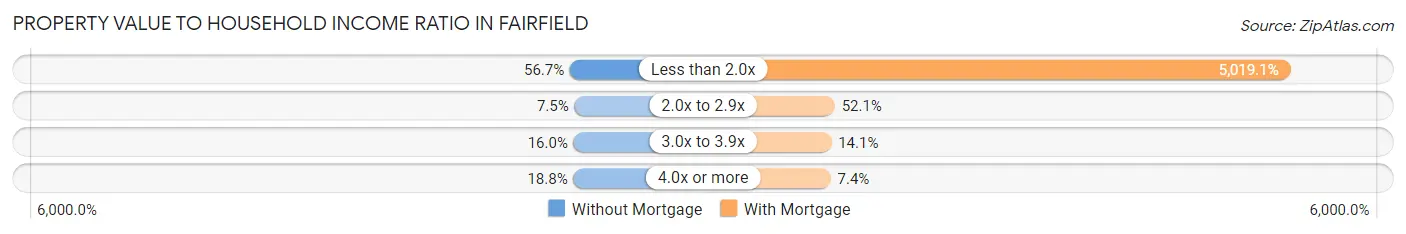
| Value-to-Income Ratio | Without Mortgage | With Mortgage |
| Less than 2.0x | 591 (56.7%) | 54,608 (5,019.1%) |
| 2.0x to 2.9x | 78 (7.5%) | 567 (52.1%) |
| 3.0x to 3.9x | 167 (16.0%) | 153 (14.1%) |
| 4.0x or more | 196 (18.8%) | 81 (7.4%) |
| Total | 1,042 (100.0%) | 1,088 (100.0%) |
Real Estate Taxes by Mortgage Status in Fairfield
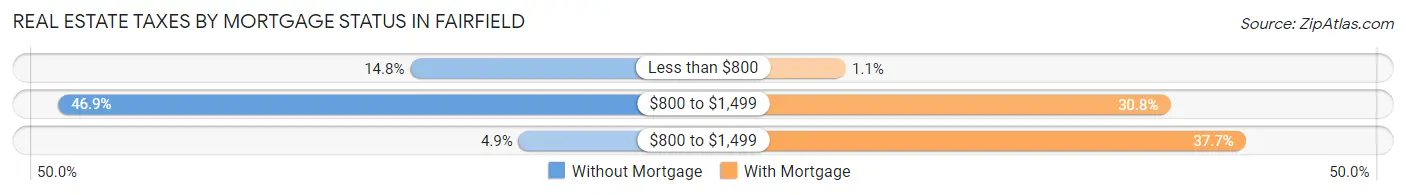
| Property Taxes | Without Mortgage | With Mortgage |
| Less than $800 | 154 (14.8%) | 12 (1.1%) |
| $800 to $1,499 | 489 (46.9%) | 335 (30.8%) |
| $800 to $1,499 | 51 (4.9%) | 410 (37.7%) |
| Total | 1,042 (100.0%) | 1,088 (100.0%) |
Health & Disability in Fairfield
Health Insurance Coverage by Age in Fairfield
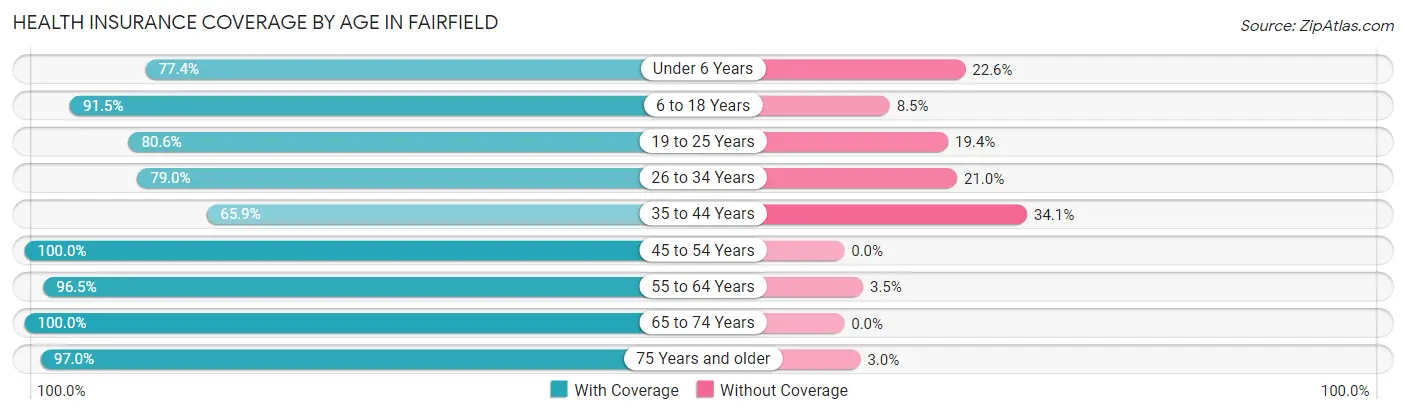
| Age Bracket | With Coverage | Without Coverage |
| Under 6 Years | 552 (77.4%) | 161 (22.6%) |
| 6 to 18 Years | 1,781 (91.5%) | 165 (8.5%) |
| 19 to 25 Years | 1,028 (80.6%) | 247 (19.4%) |
| 26 to 34 Years | 1,168 (79.0%) | 311 (21.0%) |
| 35 to 44 Years | 501 (65.9%) | 259 (34.1%) |
| 45 to 54 Years | 811 (100.0%) | 0 (0.0%) |
| 55 to 64 Years | 1,353 (96.5%) | 49 (3.5%) |
| 65 to 74 Years | 1,066 (100.0%) | 0 (0.0%) |
| 75 Years and older | 417 (97.0%) | 13 (3.0%) |
| Total | 8,677 (87.8%) | 1,205 (12.2%) |
Health Insurance Coverage by Citizenship Status in Fairfield
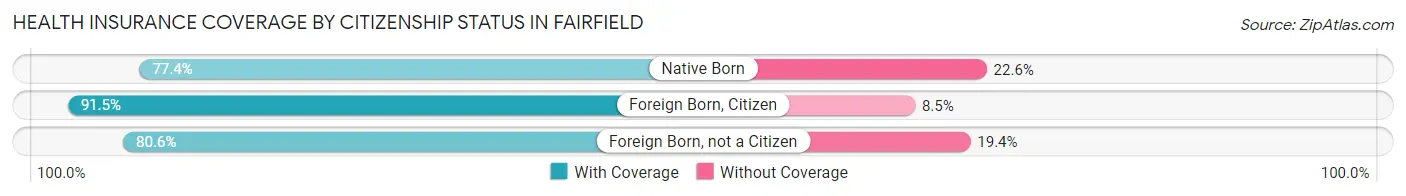
| Citizenship Status | With Coverage | Without Coverage |
| Native Born | 552 (77.4%) | 161 (22.6%) |
| Foreign Born, Citizen | 1,781 (91.5%) | 165 (8.5%) |
| Foreign Born, not a Citizen | 1,028 (80.6%) | 247 (19.4%) |
Health Insurance Coverage by Household Income in Fairfield
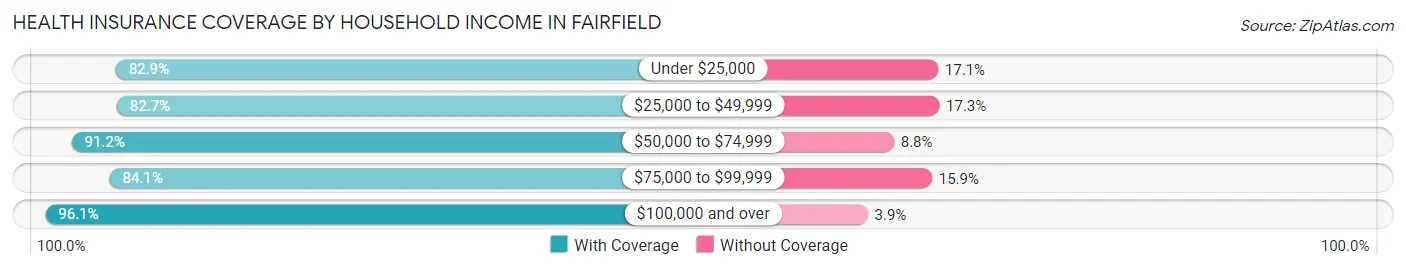
| Household Income | With Coverage | Without Coverage |
| Under $25,000 | 1,544 (82.9%) | 318 (17.1%) |
| $25,000 to $49,999 | 1,831 (82.7%) | 383 (17.3%) |
| $50,000 to $74,999 | 1,689 (91.2%) | 163 (8.8%) |
| $75,000 to $99,999 | 1,326 (84.1%) | 251 (15.9%) |
| $100,000 and over | 1,478 (96.1%) | 60 (3.9%) |
Public vs Private Health Insurance Coverage by Age in Fairfield
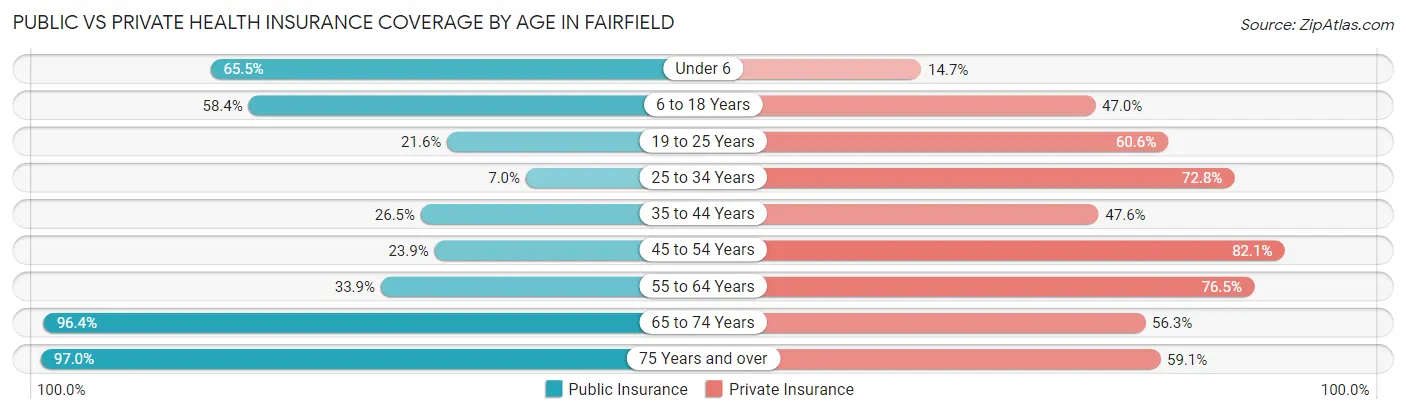
| Age Bracket | Public Insurance | Private Insurance |
| Under 6 | 467 (65.5%) | 105 (14.7%) |
| 6 to 18 Years | 1,137 (58.4%) | 915 (47.0%) |
| 19 to 25 Years | 275 (21.6%) | 772 (60.6%) |
| 25 to 34 Years | 103 (7.0%) | 1,077 (72.8%) |
| 35 to 44 Years | 201 (26.5%) | 362 (47.6%) |
| 45 to 54 Years | 194 (23.9%) | 666 (82.1%) |
| 55 to 64 Years | 475 (33.9%) | 1,072 (76.5%) |
| 65 to 74 Years | 1,028 (96.4%) | 600 (56.3%) |
| 75 Years and over | 417 (97.0%) | 254 (59.1%) |
| Total | 4,297 (43.5%) | 5,823 (58.9%) |
Disability Status by Sex by Age in Fairfield
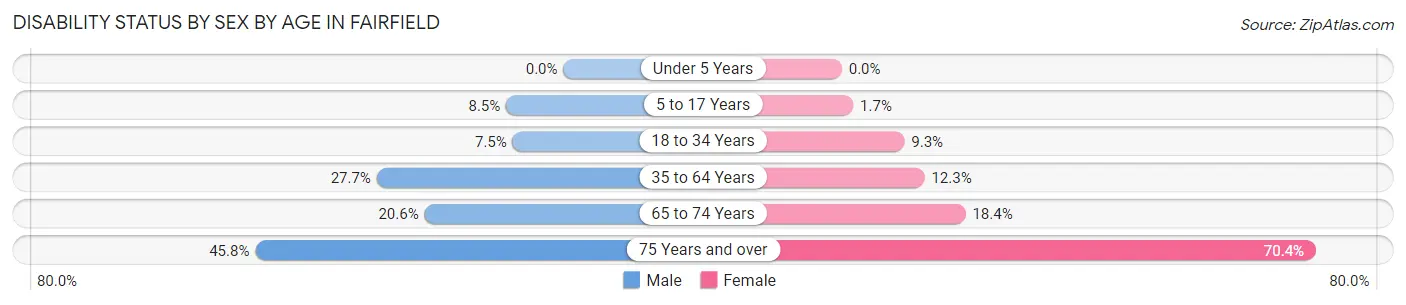
| Age Bracket | Male | Female |
| Under 5 Years | 0 (0.0%) | 0 (0.0%) |
| 5 to 17 Years | 56 (8.5%) | 18 (1.7%) |
| 18 to 34 Years | 111 (7.5%) | 150 (9.3%) |
| 35 to 64 Years | 357 (27.7%) | 207 (12.3%) |
| 65 to 74 Years | 93 (20.6%) | 113 (18.4%) |
| 75 Years and over | 70 (45.8%) | 195 (70.4%) |
Disability Class by Sex by Age in Fairfield
Disability Class: Hearing Difficulty
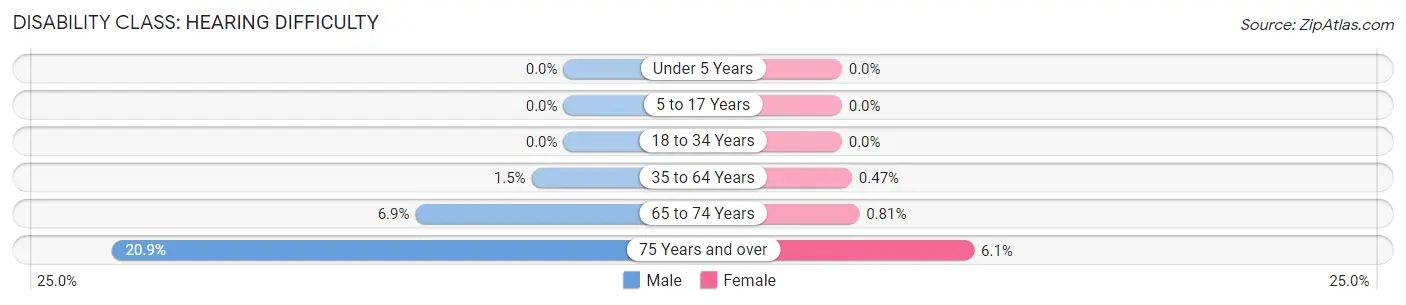
| Age Bracket | Male | Female |
| Under 5 Years | 0 (0.0%) | 0 (0.0%) |
| 5 to 17 Years | 0 (0.0%) | 0 (0.0%) |
| 18 to 34 Years | 0 (0.0%) | 0 (0.0%) |
| 35 to 64 Years | 19 (1.5%) | 8 (0.5%) |
| 65 to 74 Years | 31 (6.9%) | 5 (0.8%) |
| 75 Years and over | 32 (20.9%) | 17 (6.1%) |
Disability Class: Vision Difficulty
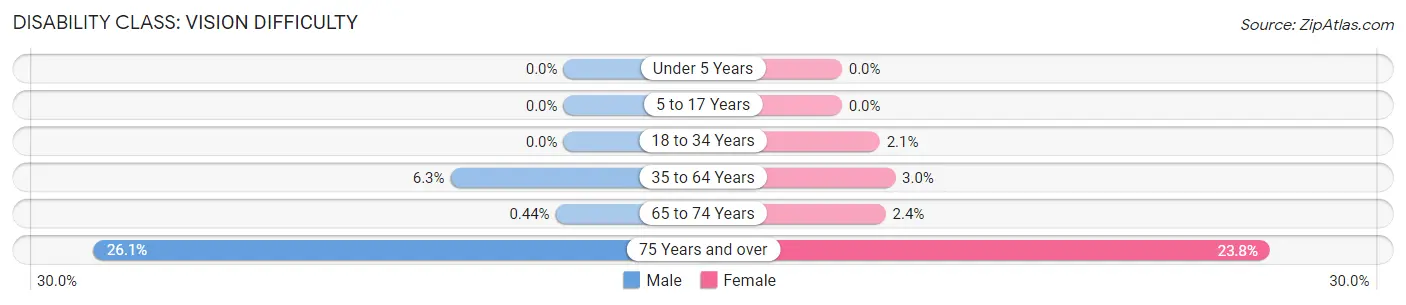
| Age Bracket | Male | Female |
| Under 5 Years | 0 (0.0%) | 0 (0.0%) |
| 5 to 17 Years | 0 (0.0%) | 0 (0.0%) |
| 18 to 34 Years | 0 (0.0%) | 34 (2.1%) |
| 35 to 64 Years | 81 (6.3%) | 50 (3.0%) |
| 65 to 74 Years | 2 (0.4%) | 15 (2.4%) |
| 75 Years and over | 40 (26.1%) | 66 (23.8%) |
Disability Class: Cognitive Difficulty
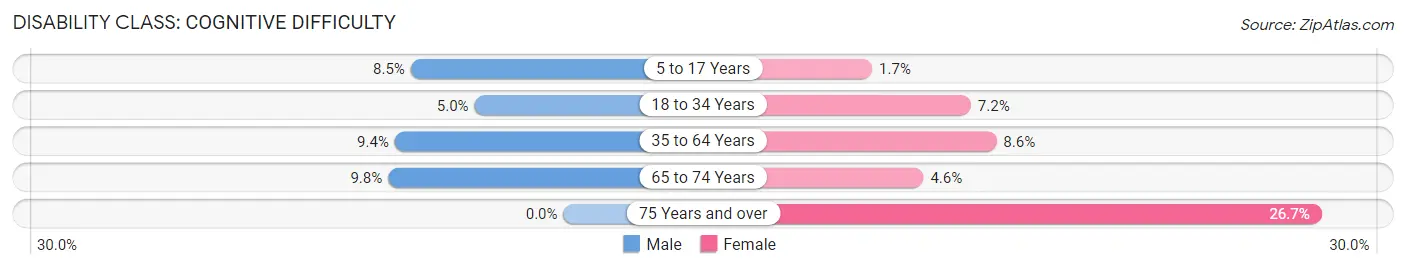
| Age Bracket | Male | Female |
| 5 to 17 Years | 56 (8.5%) | 18 (1.7%) |
| 18 to 34 Years | 73 (5.0%) | 116 (7.2%) |
| 35 to 64 Years | 121 (9.4%) | 145 (8.6%) |
| 65 to 74 Years | 44 (9.8%) | 28 (4.5%) |
| 75 Years and over | 0 (0.0%) | 74 (26.7%) |
Disability Class: Ambulatory Difficulty
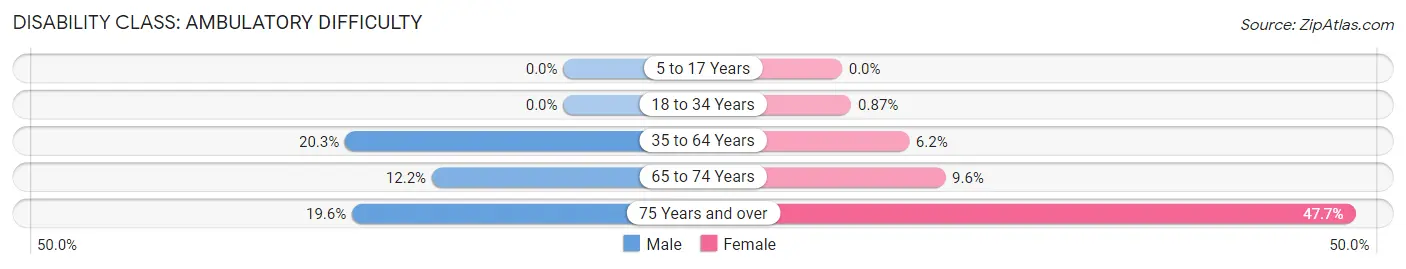
| Age Bracket | Male | Female |
| 5 to 17 Years | 0 (0.0%) | 0 (0.0%) |
| 18 to 34 Years | 0 (0.0%) | 14 (0.9%) |
| 35 to 64 Years | 261 (20.3%) | 105 (6.2%) |
| 65 to 74 Years | 55 (12.2%) | 59 (9.6%) |
| 75 Years and over | 30 (19.6%) | 132 (47.6%) |
Disability Class: Self-Care Difficulty
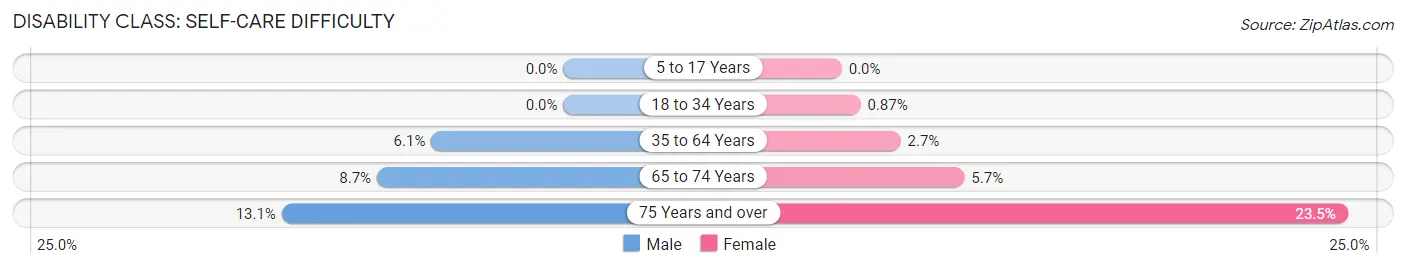
| Age Bracket | Male | Female |
| 5 to 17 Years | 0 (0.0%) | 0 (0.0%) |
| 18 to 34 Years | 0 (0.0%) | 14 (0.9%) |
| 35 to 64 Years | 79 (6.1%) | 46 (2.7%) |
| 65 to 74 Years | 39 (8.6%) | 35 (5.7%) |
| 75 Years and over | 20 (13.1%) | 65 (23.5%) |
Technology Access in Fairfield
Computing Device Access in Fairfield
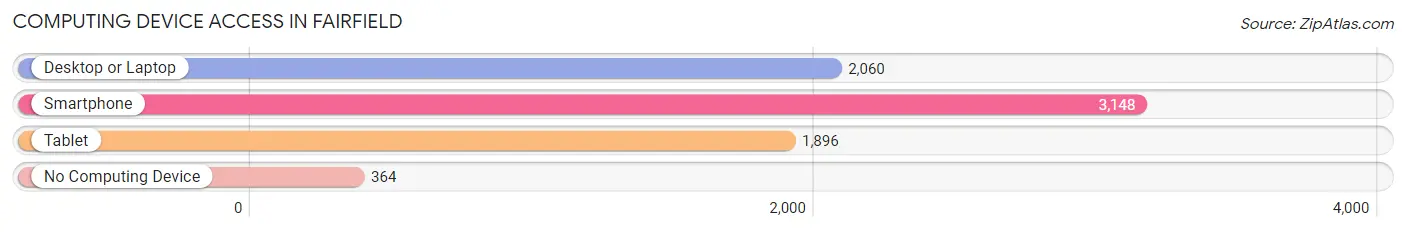
| Device Type | # Households | % Households |
| Desktop or Laptop | 2,060 | 54.4% |
| Smartphone | 3,148 | 83.2% |
| Tablet | 1,896 | 50.1% |
| No Computing Device | 364 | 9.6% |
| Total | 3,783 | 100.0% |
Internet Access in Fairfield
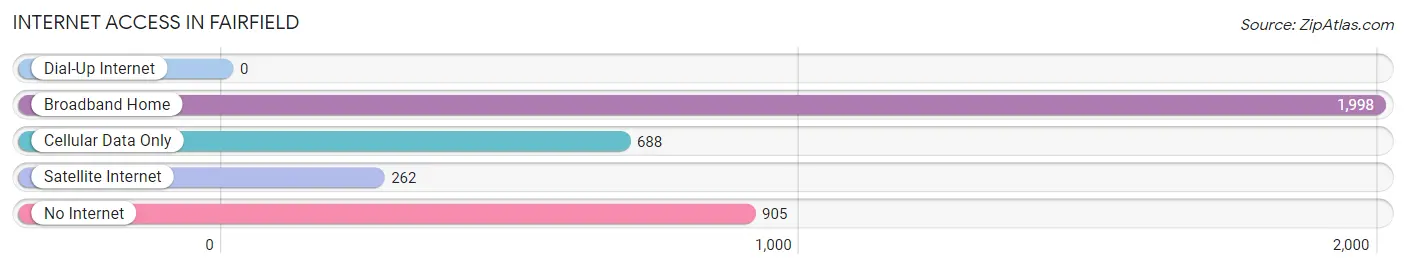
| Internet Type | # Households | % Households |
| Dial-Up Internet | 0 | 0.0% |
| Broadband Home | 1,998 | 52.8% |
| Cellular Data Only | 688 | 18.2% |
| Satellite Internet | 262 | 6.9% |
| No Internet | 905 | 23.9% |
| Total | 3,783 | 100.0% |
Fairfield Summary
Fairfield, Alabama is a city located in Jefferson County, Alabama. It is part of the Birmingham-Hoover Metropolitan Statistical Area. The city has a population of 11,117 as of the 2010 census.
History
Fairfield was founded in 1910 by the Fairfield Land Company. The company was formed by a group of investors from Birmingham, Alabama who wanted to create a new town in the area. The town was named after Fairfield, Connecticut, the hometown of one of the investors. The town was incorporated in 1911 and the first mayor was elected in 1912.
The city grew rapidly in the early 20th century due to its proximity to Birmingham and the availability of jobs in the steel and coal industries. The city was also home to a large African American population, which was drawn to the area by the promise of jobs and a better life.
In the 1950s, the city began to experience a decline in population due to the decline of the steel and coal industries. The city also experienced a decline in population due to white flight, as many white residents moved to the suburbs.
Geography
Fairfield is located in Jefferson County, Alabama. It is situated at the intersection of Interstate 20/59 and Interstate 459. The city is located approximately 10 miles west of Birmingham and 25 miles east of Tuscaloosa.
The city has a total area of 8.3 square miles, all of which is land. The city is located in the foothills of the Appalachian Mountains and is surrounded by rolling hills and forests.
Economy
The economy of Fairfield is largely based on manufacturing and retail. The city is home to several large manufacturing companies, including Vulcan Materials, U.S. Steel, and Nucor Steel. The city is also home to several retail stores, including Walmart, Target, and Lowe's.
The city is also home to several educational institutions, including Miles College, Lawson State Community College, and the University of Alabama at Birmingham.
Demographics
As of the 2010 census, the population of Fairfield was 11,117. The racial makeup of the city was 68.3% African American, 28.2% White, 0.3% Native American, 0.7% Asian, 0.1% Pacific Islander, and 2.4% from other races. Hispanic or Latino of any race were 1.7% of the population.
The median income for a household in the city was $30,945, and the median income for a family was $37,945. The per capita income for the city was $17,845. About 22.3% of families and 25.7% of the population were below the poverty line, including 36.2% of those under age 18 and 16.2% of those age 65 or over.
Common Questions
What is Per Capita Income in Fairfield?
Per Capita income in Fairfield is $23,085.
What is the Median Family Income in Fairfield?
Median Family Income in Fairfield is $54,254.
What is the Median Household income in Fairfield?
Median Household Income in Fairfield is $45,646.
What is Income or Wage Gap in Fairfield?
Income or Wage Gap in Fairfield is 15.7%.
Women in Fairfield earn 84.3 cents for every dollar earned by a man.
What is Family Income Deficit in Fairfield?
Family Income Deficit in Fairfield is $10,945.
Families that are below poverty line in Fairfield earn $10,945 less on average than the poverty threshold level.
What is Inequality or Gini Index in Fairfield?
Inequality or Gini Index in Fairfield is 0.44.
What is the Total Population of Fairfield?
Total Population of Fairfield is 9,975.
What is the Total Male Population of Fairfield?
Total Male Population of Fairfield is 4,336.
What is the Total Female Population of Fairfield?
Total Female Population of Fairfield is 5,639.
What is the Ratio of Males per 100 Females in Fairfield?
There are 76.89 Males per 100 Females in Fairfield.
What is the Ratio of Females per 100 Males in Fairfield?
There are 130.05 Females per 100 Males in Fairfield.
What is the Median Population Age in Fairfield?
Median Population Age in Fairfield is 30.7 Years.
What is the Average Family Size in Fairfield
Average Family Size in Fairfield is 3.2 People.
What is the Average Household Size in Fairfield
Average Household Size in Fairfield is 2.4 People.
How Large is the Labor Force in Fairfield?
There are 4,306 People in the Labor Forcein in Fairfield.
What is the Percentage of People in the Labor Force in Fairfield?
54.6% of People are in the Labor Force in Fairfield.
What is the Unemployment Rate in Fairfield?
Unemployment Rate in Fairfield is 8.3%.