Creola, AL
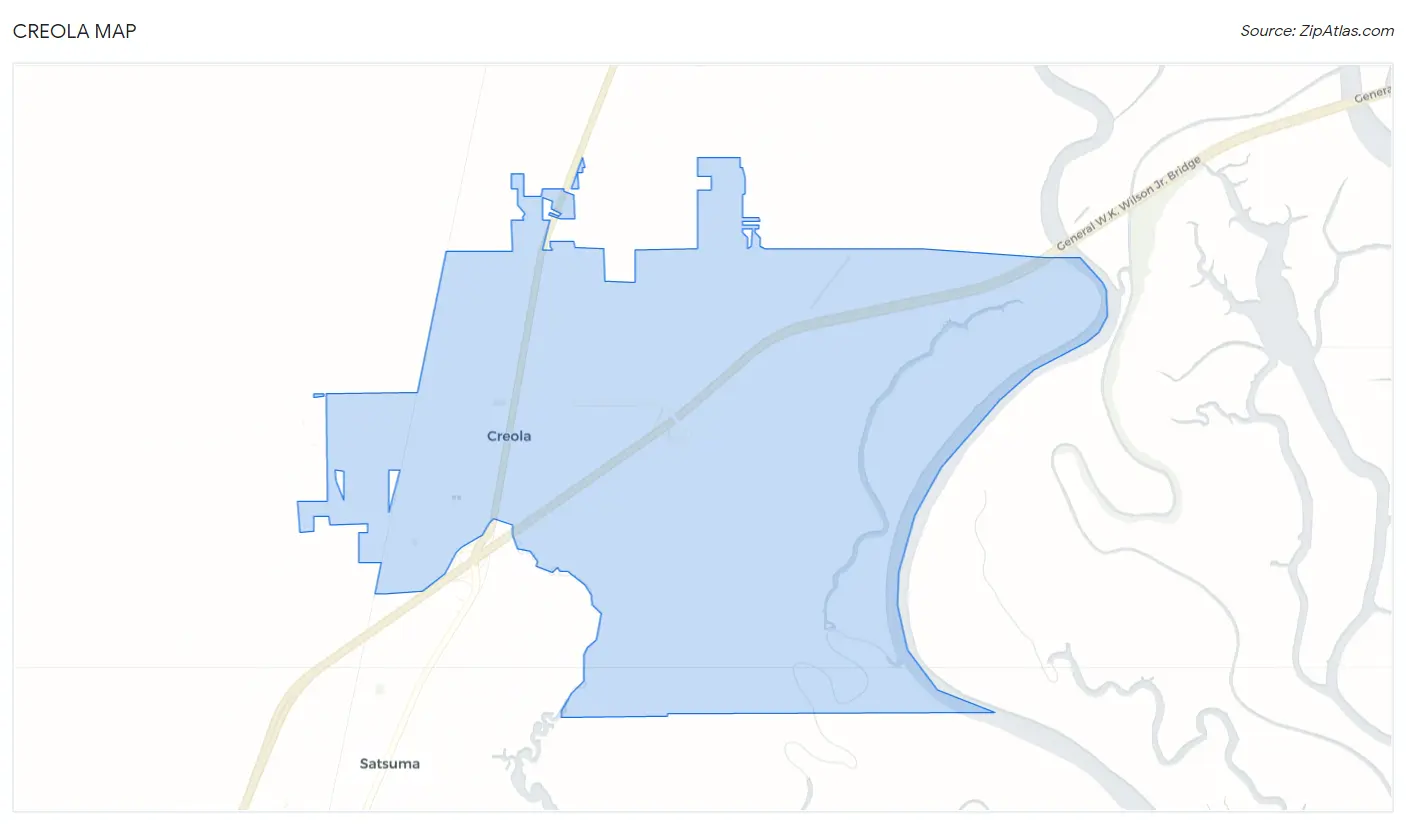
Creola Map
Creola Overview
2,428
TOTAL POPULATION
1,098
MALE POPULATION
1,330
FEMALE POPULATION
82.56
MALES / 100 FEMALES
121.13
FEMALES / 100 MALES
37.8
MEDIAN AGE
3.3
AVG FAMILY SIZE
3.0
AVG HOUSEHOLD SIZE
$27,377
PER CAPITA INCOME
$75,069
AVG FAMILY INCOME
$63,125
AVG HOUSEHOLD INCOME
39.6%
WAGE / INCOME GAP [ % ]
60.4¢/ $1
WAGE / INCOME GAP [ $ ]
0.45
INEQUALITY / GINI INDEX
948
LABOR FORCE [ PEOPLE ]
52.4%
PERCENT IN LABOR FORCE
7.0%
UNEMPLOYMENT RATE
Creola Zip Codes
Creola Area Codes
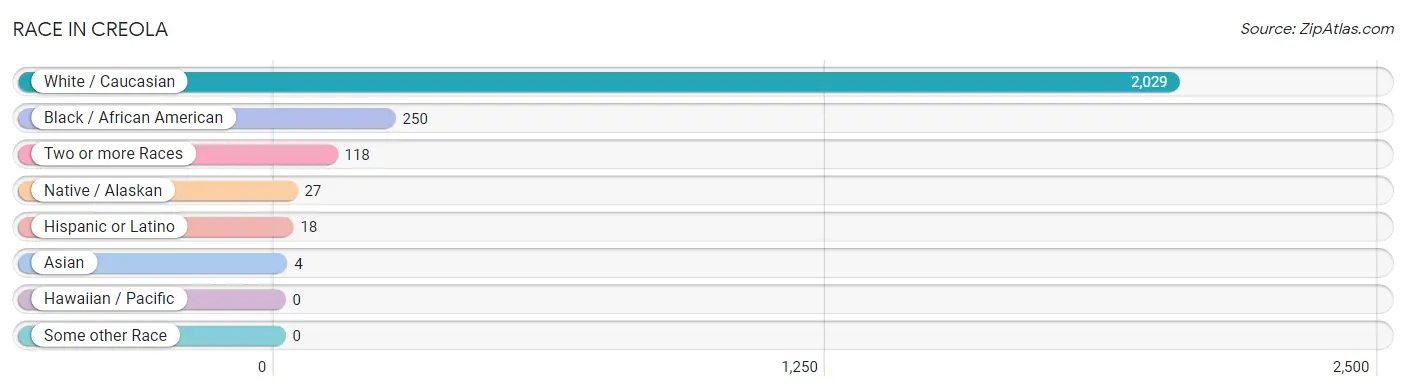
Race in Creola
The most populous races in Creola are White / Caucasian (2,029 | 83.6%), Black / African American (250 | 10.3%), and Two or more Races (118 | 4.9%).
| Race | # Population | % Population |
| Asian | 4 | 0.2% |
| Black / African American | 250 | 10.3% |
| Hawaiian / Pacific | 0 | 0.0% |
| Hispanic or Latino | 18 | 0.7% |
| Native / Alaskan | 27 | 1.1% |
| White / Caucasian | 2,029 | 83.6% |
| Two or more Races | 118 | 4.9% |
| Some other Race | 0 | 0.0% |
| Total | 2,428 | 100.0% |
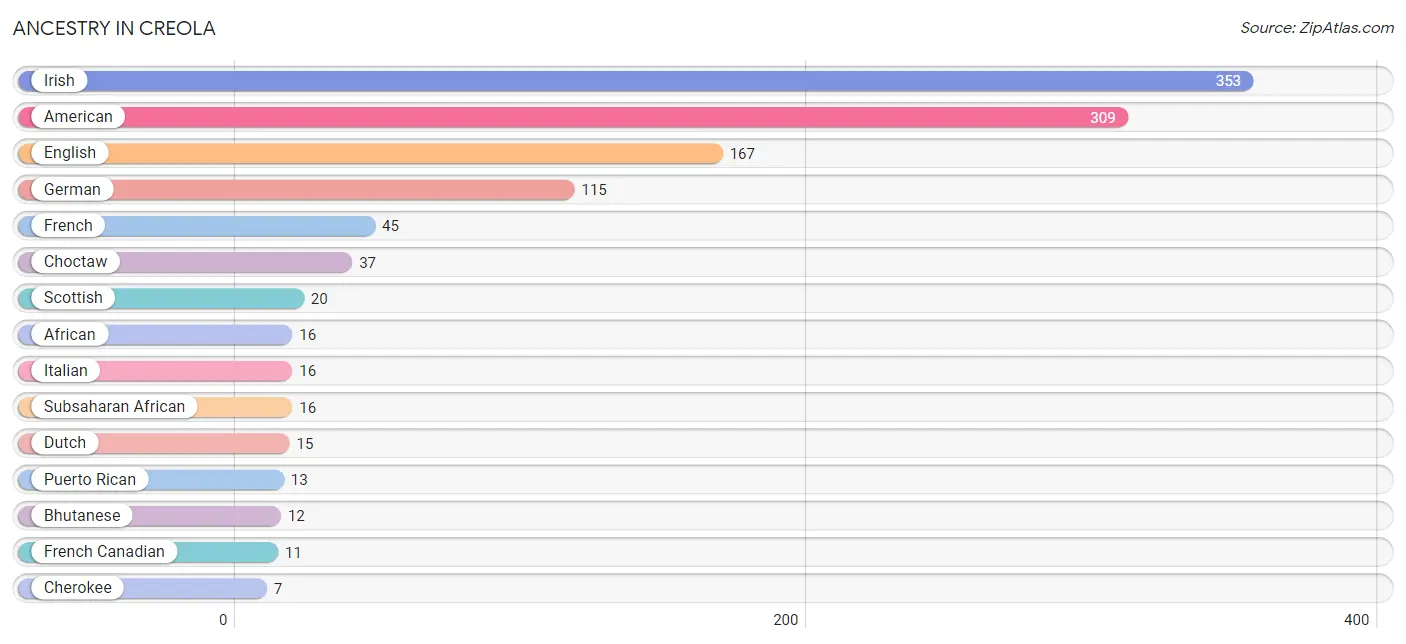
Ancestry in Creola
The most populous ancestries reported in Creola are Irish (353 | 14.5%), American (309 | 12.7%), English (167 | 6.9%), German (115 | 4.7%), and French (45 | 1.8%), together accounting for 40.7% of all Creola residents.
| Ancestry | # Population | % Population |
| African | 16 | 0.7% |
| American | 309 | 12.7% |
| Bhutanese | 12 | 0.5% |
| British | 4 | 0.2% |
| Cherokee | 7 | 0.3% |
| Choctaw | 37 | 1.5% |
| Creek | 7 | 0.3% |
| Dutch | 15 | 0.6% |
| Eastern European | 3 | 0.1% |
| English | 167 | 6.9% |
| European | 3 | 0.1% |
| French | 45 | 1.8% |
| French Canadian | 11 | 0.4% |
| German | 115 | 4.7% |
| Irish | 353 | 14.5% |
| Italian | 16 | 0.7% |
| Norwegian | 4 | 0.2% |
| Puerto Rican | 13 | 0.5% |
| Scotch-Irish | 7 | 0.3% |
| Scottish | 20 | 0.8% |
| Spanish | 5 | 0.2% |
| Subsaharan African | 16 | 0.7% | View All 22 Rows |
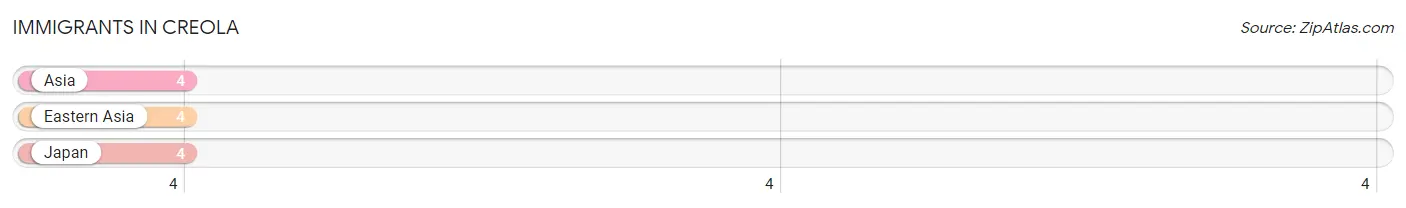
Immigrants in Creola
The most numerous immigrant groups reported in Creola came from Asia (4 | 0.2%), Eastern Asia (4 | 0.2%), and Japan (4 | 0.2%), together accounting for 0.5% of all Creola residents.
| Immigration Origin | # Population | % Population |
| Asia | 4 | 0.2% |
| Eastern Asia | 4 | 0.2% |
| Japan | 4 | 0.2% | View All 3 Rows |
Sex and Age in Creola
Sex and Age in Creola
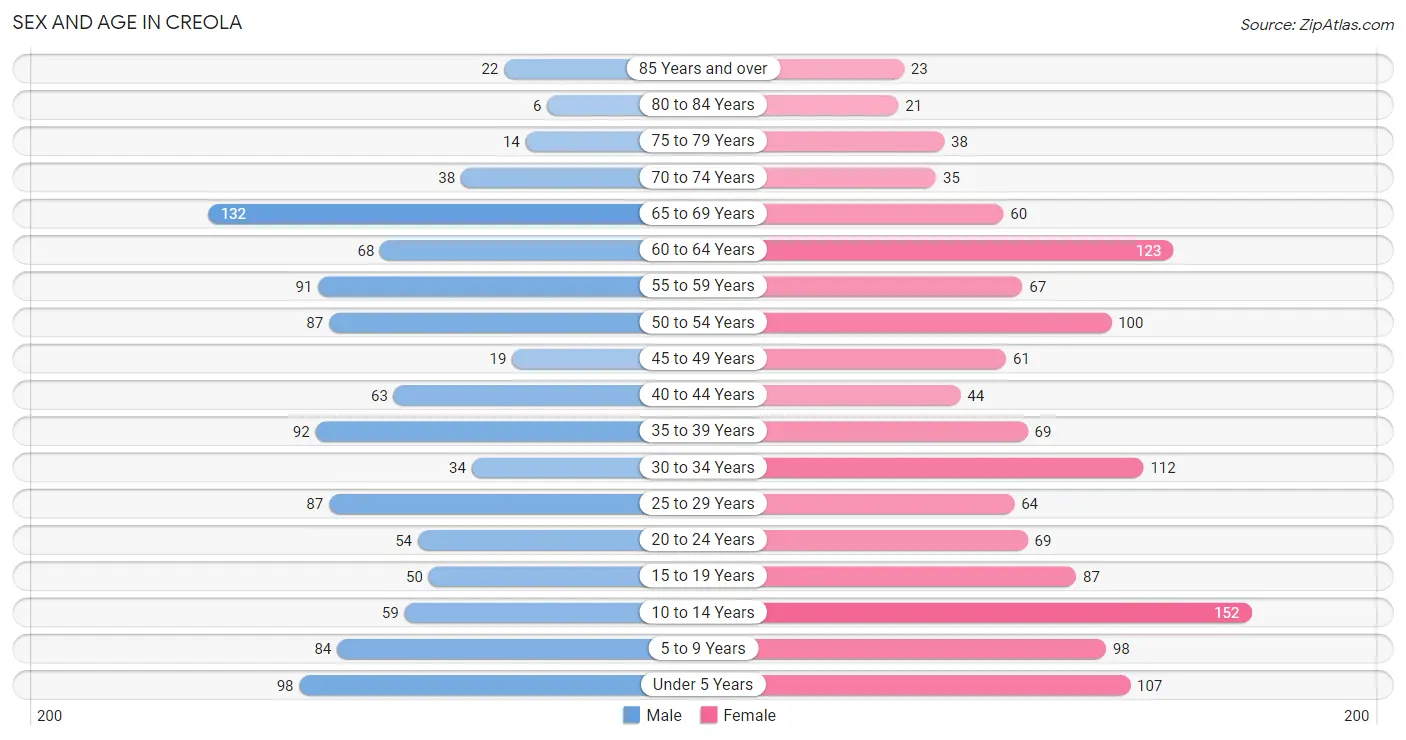
The most populous age groups in Creola are 65 to 69 Years (132 | 12.0%) for men and 10 to 14 Years (152 | 11.4%) for women.
| Age Bracket | Male | Female |
| Under 5 Years | 98 (8.9%) | 107 (8.1%) |
| 5 to 9 Years | 84 (7.6%) | 98 (7.4%) |
| 10 to 14 Years | 59 (5.4%) | 152 (11.4%) |
| 15 to 19 Years | 50 (4.5%) | 87 (6.5%) |
| 20 to 24 Years | 54 (4.9%) | 69 (5.2%) |
| 25 to 29 Years | 87 (7.9%) | 64 (4.8%) |
| 30 to 34 Years | 34 (3.1%) | 112 (8.4%) |
| 35 to 39 Years | 92 (8.4%) | 69 (5.2%) |
| 40 to 44 Years | 63 (5.7%) | 44 (3.3%) |
| 45 to 49 Years | 19 (1.7%) | 61 (4.6%) |
| 50 to 54 Years | 87 (7.9%) | 100 (7.5%) |
| 55 to 59 Years | 91 (8.3%) | 67 (5.0%) |
| 60 to 64 Years | 68 (6.2%) | 123 (9.2%) |
| 65 to 69 Years | 132 (12.0%) | 60 (4.5%) |
| 70 to 74 Years | 38 (3.5%) | 35 (2.6%) |
| 75 to 79 Years | 14 (1.3%) | 38 (2.9%) |
| 80 to 84 Years | 6 (0.5%) | 21 (1.6%) |
| 85 Years and over | 22 (2.0%) | 23 (1.7%) |
| Total | 1,098 (100.0%) | 1,330 (100.0%) |
Families and Households in Creola
Median Family Size in Creola
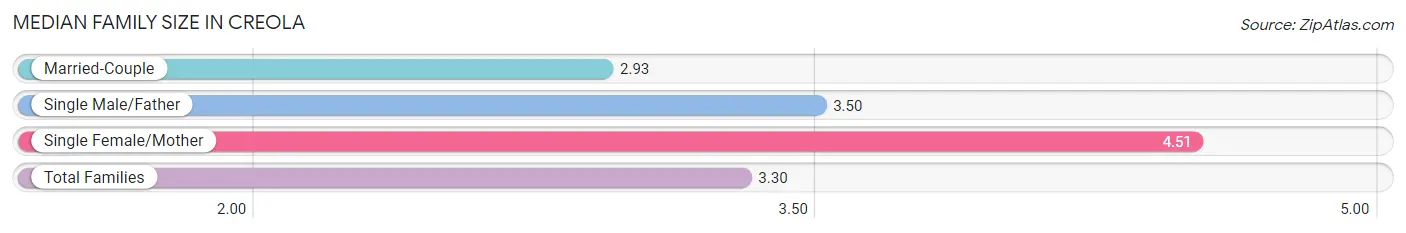
The median family size in Creola is 3.30 persons per family, with single female/mother families (142 | 22.7%) accounting for the largest median family size of 4.51 persons per family. On the other hand, married-couple families (469 | 75.0%) represent the smallest median family size with 2.93 persons per family.
| Family Type | # Families | Family Size |
| Married-Couple | 469 (75.0%) | 2.93 |
| Single Male/Father | 14 (2.2%) | 3.50 |
| Single Female/Mother | 142 (22.7%) | 4.51 |
| Total Families | 625 (100.0%) | 3.30 |
Median Household Size in Creola
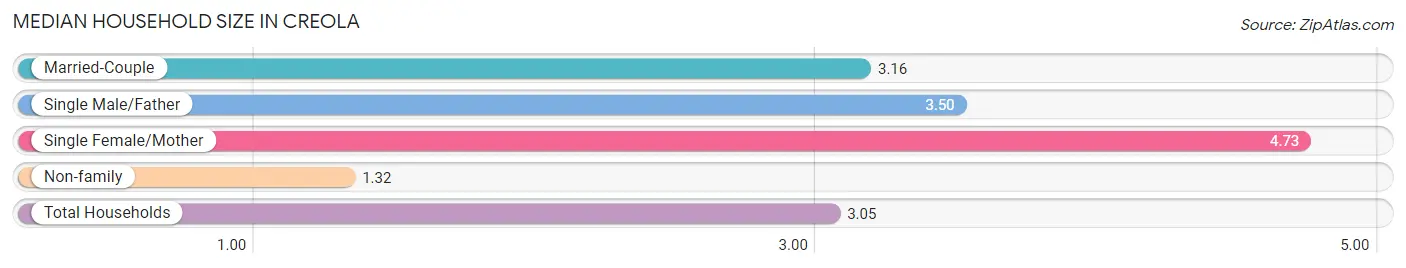
The median household size in Creola is 3.05 persons per household, with single female/mother households (142 | 17.9%) accounting for the largest median household size of 4.73 persons per household. non-family households (170 | 21.4%) represent the smallest median household size with 1.32 persons per household.
| Household Type | # Households | Household Size |
| Married-Couple | 469 (59.0%) | 3.16 |
| Single Male/Father | 14 (1.8%) | 3.50 |
| Single Female/Mother | 142 (17.9%) | 4.73 |
| Non-family | 170 (21.4%) | 1.32 |
| Total Households | 795 (100.0%) | 3.05 |
Household Size by Marriage Status in Creola
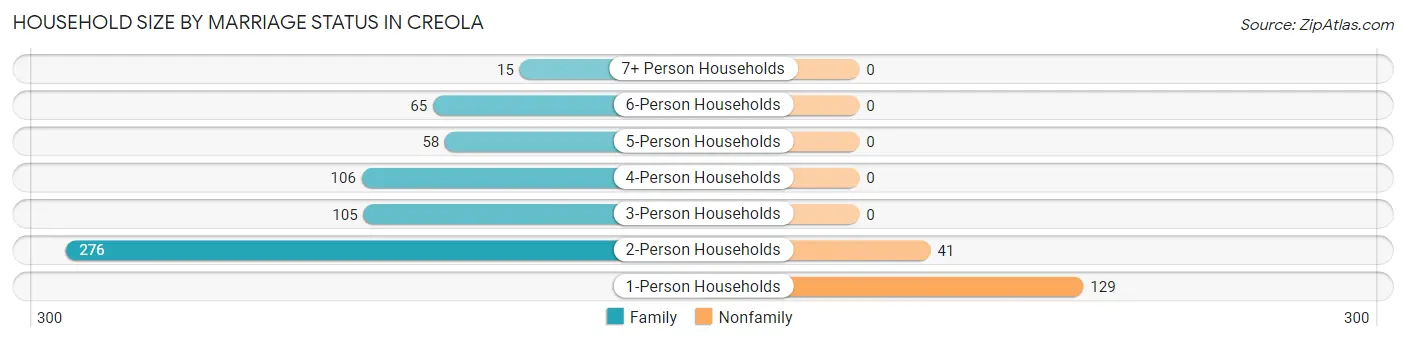
Out of a total of 795 households in Creola, 625 (78.6%) are family households, while 170 (21.4%) are nonfamily households. The most numerous type of family households are 2-person households, comprising 276, and the most common type of nonfamily households are 1-person households, comprising 129.
| Household Size | Family Households | Nonfamily Households |
| 1-Person Households | - | 129 (16.2%) |
| 2-Person Households | 276 (34.7%) | 41 (5.2%) |
| 3-Person Households | 105 (13.2%) | 0 (0.0%) |
| 4-Person Households | 106 (13.3%) | 0 (0.0%) |
| 5-Person Households | 58 (7.3%) | 0 (0.0%) |
| 6-Person Households | 65 (8.2%) | 0 (0.0%) |
| 7+ Person Households | 15 (1.9%) | 0 (0.0%) |
| Total | 625 (78.6%) | 170 (21.4%) |
Female Fertility in Creola
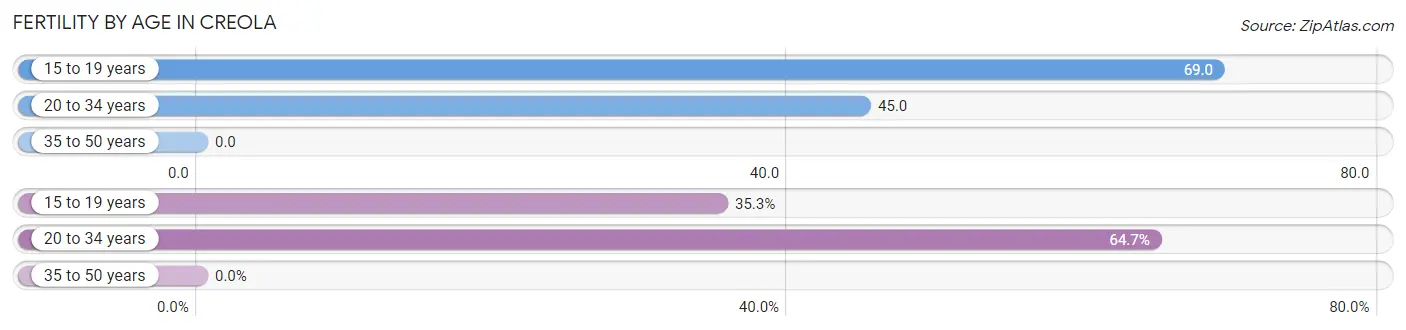
Fertility by Age in Creola
Average fertility rate in Creola is 33.0 births per 1,000 women. Women in the age bracket of 15 to 19 years have the highest fertility rate with 69.0 births per 1,000 women. Women in the age bracket of 20 to 34 years acount for 64.7% of all women with births.
| Age Bracket | Women with Births | Births / 1,000 Women |
| 15 to 19 years | 6 (35.3%) | 69.0 |
| 20 to 34 years | 11 (64.7%) | 45.0 |
| 35 to 50 years | 0 (0.0%) | 0.0 |
| Total | 17 (100.0%) | 33.0 |
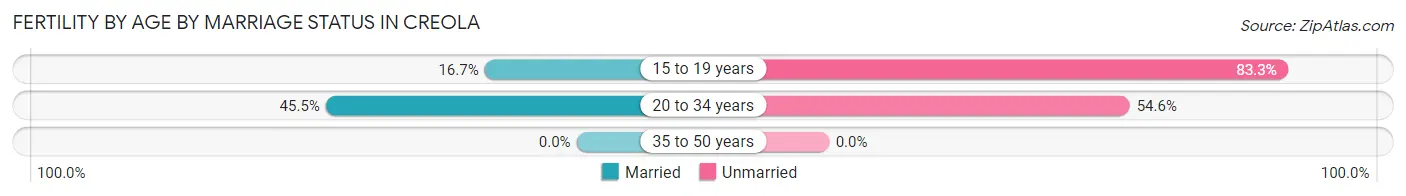
Fertility by Age by Marriage Status in Creola
35.3% of women with births (17) in Creola are married. The highest percentage of unmarried women with births falls into 15 to 19 years age bracket with 83.3% of them unmarried at the time of birth, while the lowest percentage of unmarried women with births belong to 20 to 34 years age bracket with 54.5% of them unmarried.
| Age Bracket | Married | Unmarried |
| 15 to 19 years | 1 (16.7%) | 5 (83.3%) |
| 20 to 34 years | 5 (45.5%) | 6 (54.5%) |
| 35 to 50 years | 0 (0.0%) | 0 (0.0%) |
| Total | 6 (35.3%) | 11 (64.7%) |
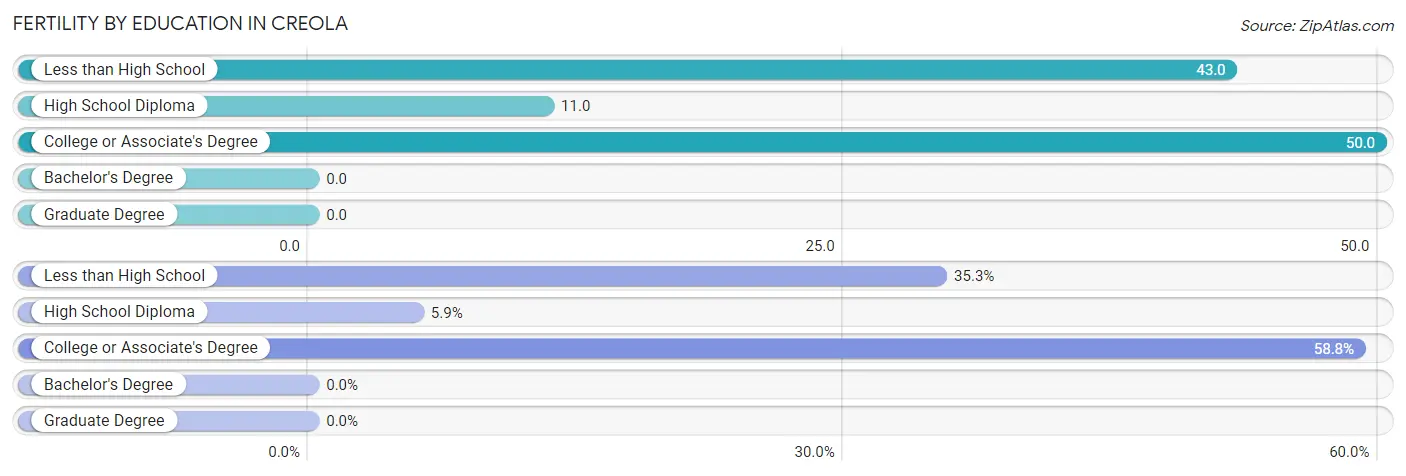
Fertility by Education in Creola
| Educational Attainment | Women with Births | Births / 1,000 Women |
| Less than High School | 6 (35.3%) | 43.0 |
| High School Diploma | 1 (5.9%) | 11.0 |
| College or Associate's Degree | 10 (58.8%) | 50.0 |
| Bachelor's Degree | 0 (0.0%) | 0.0 |
| Graduate Degree | 0 (0.0%) | 0.0 |
| Total | 17 (100.0%) | 33.0 |
Fertility by Education by Marriage Status in Creola
64.7% of women with births in Creola are unmarried. Women with the educational attainment of high school diploma are most likely to be married with 100.0% of them married at childbirth, while women with the educational attainment of less than high school are least likely to be married with 100.0% of them unmarried at childbirth.
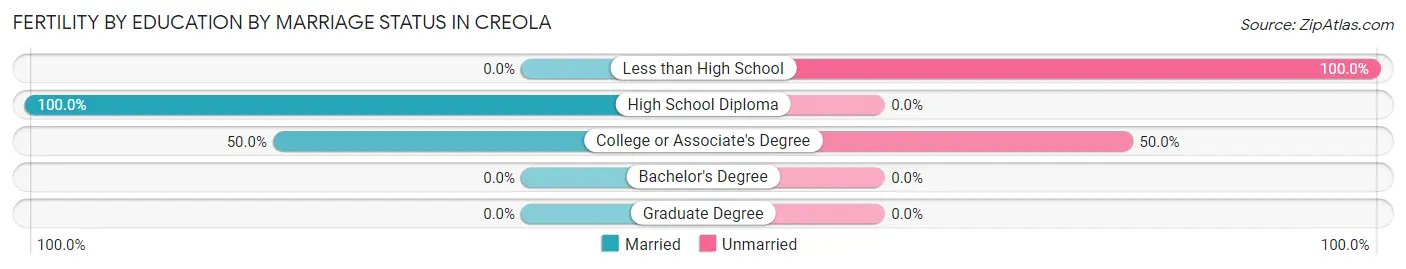
| Educational Attainment | Married | Unmarried |
| Less than High School | 0 (0.0%) | 6 (100.0%) |
| High School Diploma | 1 (100.0%) | 0 (0.0%) |
| College or Associate's Degree | 5 (50.0%) | 5 (50.0%) |
| Bachelor's Degree | 0 (0.0%) | 0 (0.0%) |
| Graduate Degree | 0 (0.0%) | 0 (0.0%) |
| Total | 6 (35.3%) | 11 (64.7%) |
Income in Creola
Income Overview in Creola
Per Capita Income in Creola is $27,377, while median incomes of families and households are $75,069 and $63,125 respectively.
| Characteristic | Number | Measure |
| Per Capita Income | 2,428 | $27,377 |
| Median Family Income | 625 | $75,069 |
| Mean Family Income | 625 | $90,701 |
| Median Household Income | 795 | $63,125 |
| Mean Household Income | 795 | $81,189 |
| Income Deficit | 625 | $0 |
| Wage / Income Gap (%) | 2,428 | 39.57% |
| Wage / Income Gap ($) | 2,428 | 60.43¢ per $1 |
| Gini / Inequality Index | 2,428 | 0.45 |
Earnings by Sex in Creola
Average Earnings in Creola are $40,938, $59,333 for men and $35,855 for women, a difference of 39.6%.
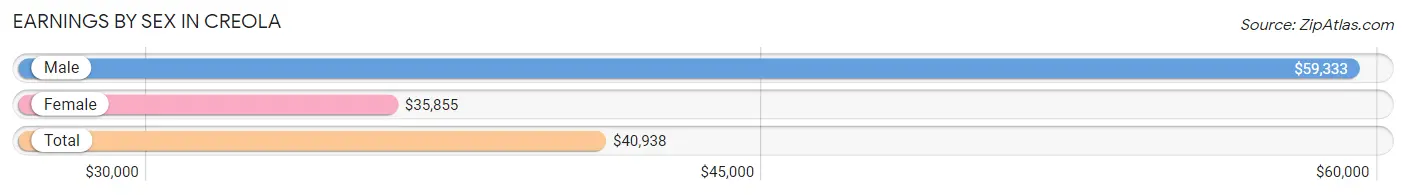
| Sex | Number | Average Earnings |
| Male | 462 (48.4%) | $59,333 |
| Female | 492 (51.6%) | $35,855 |
| Total | 954 (100.0%) | $40,938 |
Earnings by Sex by Income Bracket in Creola
The most common earnings brackets in Creola are $75,000 to $99,999 for men (103 | 22.3%) and $35,000 to $39,999 for women (80 | 16.3%).
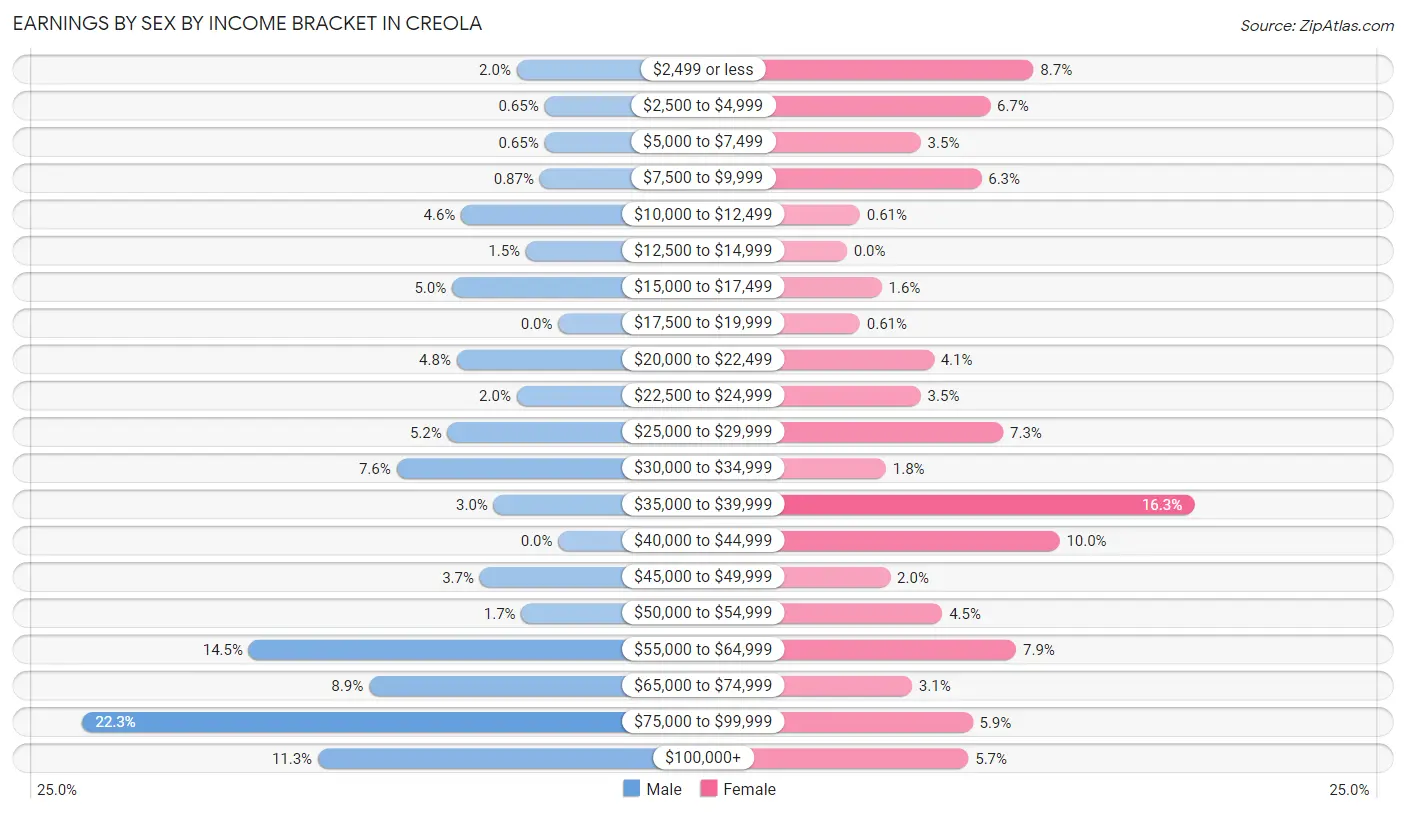
| Income | Male | Female |
| $2,499 or less | 9 (1.9%) | 43 (8.7%) |
| $2,500 to $4,999 | 3 (0.6%) | 33 (6.7%) |
| $5,000 to $7,499 | 3 (0.6%) | 17 (3.5%) |
| $7,500 to $9,999 | 4 (0.9%) | 31 (6.3%) |
| $10,000 to $12,499 | 21 (4.5%) | 3 (0.6%) |
| $12,500 to $14,999 | 7 (1.5%) | 0 (0.0%) |
| $15,000 to $17,499 | 23 (5.0%) | 8 (1.6%) |
| $17,500 to $19,999 | 0 (0.0%) | 3 (0.6%) |
| $20,000 to $22,499 | 22 (4.8%) | 20 (4.1%) |
| $22,500 to $24,999 | 9 (1.9%) | 17 (3.5%) |
| $25,000 to $29,999 | 24 (5.2%) | 36 (7.3%) |
| $30,000 to $34,999 | 35 (7.6%) | 9 (1.8%) |
| $35,000 to $39,999 | 14 (3.0%) | 80 (16.3%) |
| $40,000 to $44,999 | 0 (0.0%) | 49 (10.0%) |
| $45,000 to $49,999 | 17 (3.7%) | 10 (2.0%) |
| $50,000 to $54,999 | 8 (1.7%) | 22 (4.5%) |
| $55,000 to $64,999 | 67 (14.5%) | 39 (7.9%) |
| $65,000 to $74,999 | 41 (8.9%) | 15 (3.0%) |
| $75,000 to $99,999 | 103 (22.3%) | 29 (5.9%) |
| $100,000+ | 52 (11.3%) | 28 (5.7%) |
| Total | 462 (100.0%) | 492 (100.0%) |
Earnings by Sex by Educational Attainment in Creola
Average earnings in Creola are $65,000 for men and $35,822 for women, a difference of 44.9%. Men with an educational attainment of less than high school enjoy the highest average annual earnings of $78,326, while those with high school diploma education earn the least with $54,375. Women with an educational attainment of graduate degree earn the most with the average annual earnings of $60,417, while those with high school diploma education have the smallest earnings of $29,850.
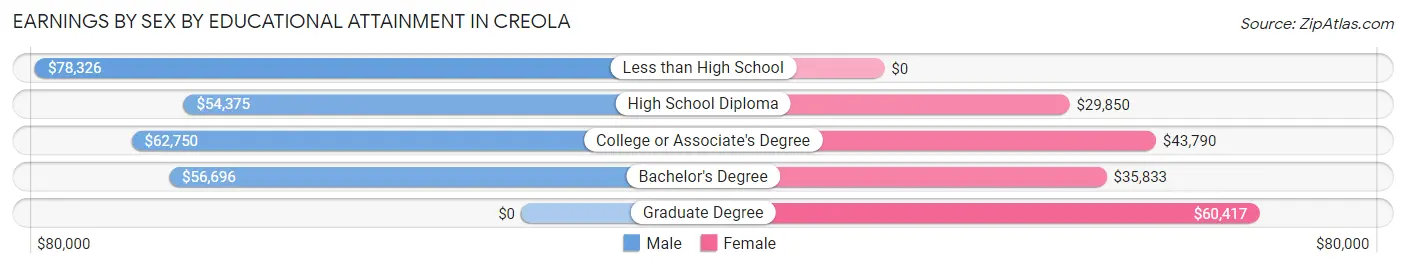
| Educational Attainment | Male Income | Female Income |
| Less than High School | $78,326 | $0 |
| High School Diploma | $54,375 | $29,850 |
| College or Associate's Degree | $62,750 | $43,790 |
| Bachelor's Degree | $56,696 | $35,833 |
| Graduate Degree | - | - |
| Total | $65,000 | $35,822 |
Family Income in Creola
Family Income Brackets in Creola
According to the Creola family income data, there are 136 families falling into the $100,000 to $149,999 income range, which is the most common income bracket and makes up 21.8% of all families.
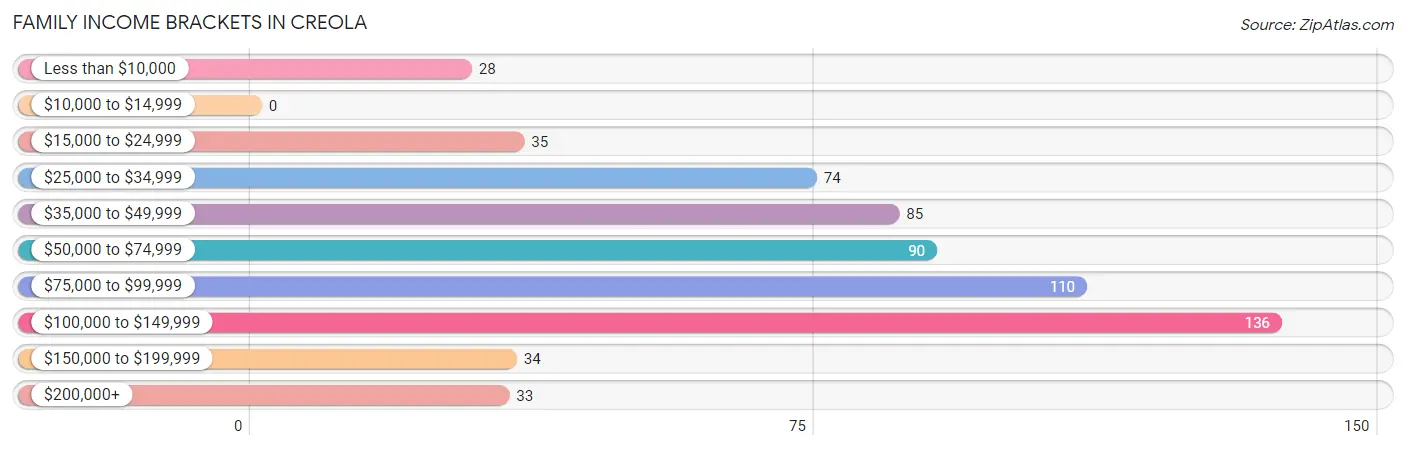
| Income Bracket | # Families | % Families |
| Less than $10,000 | 28 | 4.5% |
| $10,000 to $14,999 | 0 | 0.0% |
| $15,000 to $24,999 | 35 | 5.6% |
| $25,000 to $34,999 | 74 | 11.8% |
| $35,000 to $49,999 | 85 | 13.6% |
| $50,000 to $74,999 | 90 | 14.4% |
| $75,000 to $99,999 | 110 | 17.6% |
| $100,000 to $149,999 | 136 | 21.8% |
| $150,000 to $199,999 | 34 | 5.4% |
| $200,000+ | 33 | 5.3% |
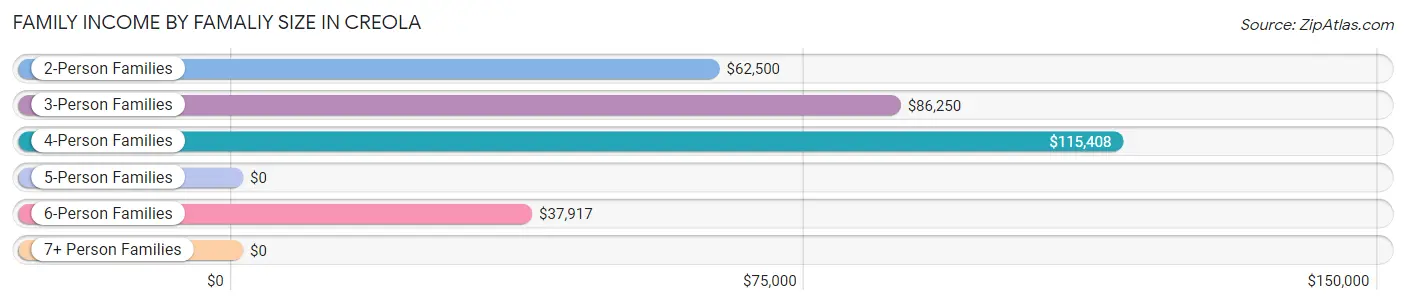
Family Income by Famaliy Size in Creola
4-person families (164 | 26.2%) account for the highest median family income in Creola with $115,408 per family, while 2-person families (286 | 45.8%) have the highest median income of $31,250 per family member.
| Income Bracket | # Families | Median Income |
| 2-Person Families | 286 (45.8%) | $62,500 |
| 3-Person Families | 95 (15.2%) | $86,250 |
| 4-Person Families | 164 (26.2%) | $115,408 |
| 5-Person Families | 49 (7.8%) | $0 |
| 6-Person Families | 20 (3.2%) | $37,917 |
| 7+ Person Families | 11 (1.8%) | $0 |
| Total | 625 (100.0%) | $75,069 |
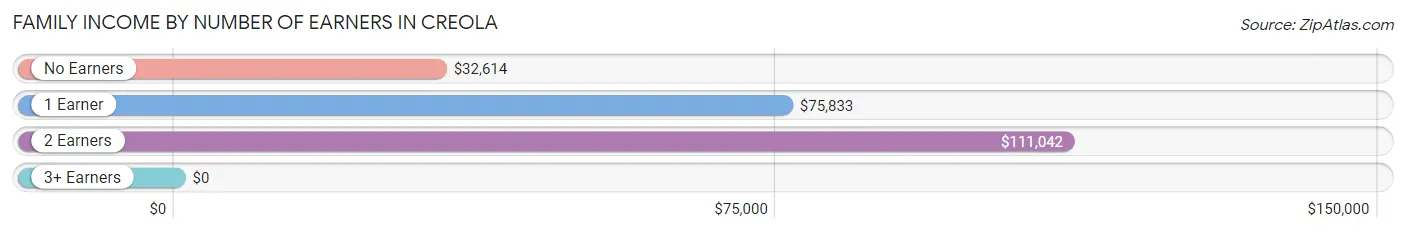
Family Income by Number of Earners in Creola
| Number of Earners | # Families | Median Income |
| No Earners | 155 (24.8%) | $32,614 |
| 1 Earner | 202 (32.3%) | $75,833 |
| 2 Earners | 243 (38.9%) | $111,042 |
| 3+ Earners | 25 (4.0%) | $0 |
| Total | 625 (100.0%) | $75,069 |
Household Income in Creola
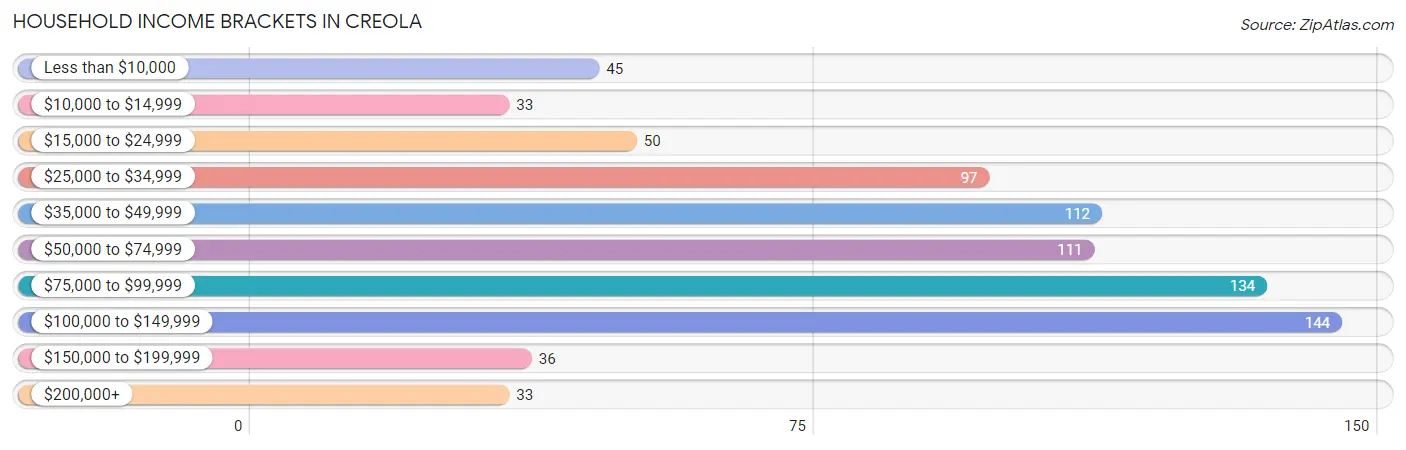
Household Income Brackets in Creola
With 144 households falling in the category, the $100,000 to $149,999 income range is the most frequent in Creola, accounting for 18.1% of all households. In contrast, only 33 households (4.2%) fall into the $10,000 to $14,999 income bracket, making it the least populous group.
| Income Bracket | # Households | % Households |
| Less than $10,000 | 45 | 5.7% |
| $10,000 to $14,999 | 33 | 4.2% |
| $15,000 to $24,999 | 50 | 6.3% |
| $25,000 to $34,999 | 97 | 12.2% |
| $35,000 to $49,999 | 112 | 14.1% |
| $50,000 to $74,999 | 111 | 14.0% |
| $75,000 to $99,999 | 134 | 16.9% |
| $100,000 to $149,999 | 144 | 18.1% |
| $150,000 to $199,999 | 36 | 4.5% |
| $200,000+ | 33 | 4.2% |
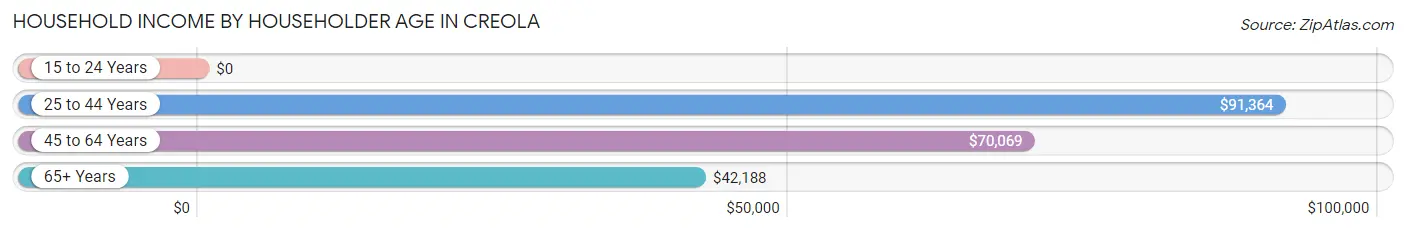
Household Income by Householder Age in Creola
The median household income in Creola is $63,125, with the highest median household income of $91,364 found in the 25 to 44 years age bracket for the primary householder. A total of 238 households (29.9%) fall into this category. Meanwhile, the 15 to 24 years age bracket for the primary householder has the lowest median household income of $0, with 21 households (2.6%) in this group.
| Income Bracket | # Households | Median Income |
| 15 to 24 Years | 21 (2.6%) | $0 |
| 25 to 44 Years | 238 (29.9%) | $91,364 |
| 45 to 64 Years | 347 (43.6%) | $70,069 |
| 65+ Years | 189 (23.8%) | $42,188 |
| Total | 795 (100.0%) | $63,125 |
Poverty in Creola
Income Below Poverty by Sex and Age in Creola
With 21.8% poverty level for males and 31.2% for females among the residents of Creola, under 5 year old males and 15 year old females are the most vulnerable to poverty, with 58 males (59.2%) and 4 females (100.0%) in their respective age groups living below the poverty level.
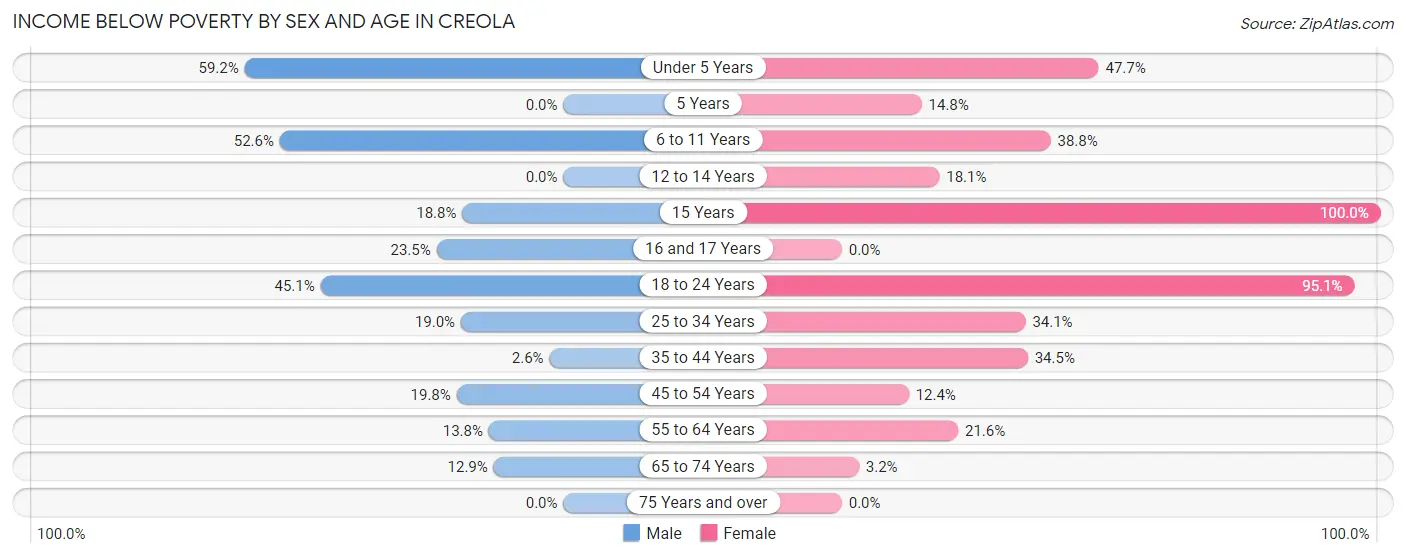
| Age Bracket | Male | Female |
| Under 5 Years | 58 (59.2%) | 51 (47.7%) |
| 5 Years | 0 (0.0%) | 8 (14.8%) |
| 6 to 11 Years | 50 (52.6%) | 31 (38.8%) |
| 12 to 14 Years | 0 (0.0%) | 21 (18.1%) |
| 15 Years | 3 (18.8%) | 4 (100.0%) |
| 16 and 17 Years | 4 (23.5%) | 0 (0.0%) |
| 18 to 24 Years | 32 (45.1%) | 137 (95.1%) |
| 25 to 34 Years | 23 (19.0%) | 60 (34.1%) |
| 35 to 44 Years | 4 (2.6%) | 39 (34.5%) |
| 45 to 54 Years | 21 (19.8%) | 20 (12.4%) |
| 55 to 64 Years | 22 (13.8%) | 41 (21.6%) |
| 65 to 74 Years | 22 (12.9%) | 3 (3.2%) |
| 75 Years and over | 0 (0.0%) | 0 (0.0%) |
| Total | 239 (21.8%) | 415 (31.2%) |
Income Above Poverty by Sex and Age in Creola
According to the poverty statistics in Creola, males aged 5 years and females aged 16 and 17 years are the age groups that are most secure financially, with 100.0% of males and 100.0% of females in these age groups living above the poverty line.
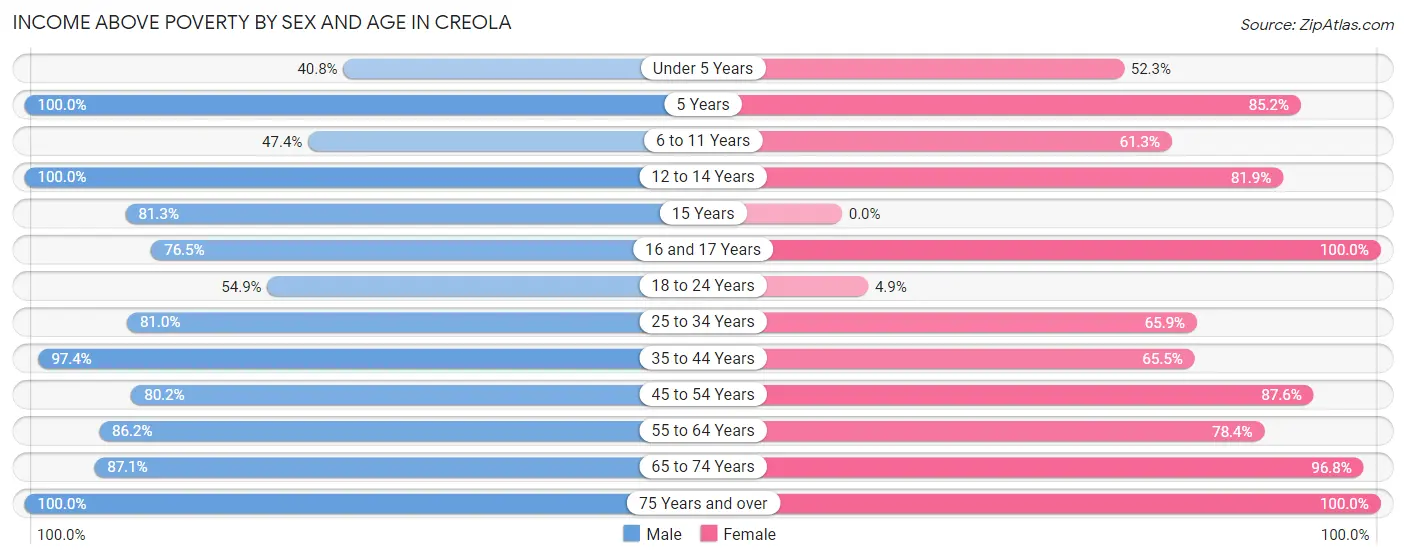
| Age Bracket | Male | Female |
| Under 5 Years | 40 (40.8%) | 56 (52.3%) |
| 5 Years | 24 (100.0%) | 46 (85.2%) |
| 6 to 11 Years | 45 (47.4%) | 49 (61.3%) |
| 12 to 14 Years | 24 (100.0%) | 95 (81.9%) |
| 15 Years | 13 (81.2%) | 0 (0.0%) |
| 16 and 17 Years | 13 (76.5%) | 8 (100.0%) |
| 18 to 24 Years | 39 (54.9%) | 7 (4.9%) |
| 25 to 34 Years | 98 (81.0%) | 116 (65.9%) |
| 35 to 44 Years | 151 (97.4%) | 74 (65.5%) |
| 45 to 54 Years | 85 (80.2%) | 141 (87.6%) |
| 55 to 64 Years | 137 (86.2%) | 149 (78.4%) |
| 65 to 74 Years | 148 (87.1%) | 92 (96.8%) |
| 75 Years and over | 42 (100.0%) | 82 (100.0%) |
| Total | 859 (78.2%) | 915 (68.8%) |
Income Below Poverty Among Married-Couple Families in Creola
The poverty statistics for married-couple families in Creola show that 1.7% or 8 of the total 469 families live below the poverty line. Families with 3 or 4 children have the highest poverty rate of 100.0%, comprising of 4 families. On the other hand, families with no children have the lowest poverty rate of 0.0%, which includes 0 families.
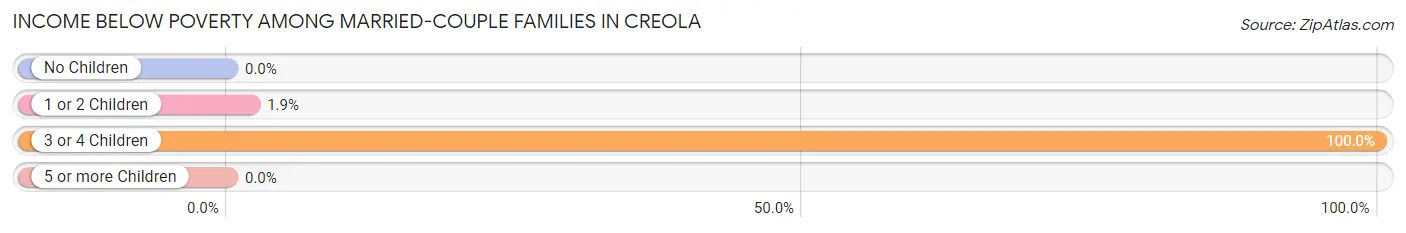
| Children | Above Poverty | Below Poverty |
| No Children | 258 (100.0%) | 0 (0.0%) |
| 1 or 2 Children | 203 (98.1%) | 4 (1.9%) |
| 3 or 4 Children | 0 (0.0%) | 4 (100.0%) |
| 5 or more Children | 0 (0.0%) | 0 (0.0%) |
| Total | 461 (98.3%) | 8 (1.7%) |
Income Below Poverty Among Single-Parent Households in Creola
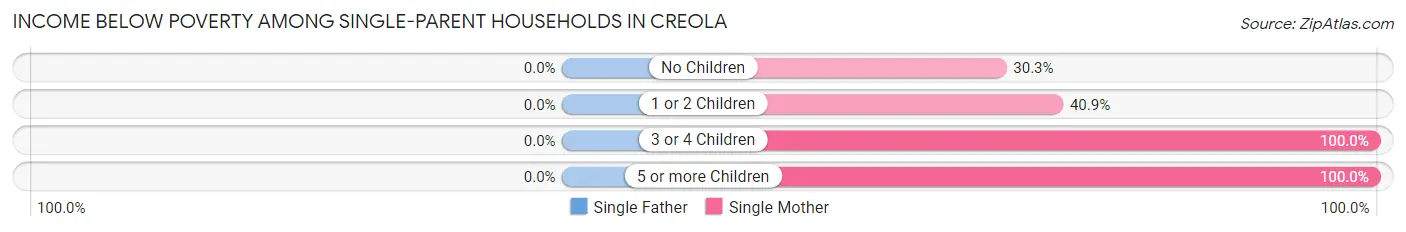
| Children | Single Father | Single Mother |
| No Children | 0 (0.0%) | 10 (30.3%) |
| 1 or 2 Children | 0 (0.0%) | 29 (40.8%) |
| 3 or 4 Children | 0 (0.0%) | 27 (100.0%) |
| 5 or more Children | 0 (0.0%) | 11 (100.0%) |
| Total | 0 (0.0%) | 77 (54.2%) |
Income Below Poverty Among Married-Couple vs Single-Parent Households in Creola
The poverty data for Creola shows that 8 of the married-couple family households (1.7%) and 77 of the single-parent households (49.4%) are living below the poverty level. Within the married-couple family households, those with 3 or 4 children have the highest poverty rate, with 4 households (100.0%) falling below the poverty line. Among the single-parent households, those with 3 or 4 children have the highest poverty rate, with 27 household (100.0%) living below poverty.
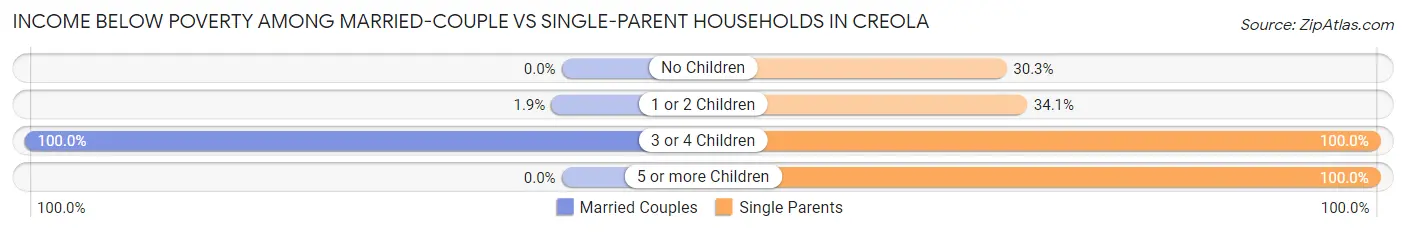
| Children | Married-Couple Families | Single-Parent Households |
| No Children | 0 (0.0%) | 10 (30.3%) |
| 1 or 2 Children | 4 (1.9%) | 29 (34.1%) |
| 3 or 4 Children | 4 (100.0%) | 27 (100.0%) |
| 5 or more Children | 0 (0.0%) | 11 (100.0%) |
| Total | 8 (1.7%) | 77 (49.4%) |
Employment Characteristics in Creola
Employment by Class of Employer in Creola
Among the 873 employed individuals in Creola, private company employees (562 | 64.4%), not-for-profit organizations (134 | 15.3%), and local government employees (58 | 6.6%) make up the most common classes of employment.
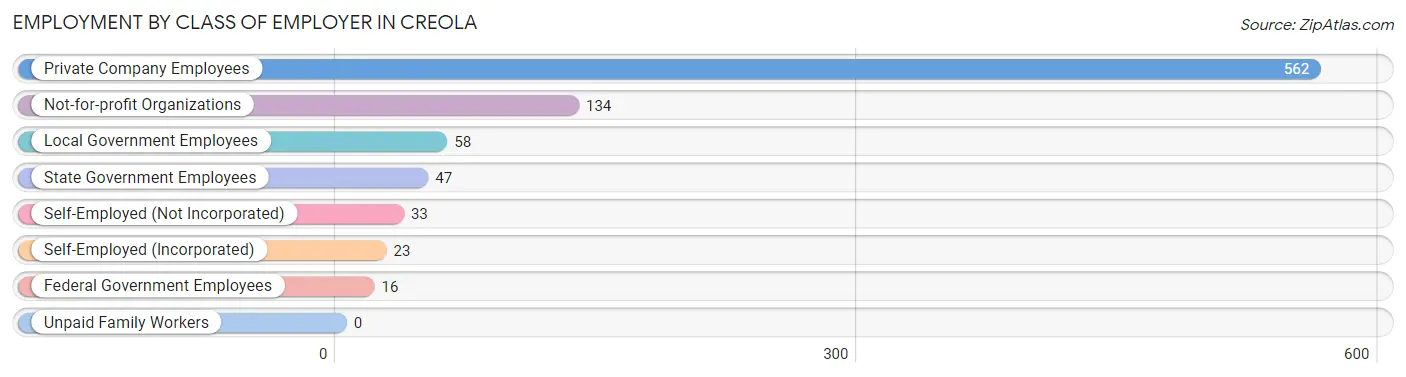
| Employer Class | # Employees | % Employees |
| Private Company Employees | 562 | 64.4% |
| Self-Employed (Incorporated) | 23 | 2.6% |
| Self-Employed (Not Incorporated) | 33 | 3.8% |
| Not-for-profit Organizations | 134 | 15.3% |
| Local Government Employees | 58 | 6.6% |
| State Government Employees | 47 | 5.4% |
| Federal Government Employees | 16 | 1.8% |
| Unpaid Family Workers | 0 | 0.0% |
| Total | 873 | 100.0% |
Employment Status by Age in Creola
According to the labor force statistics for Creola, out of the total population over 16 years of age (1,810), 52.4% or 948 individuals are in the labor force, with 7.0% or 66 of them unemployed. The age group with the highest labor force participation rate is 35 to 44 years, with 83.2% or 223 individuals in the labor force. Within the labor force, the 25 to 29 years age range has the highest percentage of unemployed individuals, with 40.0% or 48 of them being unemployed.
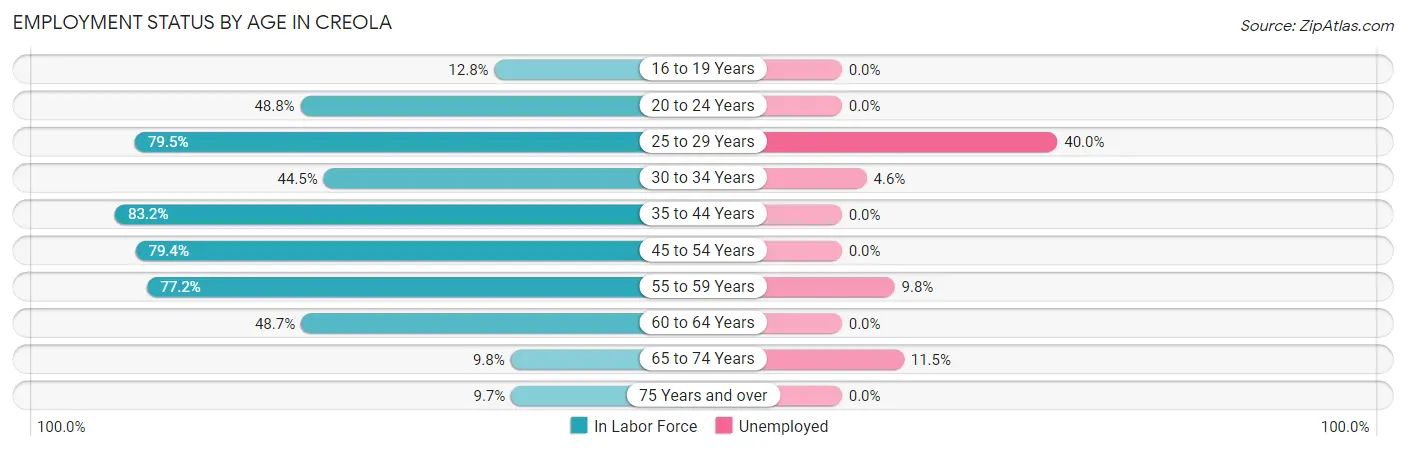
| Age Bracket | In Labor Force | Unemployed |
| 16 to 19 Years | 15 (12.8%) | 0 (0.0%) |
| 20 to 24 Years | 60 (48.8%) | 0 (0.0%) |
| 25 to 29 Years | 120 (79.5%) | 48 (40.0%) |
| 30 to 34 Years | 65 (44.5%) | 3 (4.6%) |
| 35 to 44 Years | 223 (83.2%) | 0 (0.0%) |
| 45 to 54 Years | 212 (79.4%) | 0 (0.0%) |
| 55 to 59 Years | 122 (77.2%) | 12 (9.8%) |
| 60 to 64 Years | 93 (48.7%) | 0 (0.0%) |
| 65 to 74 Years | 26 (9.8%) | 3 (11.5%) |
| 75 Years and over | 12 (9.7%) | 0 (0.0%) |
| Total | 948 (52.4%) | 66 (7.0%) |
Employment Status by Educational Attainment in Creola
According to labor force statistics for Creola, 70.7% of individuals (835) out of the total population between 25 and 64 years of age (1,181) are in the labor force, with 7.5% or 63 of them being unemployed. The group with the highest labor force participation rate are those with the educational attainment of bachelor's degree or higher, with 79.8% or 130 individuals in the labor force. Within the labor force, individuals with less than high school education have the highest percentage of unemployment, with 24.8% or 35 of them being unemployed.
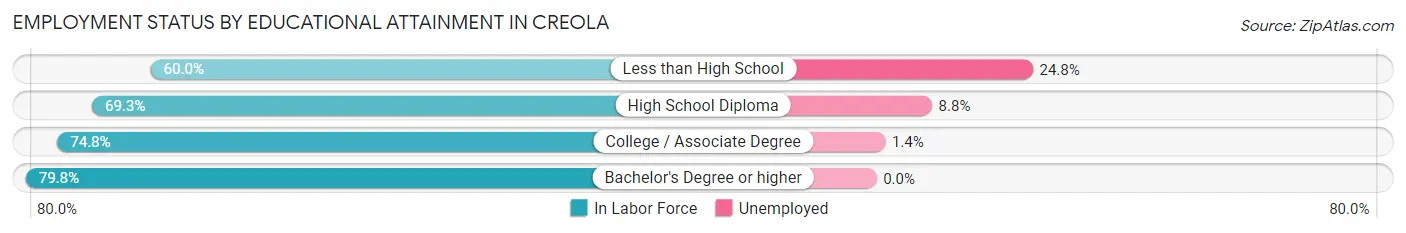
| Educational Attainment | In Labor Force | Unemployed |
| Less than High School | 141 (60.0%) | 58 (24.8%) |
| High School Diploma | 273 (69.3%) | 35 (8.8%) |
| College / Associate Degree | 291 (74.8%) | 5 (1.4%) |
| Bachelor's Degree or higher | 130 (79.8%) | 0 (0.0%) |
| Total | 835 (70.7%) | 89 (7.5%) |
Employment Occupations by Sex in Creola
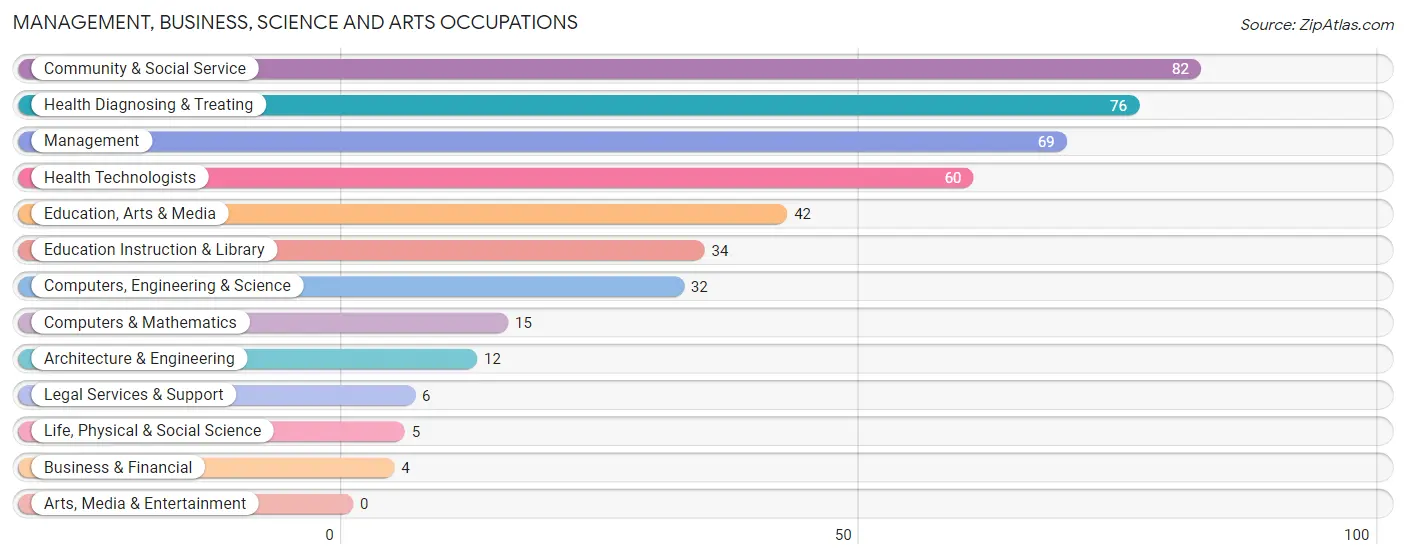
Management, Business, Science and Arts Occupations
The most common Management, Business, Science and Arts occupations in Creola are Community & Social Service (82 | 9.3%), Health Diagnosing & Treating (76 | 8.6%), Management (69 | 7.8%), Health Technologists (60 | 6.8%), and Education, Arts & Media (42 | 4.8%).
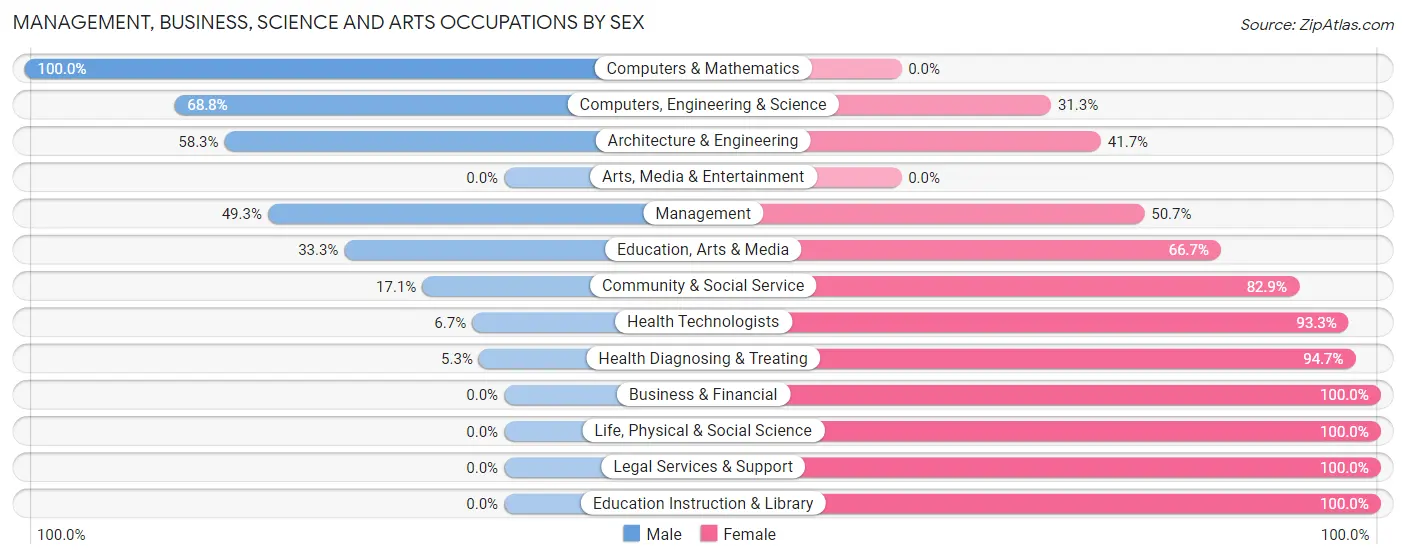
Management, Business, Science and Arts Occupations by Sex
Within the Management, Business, Science and Arts occupations in Creola, the most male-oriented occupations are Computers & Mathematics (100.0%), Computers, Engineering & Science (68.8%), and Architecture & Engineering (58.3%), while the most female-oriented occupations are Business & Financial (100.0%), Life, Physical & Social Science (100.0%), and Legal Services & Support (100.0%).
| Occupation | Male | Female |
| Management | 34 (49.3%) | 35 (50.7%) |
| Business & Financial | 0 (0.0%) | 4 (100.0%) |
| Computers, Engineering & Science | 22 (68.8%) | 10 (31.2%) |
| Computers & Mathematics | 15 (100.0%) | 0 (0.0%) |
| Architecture & Engineering | 7 (58.3%) | 5 (41.7%) |
| Life, Physical & Social Science | 0 (0.0%) | 5 (100.0%) |
| Community & Social Service | 14 (17.1%) | 68 (82.9%) |
| Education, Arts & Media | 14 (33.3%) | 28 (66.7%) |
| Legal Services & Support | 0 (0.0%) | 6 (100.0%) |
| Education Instruction & Library | 0 (0.0%) | 34 (100.0%) |
| Arts, Media & Entertainment | 0 (0.0%) | 0 (0.0%) |
| Health Diagnosing & Treating | 4 (5.3%) | 72 (94.7%) |
| Health Technologists | 4 (6.7%) | 56 (93.3%) |
| Total (Category) | 74 (28.1%) | 189 (71.9%) |
| Total (Overall) | 428 (48.5%) | 454 (51.5%) |
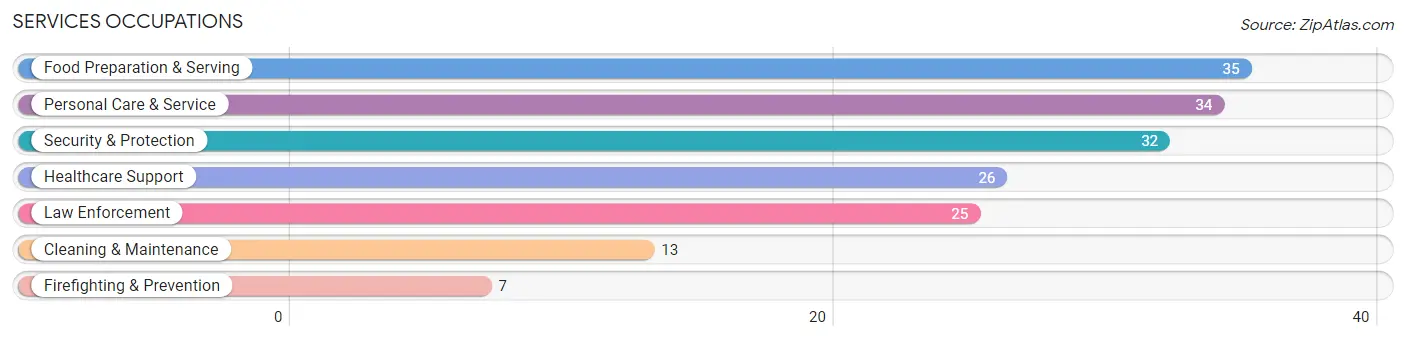
Services Occupations
The most common Services occupations in Creola are Food Preparation & Serving (35 | 4.0%), Personal Care & Service (34 | 3.8%), Security & Protection (32 | 3.6%), Healthcare Support (26 | 2.9%), and Law Enforcement (25 | 2.8%).
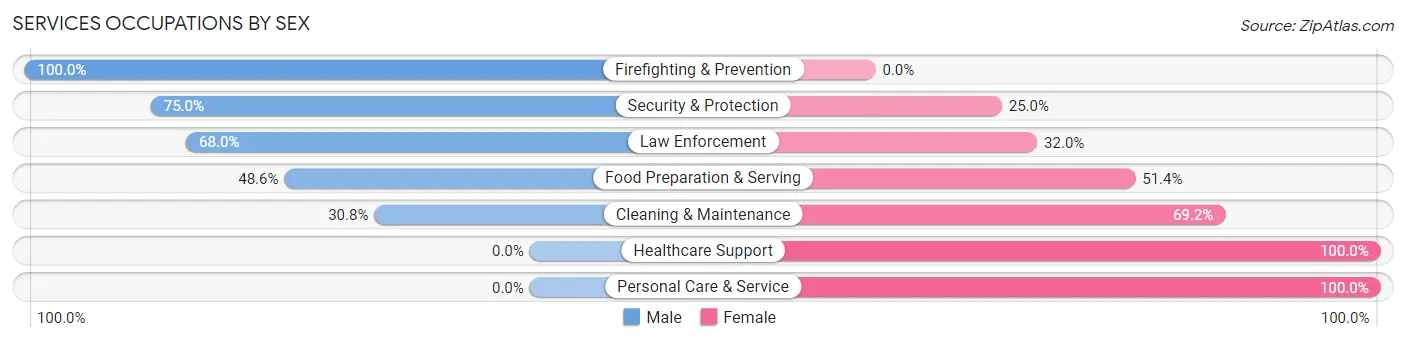
Services Occupations by Sex
Within the Services occupations in Creola, the most male-oriented occupations are Firefighting & Prevention (100.0%), Security & Protection (75.0%), and Law Enforcement (68.0%), while the most female-oriented occupations are Healthcare Support (100.0%), Personal Care & Service (100.0%), and Cleaning & Maintenance (69.2%).
| Occupation | Male | Female |
| Healthcare Support | 0 (0.0%) | 26 (100.0%) |
| Security & Protection | 24 (75.0%) | 8 (25.0%) |
| Firefighting & Prevention | 7 (100.0%) | 0 (0.0%) |
| Law Enforcement | 17 (68.0%) | 8 (32.0%) |
| Food Preparation & Serving | 17 (48.6%) | 18 (51.4%) |
| Cleaning & Maintenance | 4 (30.8%) | 9 (69.2%) |
| Personal Care & Service | 0 (0.0%) | 34 (100.0%) |
| Total (Category) | 45 (32.1%) | 95 (67.9%) |
| Total (Overall) | 428 (48.5%) | 454 (51.5%) |
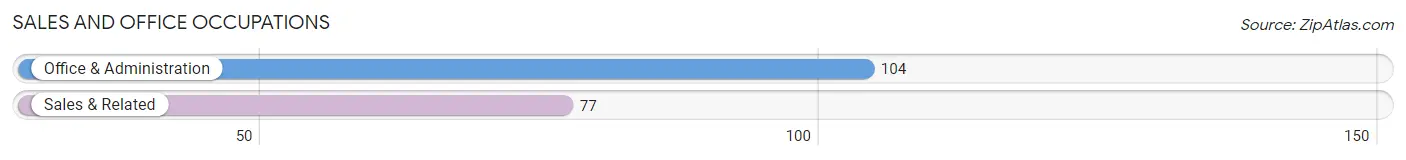
Sales and Office Occupations
The most common Sales and Office occupations in Creola are Office & Administration (104 | 11.8%), and Sales & Related (77 | 8.7%).
Sales and Office Occupations by Sex
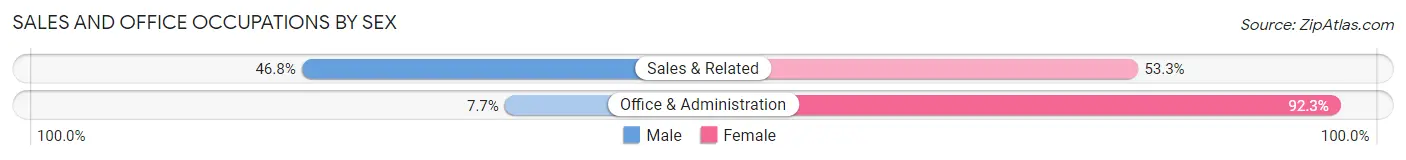
| Occupation | Male | Female |
| Sales & Related | 36 (46.8%) | 41 (53.2%) |
| Office & Administration | 8 (7.7%) | 96 (92.3%) |
| Total (Category) | 44 (24.3%) | 137 (75.7%) |
| Total (Overall) | 428 (48.5%) | 454 (51.5%) |
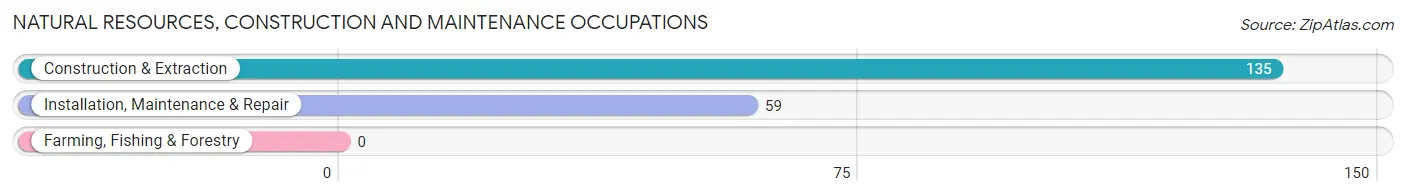
Natural Resources, Construction and Maintenance Occupations
The most common Natural Resources, Construction and Maintenance occupations in Creola are Construction & Extraction (135 | 15.3%), and Installation, Maintenance & Repair (59 | 6.7%).
Natural Resources, Construction and Maintenance Occupations by Sex
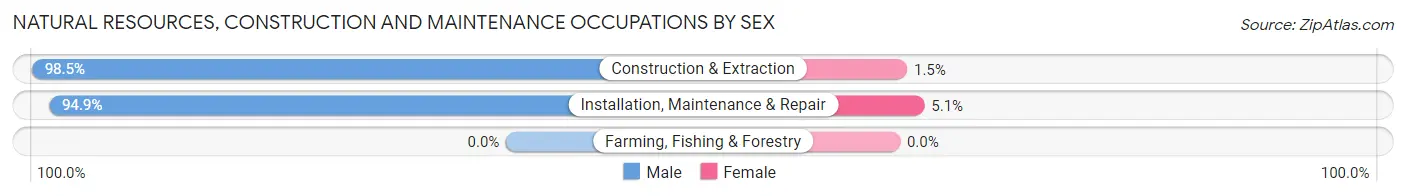
| Occupation | Male | Female |
| Farming, Fishing & Forestry | 0 (0.0%) | 0 (0.0%) |
| Construction & Extraction | 133 (98.5%) | 2 (1.5%) |
| Installation, Maintenance & Repair | 56 (94.9%) | 3 (5.1%) |
| Total (Category) | 189 (97.4%) | 5 (2.6%) |
| Total (Overall) | 428 (48.5%) | 454 (51.5%) |
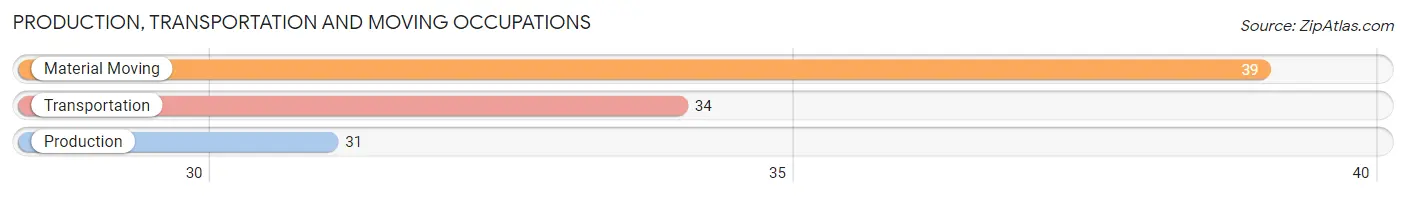
Production, Transportation and Moving Occupations
The most common Production, Transportation and Moving occupations in Creola are Material Moving (39 | 4.4%), Transportation (34 | 3.8%), and Production (31 | 3.5%).
Production, Transportation and Moving Occupations by Sex
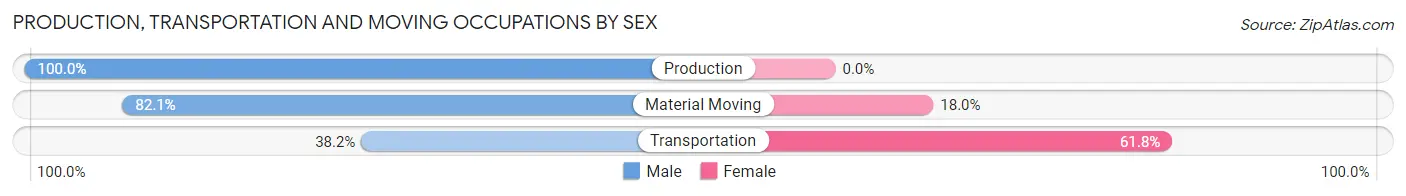
| Occupation | Male | Female |
| Production | 31 (100.0%) | 0 (0.0%) |
| Transportation | 13 (38.2%) | 21 (61.8%) |
| Material Moving | 32 (82.1%) | 7 (17.9%) |
| Total (Category) | 76 (73.1%) | 28 (26.9%) |
| Total (Overall) | 428 (48.5%) | 454 (51.5%) |
Employment Industries by Sex in Creola
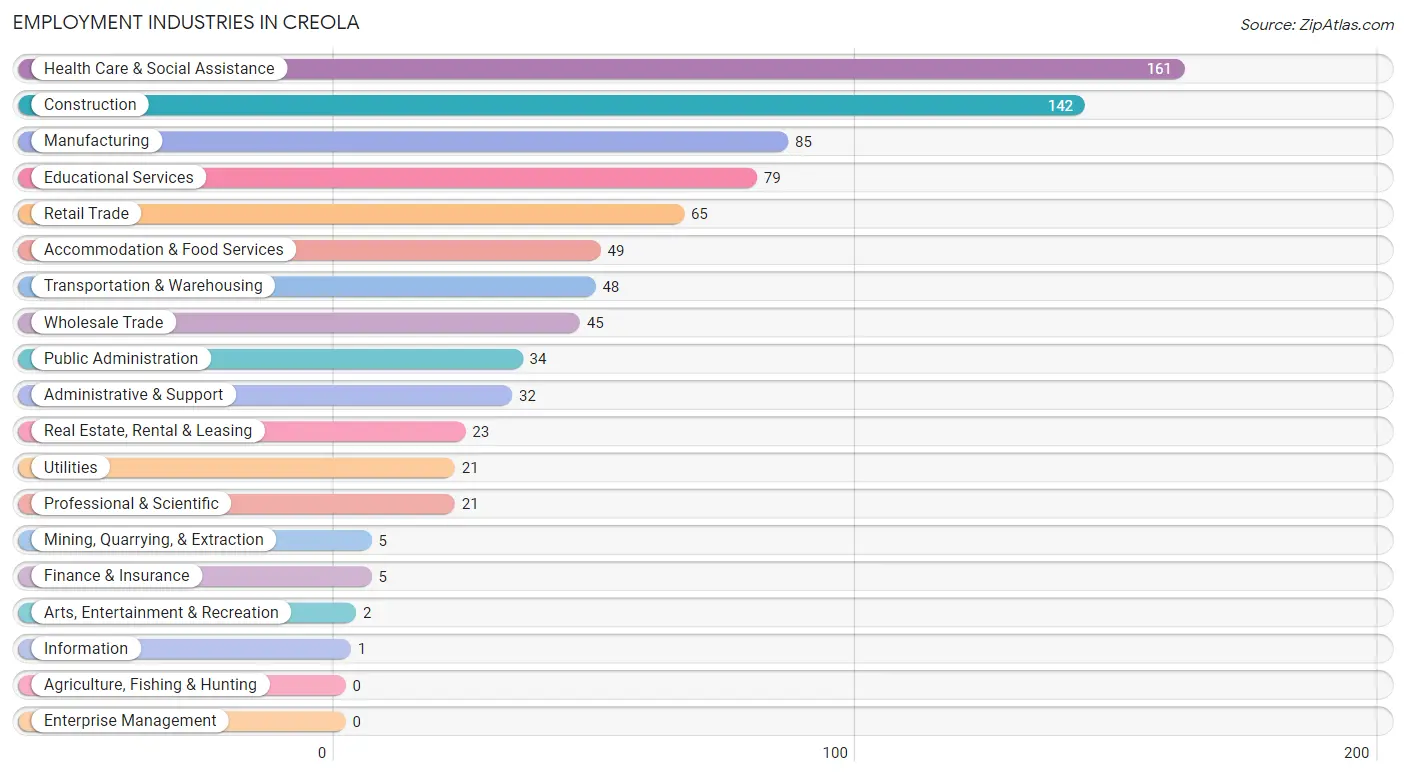
Employment Industries in Creola
The major employment industries in Creola include Health Care & Social Assistance (161 | 18.2%), Construction (142 | 16.1%), Manufacturing (85 | 9.6%), Educational Services (79 | 9.0%), and Retail Trade (65 | 7.4%).
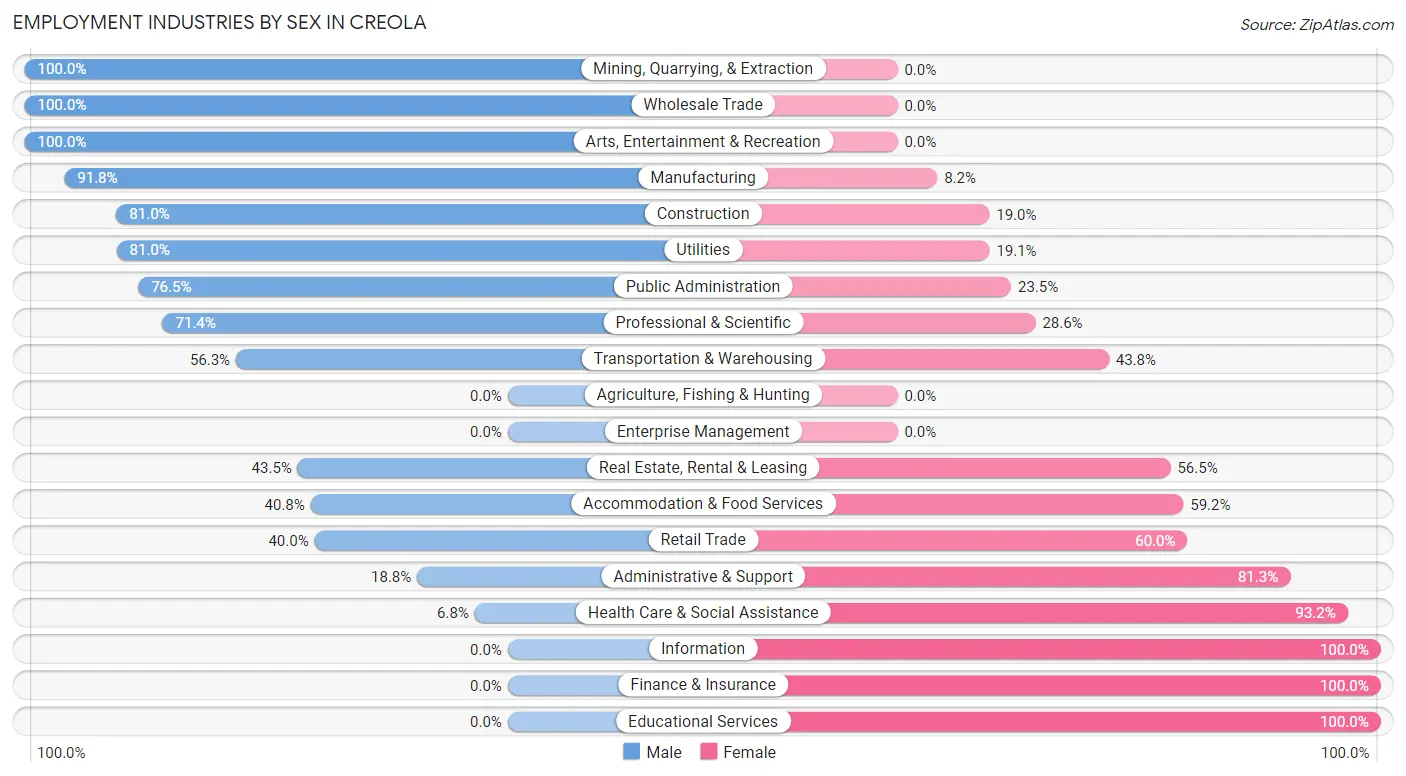
Employment Industries by Sex in Creola
The Creola industries that see more men than women are Mining, Quarrying, & Extraction (100.0%), Wholesale Trade (100.0%), and Arts, Entertainment & Recreation (100.0%), whereas the industries that tend to have a higher number of women are Information (100.0%), Finance & Insurance (100.0%), and Educational Services (100.0%).
| Industry | Male | Female |
| Agriculture, Fishing & Hunting | 0 (0.0%) | 0 (0.0%) |
| Mining, Quarrying, & Extraction | 5 (100.0%) | 0 (0.0%) |
| Construction | 115 (81.0%) | 27 (19.0%) |
| Manufacturing | 78 (91.8%) | 7 (8.2%) |
| Wholesale Trade | 45 (100.0%) | 0 (0.0%) |
| Retail Trade | 26 (40.0%) | 39 (60.0%) |
| Transportation & Warehousing | 27 (56.2%) | 21 (43.8%) |
| Utilities | 17 (80.9%) | 4 (19.1%) |
| Information | 0 (0.0%) | 1 (100.0%) |
| Finance & Insurance | 0 (0.0%) | 5 (100.0%) |
| Real Estate, Rental & Leasing | 10 (43.5%) | 13 (56.5%) |
| Professional & Scientific | 15 (71.4%) | 6 (28.6%) |
| Enterprise Management | 0 (0.0%) | 0 (0.0%) |
| Administrative & Support | 6 (18.8%) | 26 (81.2%) |
| Educational Services | 0 (0.0%) | 79 (100.0%) |
| Health Care & Social Assistance | 11 (6.8%) | 150 (93.2%) |
| Arts, Entertainment & Recreation | 2 (100.0%) | 0 (0.0%) |
| Accommodation & Food Services | 20 (40.8%) | 29 (59.2%) |
| Public Administration | 26 (76.5%) | 8 (23.5%) |
| Total | 428 (48.5%) | 454 (51.5%) |
Education in Creola
School Enrollment in Creola
The most common levels of schooling among the 601 students in Creola are middle school (158 | 26.3%), elementary school (121 | 20.1%), and high school (118 | 19.6%).
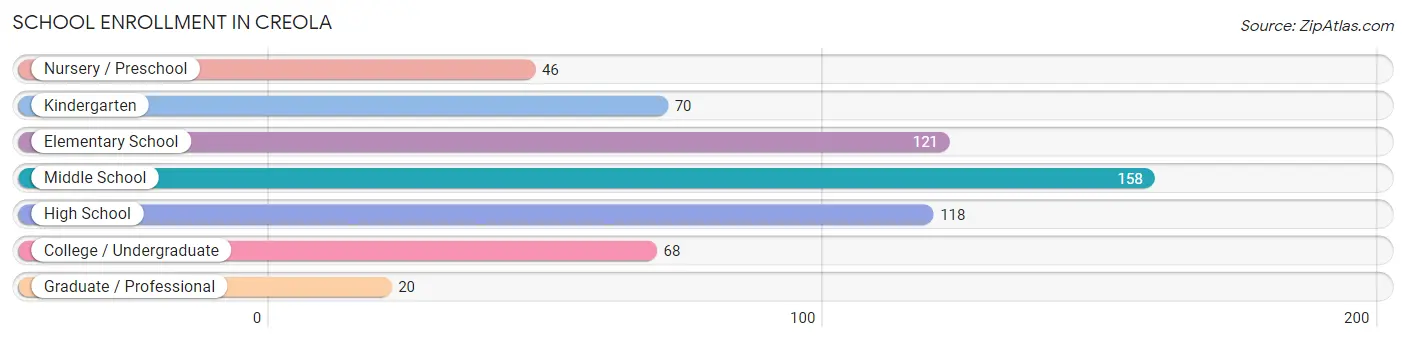
| School Level | # Students | % Students |
| Nursery / Preschool | 46 | 7.6% |
| Kindergarten | 70 | 11.7% |
| Elementary School | 121 | 20.1% |
| Middle School | 158 | 26.3% |
| High School | 118 | 19.6% |
| College / Undergraduate | 68 | 11.3% |
| Graduate / Professional | 20 | 3.3% |
| Total | 601 | 100.0% |
School Enrollment by Age by Funding Source in Creola
Out of a total of 601 students who are enrolled in schools in Creola, 145 (24.1%) attend a private institution, while the remaining 456 (75.9%) are enrolled in public schools. The age group of 20 to 24 year olds has the highest likelihood of being enrolled in private schools, with 57 (91.9% in the age bracket) enrolled. Conversely, the age group of 15 to 17 year olds has the lowest likelihood of being enrolled in a private school, with 41 (100.0% in the age bracket) attending a public institution.
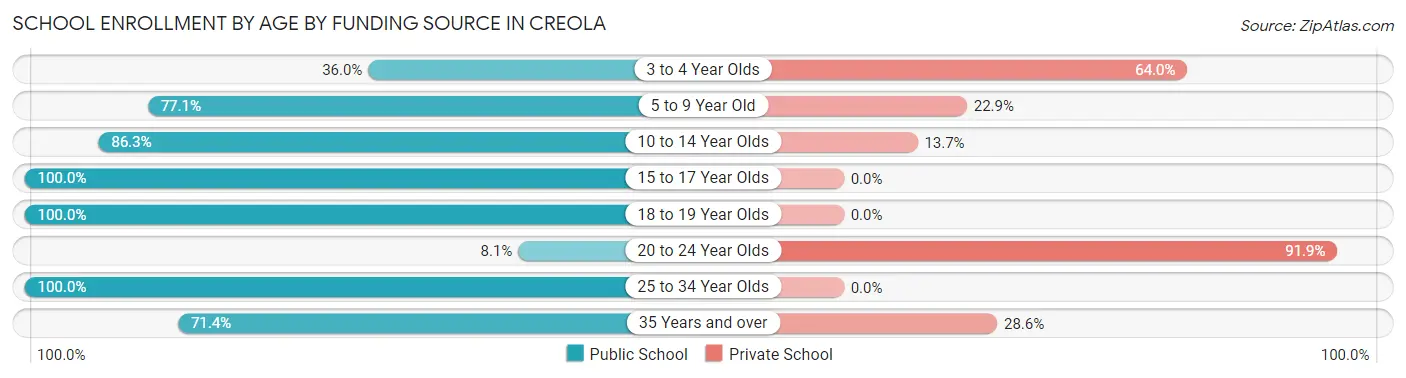
| Age Bracket | Public School | Private School |
| 3 to 4 Year Olds | 9 (36.0%) | 16 (64.0%) |
| 5 to 9 Year Old | 131 (77.1%) | 39 (22.9%) |
| 10 to 14 Year Olds | 182 (86.3%) | 29 (13.7%) |
| 15 to 17 Year Olds | 41 (100.0%) | 0 (0.0%) |
| 18 to 19 Year Olds | 66 (100.0%) | 0 (0.0%) |
| 20 to 24 Year Olds | 5 (8.1%) | 57 (91.9%) |
| 25 to 34 Year Olds | 12 (100.0%) | 0 (0.0%) |
| 35 Years and over | 10 (71.4%) | 4 (28.6%) |
| Total | 456 (75.9%) | 145 (24.1%) |
Educational Attainment by Field of Study in Creola
Science & technology (54 | 20.4%), bio, nature & agricultural (49 | 18.5%), education (46 | 17.4%), engineering (27 | 10.2%), and psychology (18 | 6.8%) are the most common fields of study among 265 individuals in Creola who have obtained a bachelor's degree or higher.
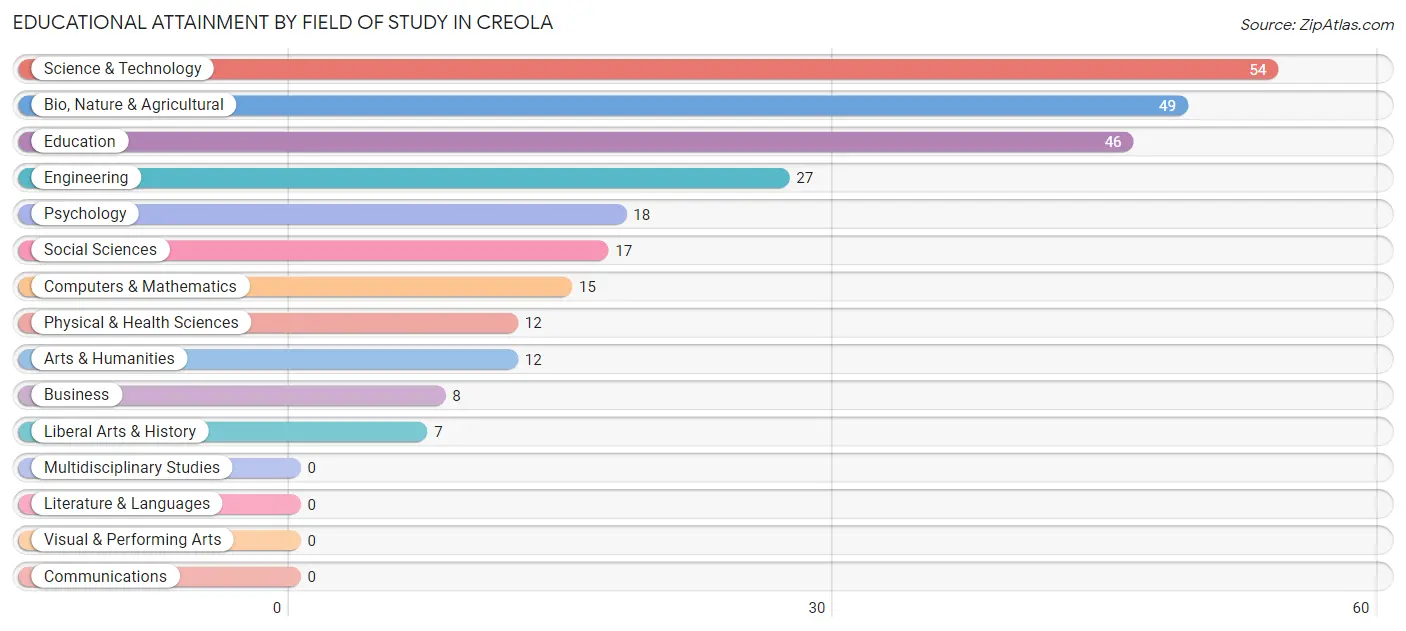
| Field of Study | # Graduates | % Graduates |
| Computers & Mathematics | 15 | 5.7% |
| Bio, Nature & Agricultural | 49 | 18.5% |
| Physical & Health Sciences | 12 | 4.5% |
| Psychology | 18 | 6.8% |
| Social Sciences | 17 | 6.4% |
| Engineering | 27 | 10.2% |
| Multidisciplinary Studies | 0 | 0.0% |
| Science & Technology | 54 | 20.4% |
| Business | 8 | 3.0% |
| Education | 46 | 17.4% |
| Literature & Languages | 0 | 0.0% |
| Liberal Arts & History | 7 | 2.6% |
| Visual & Performing Arts | 0 | 0.0% |
| Communications | 0 | 0.0% |
| Arts & Humanities | 12 | 4.5% |
| Total | 265 | 100.0% |
Transportation & Commute in Creola
Vehicle Availability by Sex in Creola
The most prevalent vehicle ownership categories in Creola are males with 2 vehicles (205, accounting for 48.9%) and females with 2 vehicles (202, making up 45.2%).
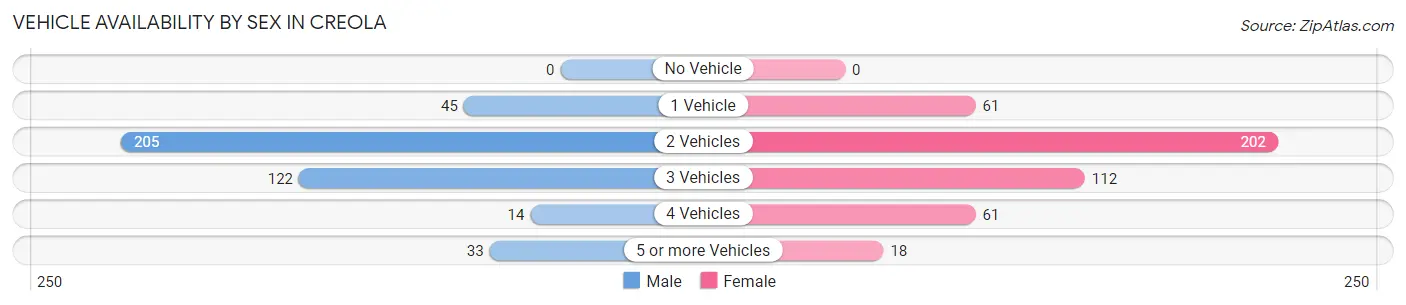
| Vehicles Available | Male | Female |
| No Vehicle | 0 (0.0%) | 0 (0.0%) |
| 1 Vehicle | 45 (10.7%) | 61 (13.4%) |
| 2 Vehicles | 205 (48.9%) | 202 (44.5%) |
| 3 Vehicles | 122 (29.1%) | 112 (24.7%) |
| 4 Vehicles | 14 (3.3%) | 61 (13.4%) |
| 5 or more Vehicles | 33 (7.9%) | 18 (4.0%) |
| Total | 419 (100.0%) | 454 (100.0%) |
Commute Time in Creola
The most frequently occuring commute durations in Creola are 30 to 34 minutes (195 commuters, 22.7%), 20 to 24 minutes (118 commuters, 13.8%), and 35 to 39 minutes (106 commuters, 12.3%).
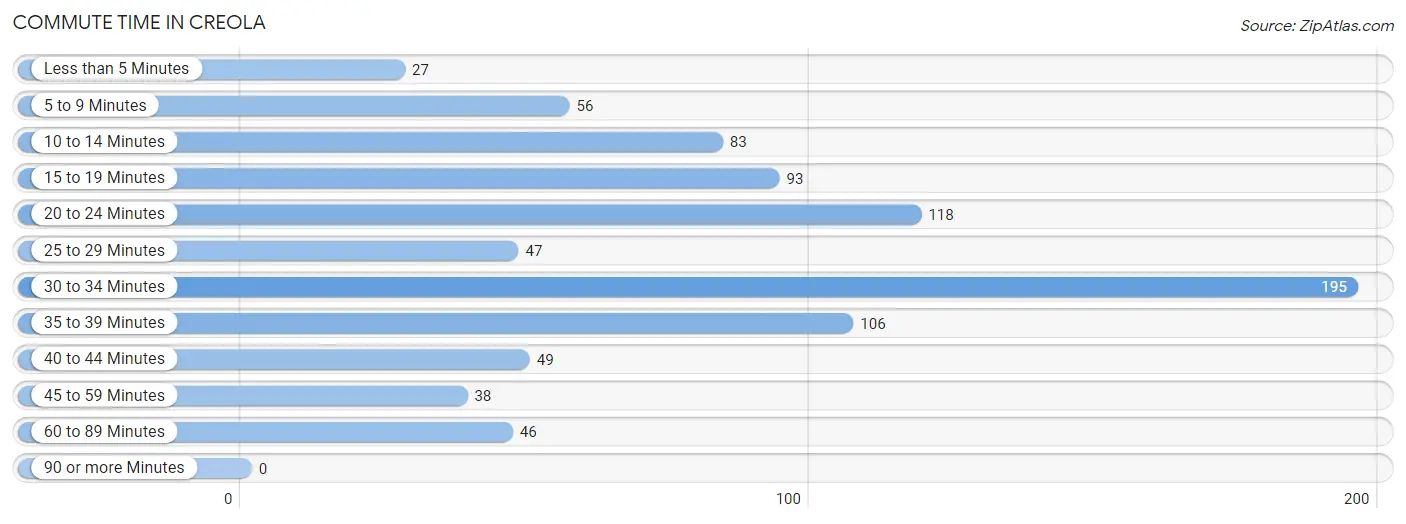
| Commute Time | # Commuters | % Commuters |
| Less than 5 Minutes | 27 | 3.2% |
| 5 to 9 Minutes | 56 | 6.5% |
| 10 to 14 Minutes | 83 | 9.7% |
| 15 to 19 Minutes | 93 | 10.8% |
| 20 to 24 Minutes | 118 | 13.8% |
| 25 to 29 Minutes | 47 | 5.5% |
| 30 to 34 Minutes | 195 | 22.7% |
| 35 to 39 Minutes | 106 | 12.3% |
| 40 to 44 Minutes | 49 | 5.7% |
| 45 to 59 Minutes | 38 | 4.4% |
| 60 to 89 Minutes | 46 | 5.4% |
| 90 or more Minutes | 0 | 0.0% |
Commute Time by Sex in Creola
The most common commute times in Creola are 30 to 34 minutes (104 commuters, 25.5%) for males and 30 to 34 minutes (91 commuters, 20.2%) for females.
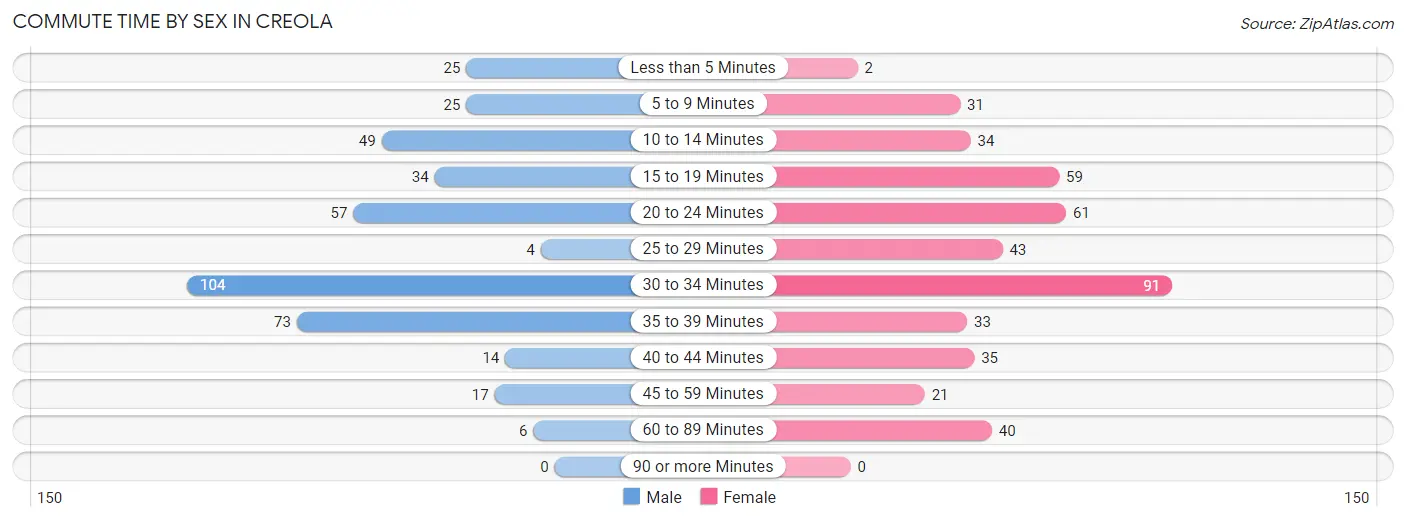
| Commute Time | Male | Female |
| Less than 5 Minutes | 25 (6.1%) | 2 (0.4%) |
| 5 to 9 Minutes | 25 (6.1%) | 31 (6.9%) |
| 10 to 14 Minutes | 49 (12.0%) | 34 (7.6%) |
| 15 to 19 Minutes | 34 (8.3%) | 59 (13.1%) |
| 20 to 24 Minutes | 57 (14.0%) | 61 (13.6%) |
| 25 to 29 Minutes | 4 (1.0%) | 43 (9.6%) |
| 30 to 34 Minutes | 104 (25.5%) | 91 (20.2%) |
| 35 to 39 Minutes | 73 (17.9%) | 33 (7.3%) |
| 40 to 44 Minutes | 14 (3.4%) | 35 (7.8%) |
| 45 to 59 Minutes | 17 (4.2%) | 21 (4.7%) |
| 60 to 89 Minutes | 6 (1.5%) | 40 (8.9%) |
| 90 or more Minutes | 0 (0.0%) | 0 (0.0%) |
Time of Departure to Work by Sex in Creola
The most frequent times of departure to work in Creola are 5:30 AM to 5:59 AM (91, 22.3%) for males and 6:30 AM to 6:59 AM (113, 25.1%) for females.
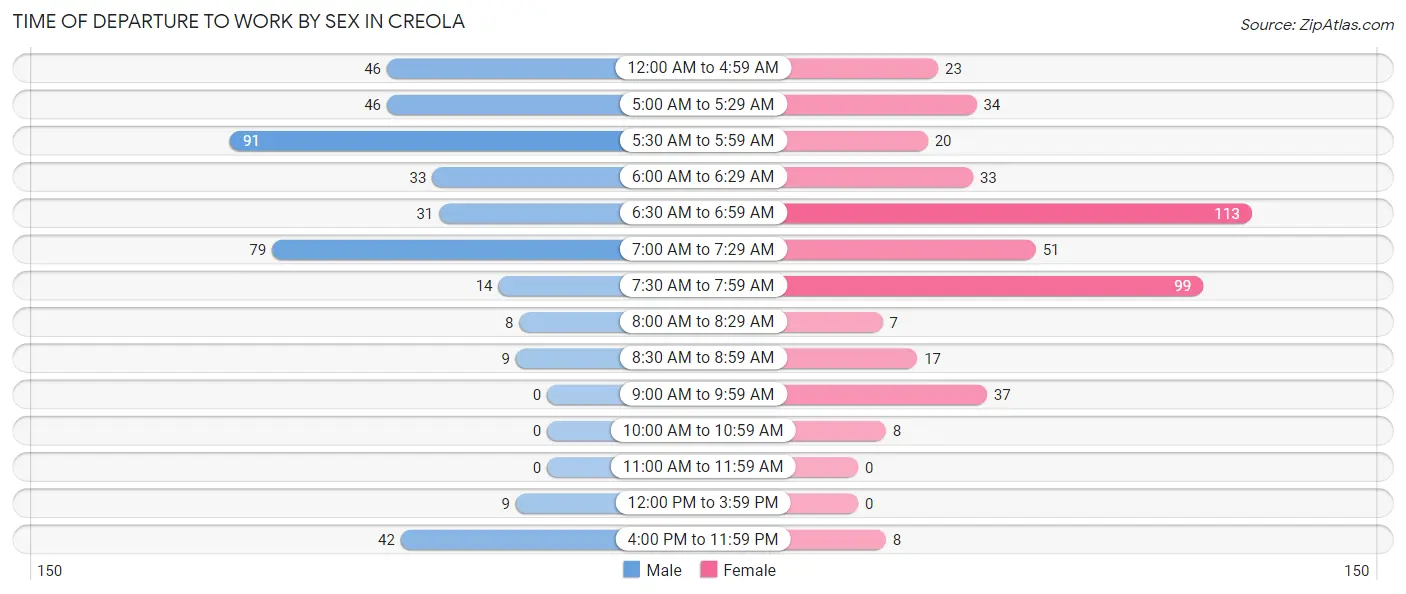
| Time of Departure | Male | Female |
| 12:00 AM to 4:59 AM | 46 (11.3%) | 23 (5.1%) |
| 5:00 AM to 5:29 AM | 46 (11.3%) | 34 (7.6%) |
| 5:30 AM to 5:59 AM | 91 (22.3%) | 20 (4.4%) |
| 6:00 AM to 6:29 AM | 33 (8.1%) | 33 (7.3%) |
| 6:30 AM to 6:59 AM | 31 (7.6%) | 113 (25.1%) |
| 7:00 AM to 7:29 AM | 79 (19.4%) | 51 (11.3%) |
| 7:30 AM to 7:59 AM | 14 (3.4%) | 99 (22.0%) |
| 8:00 AM to 8:29 AM | 8 (2.0%) | 7 (1.6%) |
| 8:30 AM to 8:59 AM | 9 (2.2%) | 17 (3.8%) |
| 9:00 AM to 9:59 AM | 0 (0.0%) | 37 (8.2%) |
| 10:00 AM to 10:59 AM | 0 (0.0%) | 8 (1.8%) |
| 11:00 AM to 11:59 AM | 0 (0.0%) | 0 (0.0%) |
| 12:00 PM to 3:59 PM | 9 (2.2%) | 0 (0.0%) |
| 4:00 PM to 11:59 PM | 42 (10.3%) | 8 (1.8%) |
| Total | 408 (100.0%) | 450 (100.0%) |
Housing Occupancy in Creola
Occupancy by Ownership in Creola
Of the total 795 dwellings in Creola, owner-occupied units account for 638 (80.2%), while renter-occupied units make up 157 (19.8%).
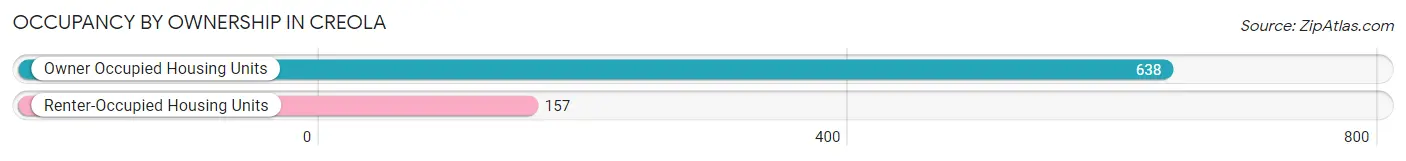
| Occupancy | # Housing Units | % Housing Units |
| Owner Occupied Housing Units | 638 | 80.2% |
| Renter-Occupied Housing Units | 157 | 19.8% |
| Total Occupied Housing Units | 795 | 100.0% |
Occupancy by Household Size in Creola
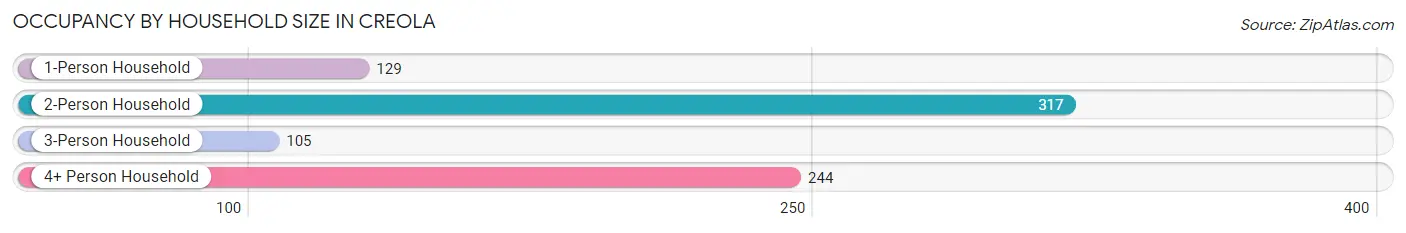
| Household Size | # Housing Units | % Housing Units |
| 1-Person Household | 129 | 16.2% |
| 2-Person Household | 317 | 39.9% |
| 3-Person Household | 105 | 13.2% |
| 4+ Person Household | 244 | 30.7% |
| Total Housing Units | 795 | 100.0% |
Occupancy by Ownership by Household Size in Creola
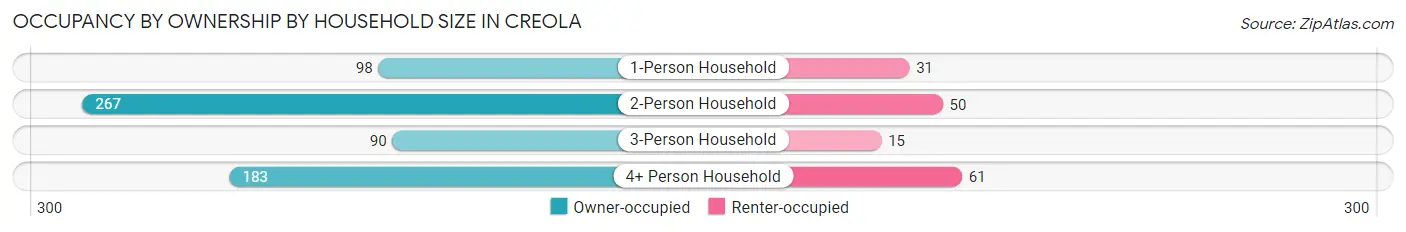
| Household Size | Owner-occupied | Renter-occupied |
| 1-Person Household | 98 (76.0%) | 31 (24.0%) |
| 2-Person Household | 267 (84.2%) | 50 (15.8%) |
| 3-Person Household | 90 (85.7%) | 15 (14.3%) |
| 4+ Person Household | 183 (75.0%) | 61 (25.0%) |
| Total Housing Units | 638 (80.2%) | 157 (19.8%) |
Occupancy by Educational Attainment in Creola
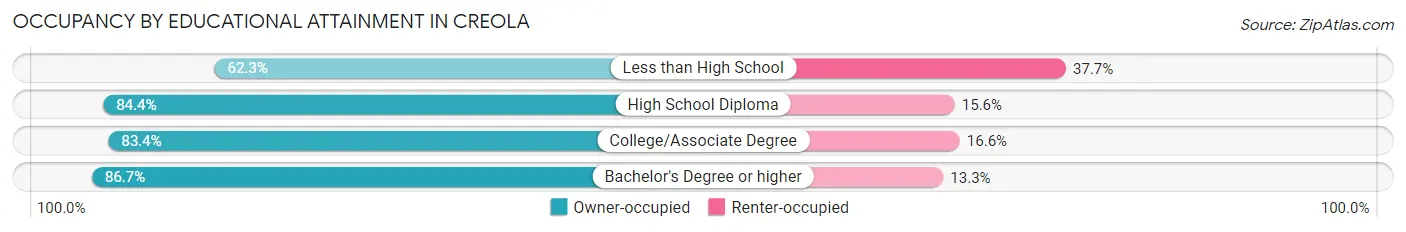
| Household Size | Owner-occupied | Renter-occupied |
| Less than High School | 96 (62.3%) | 58 (37.7%) |
| High School Diploma | 211 (84.4%) | 39 (15.6%) |
| College/Associate Degree | 201 (83.4%) | 40 (16.6%) |
| Bachelor's Degree or higher | 130 (86.7%) | 20 (13.3%) |
Occupancy by Age of Householder in Creola
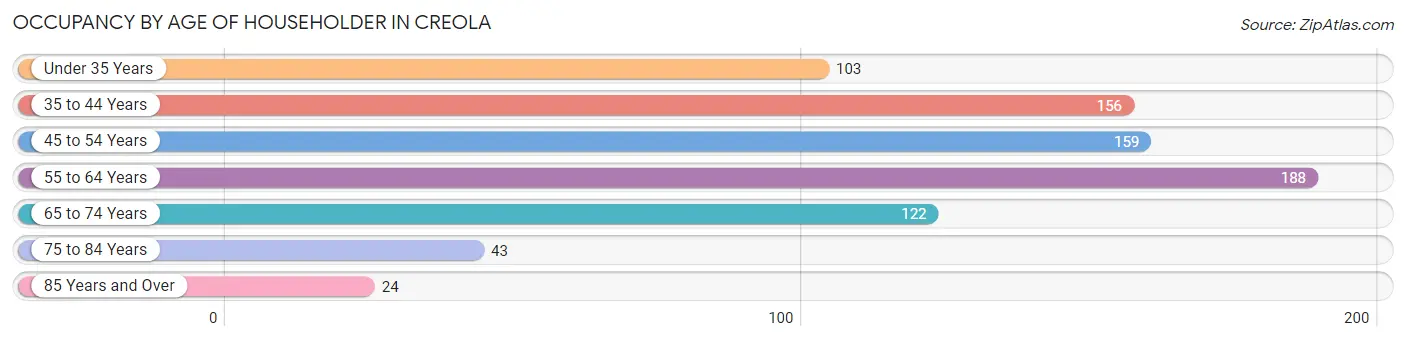
| Age Bracket | # Households | % Households |
| Under 35 Years | 103 | 13.0% |
| 35 to 44 Years | 156 | 19.6% |
| 45 to 54 Years | 159 | 20.0% |
| 55 to 64 Years | 188 | 23.6% |
| 65 to 74 Years | 122 | 15.3% |
| 75 to 84 Years | 43 | 5.4% |
| 85 Years and Over | 24 | 3.0% |
| Total | 795 | 100.0% |
Housing Finances in Creola
Median Income by Occupancy in Creola
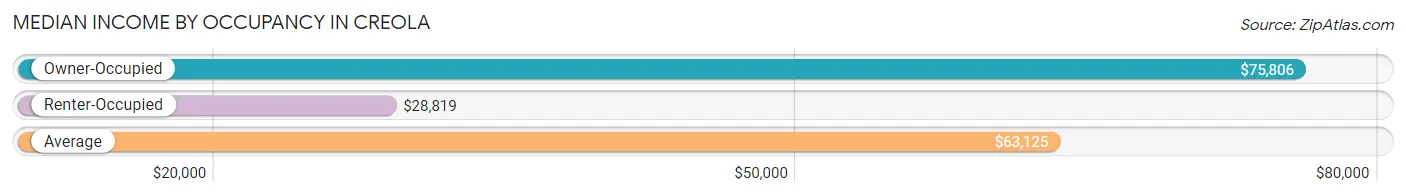
| Occupancy Type | # Households | Median Income |
| Owner-Occupied | 638 (80.2%) | $75,806 |
| Renter-Occupied | 157 (19.8%) | $28,819 |
| Average | 795 (100.0%) | $63,125 |
Occupancy by Householder Income Bracket in Creola
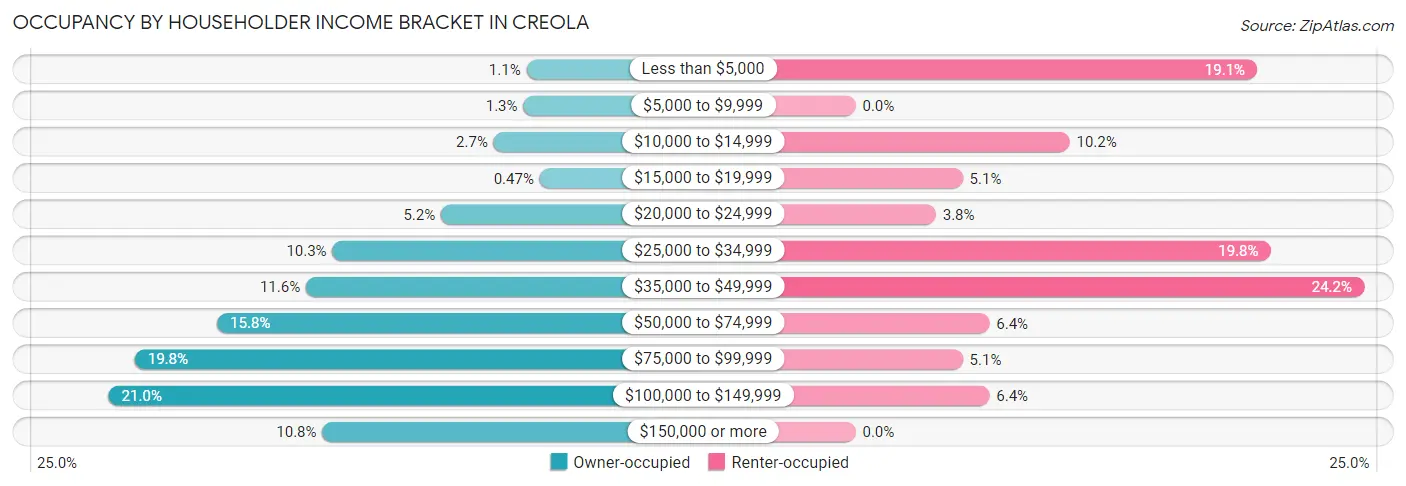
| Income Bracket | Owner-occupied | Renter-occupied |
| Less than $5,000 | 7 (1.1%) | 30 (19.1%) |
| $5,000 to $9,999 | 8 (1.3%) | 0 (0.0%) |
| $10,000 to $14,999 | 17 (2.7%) | 16 (10.2%) |
| $15,000 to $19,999 | 3 (0.5%) | 8 (5.1%) |
| $20,000 to $24,999 | 33 (5.2%) | 6 (3.8%) |
| $25,000 to $34,999 | 66 (10.3%) | 31 (19.8%) |
| $35,000 to $49,999 | 74 (11.6%) | 38 (24.2%) |
| $50,000 to $74,999 | 101 (15.8%) | 10 (6.4%) |
| $75,000 to $99,999 | 126 (19.8%) | 8 (5.1%) |
| $100,000 to $149,999 | 134 (21.0%) | 10 (6.4%) |
| $150,000 or more | 69 (10.8%) | 0 (0.0%) |
| Total | 638 (100.0%) | 157 (100.0%) |
Monthly Housing Cost Tiers in Creola
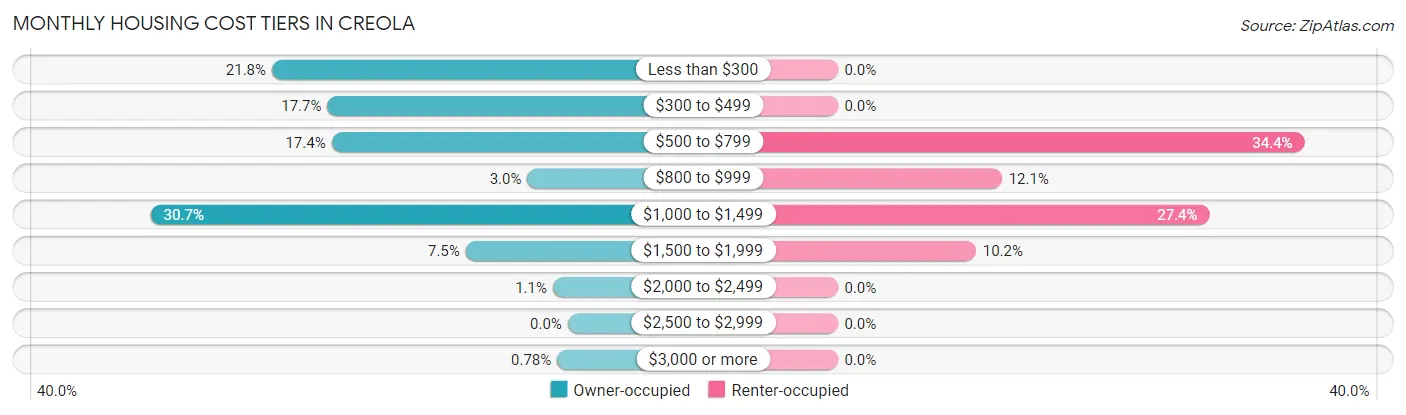
| Monthly Cost | Owner-occupied | Renter-occupied |
| Less than $300 | 139 (21.8%) | 0 (0.0%) |
| $300 to $499 | 113 (17.7%) | 0 (0.0%) |
| $500 to $799 | 111 (17.4%) | 54 (34.4%) |
| $800 to $999 | 19 (3.0%) | 19 (12.1%) |
| $1,000 to $1,499 | 196 (30.7%) | 43 (27.4%) |
| $1,500 to $1,999 | 48 (7.5%) | 16 (10.2%) |
| $2,000 to $2,499 | 7 (1.1%) | 0 (0.0%) |
| $2,500 to $2,999 | 0 (0.0%) | 0 (0.0%) |
| $3,000 or more | 5 (0.8%) | 0 (0.0%) |
| Total | 638 (100.0%) | 157 (100.0%) |
Physical Housing Characteristics in Creola
Housing Structures in Creola
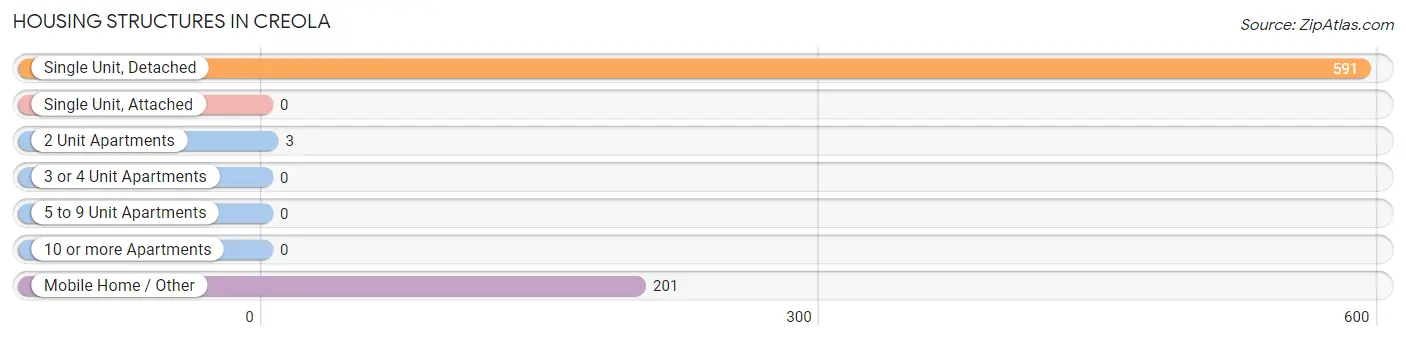
| Structure Type | # Housing Units | % Housing Units |
| Single Unit, Detached | 591 | 74.3% |
| Single Unit, Attached | 0 | 0.0% |
| 2 Unit Apartments | 3 | 0.4% |
| 3 or 4 Unit Apartments | 0 | 0.0% |
| 5 to 9 Unit Apartments | 0 | 0.0% |
| 10 or more Apartments | 0 | 0.0% |
| Mobile Home / Other | 201 | 25.3% |
| Total | 795 | 100.0% |
Housing Structures by Occupancy in Creola
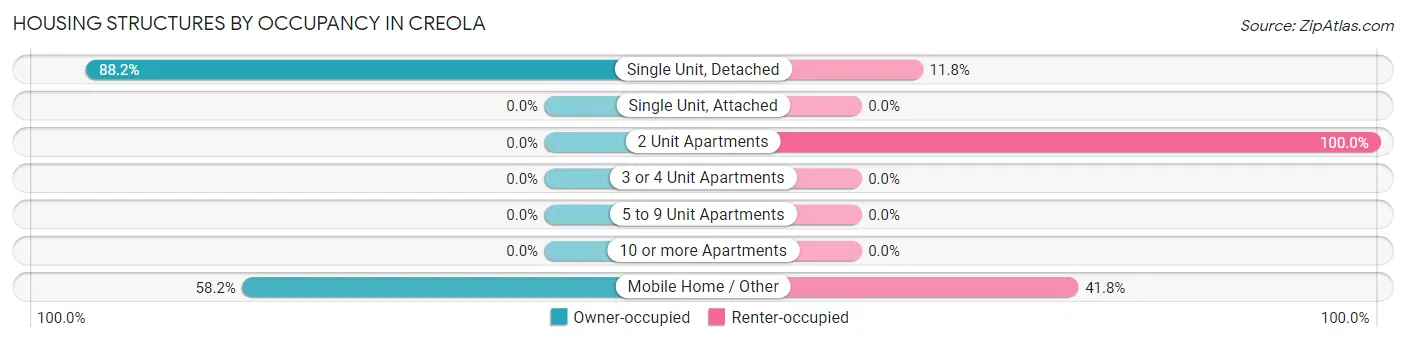
| Structure Type | Owner-occupied | Renter-occupied |
| Single Unit, Detached | 521 (88.2%) | 70 (11.8%) |
| Single Unit, Attached | 0 (0.0%) | 0 (0.0%) |
| 2 Unit Apartments | 0 (0.0%) | 3 (100.0%) |
| 3 or 4 Unit Apartments | 0 (0.0%) | 0 (0.0%) |
| 5 to 9 Unit Apartments | 0 (0.0%) | 0 (0.0%) |
| 10 or more Apartments | 0 (0.0%) | 0 (0.0%) |
| Mobile Home / Other | 117 (58.2%) | 84 (41.8%) |
| Total | 638 (80.2%) | 157 (19.8%) |
Housing Structures by Number of Rooms in Creola
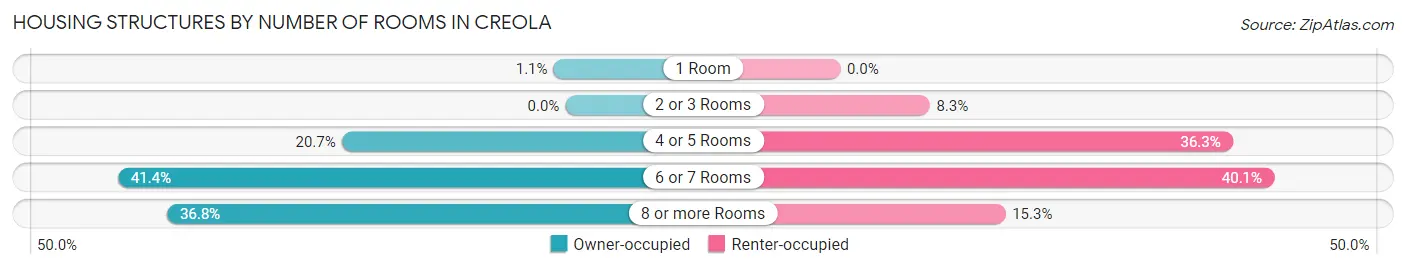
| Number of Rooms | Owner-occupied | Renter-occupied |
| 1 Room | 7 (1.1%) | 0 (0.0%) |
| 2 or 3 Rooms | 0 (0.0%) | 13 (8.3%) |
| 4 or 5 Rooms | 132 (20.7%) | 57 (36.3%) |
| 6 or 7 Rooms | 264 (41.4%) | 63 (40.1%) |
| 8 or more Rooms | 235 (36.8%) | 24 (15.3%) |
| Total | 638 (100.0%) | 157 (100.0%) |
Housing Structure by Heating Type in Creola
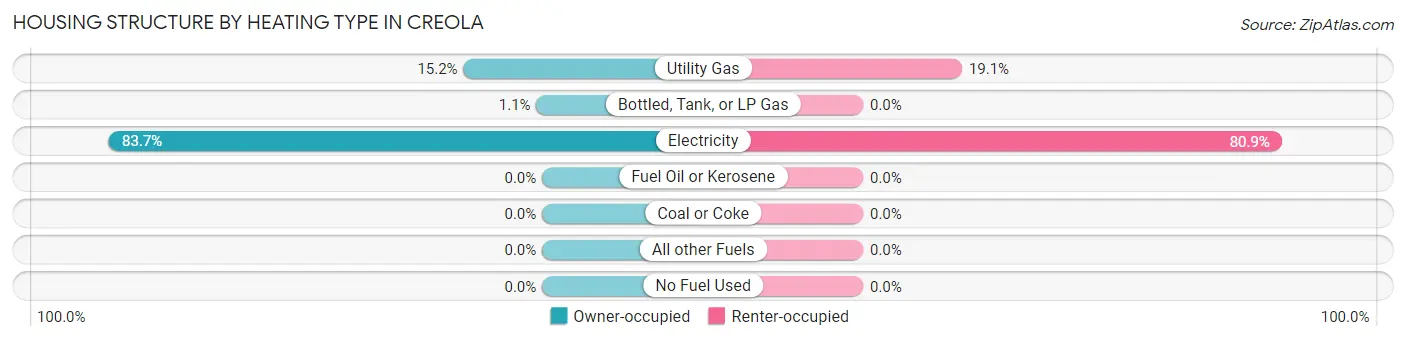
| Heating Type | Owner-occupied | Renter-occupied |
| Utility Gas | 97 (15.2%) | 30 (19.1%) |
| Bottled, Tank, or LP Gas | 7 (1.1%) | 0 (0.0%) |
| Electricity | 534 (83.7%) | 127 (80.9%) |
| Fuel Oil or Kerosene | 0 (0.0%) | 0 (0.0%) |
| Coal or Coke | 0 (0.0%) | 0 (0.0%) |
| All other Fuels | 0 (0.0%) | 0 (0.0%) |
| No Fuel Used | 0 (0.0%) | 0 (0.0%) |
| Total | 638 (100.0%) | 157 (100.0%) |
Household Vehicle Usage in Creola
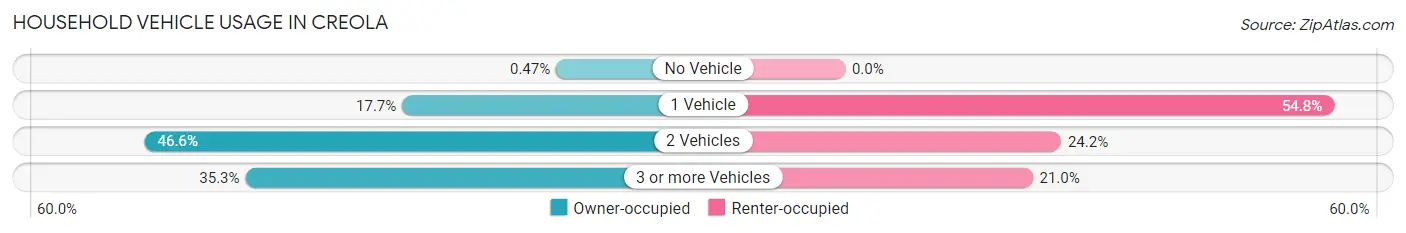
| Vehicles per Household | Owner-occupied | Renter-occupied |
| No Vehicle | 3 (0.5%) | 0 (0.0%) |
| 1 Vehicle | 113 (17.7%) | 86 (54.8%) |
| 2 Vehicles | 297 (46.6%) | 38 (24.2%) |
| 3 or more Vehicles | 225 (35.3%) | 33 (21.0%) |
| Total | 638 (100.0%) | 157 (100.0%) |
Real Estate & Mortgages in Creola
Real Estate and Mortgage Overview in Creola
| Characteristic | Without Mortgage | With Mortgage |
| Housing Units | 354 | 284 |
| Median Property Value | $160,400 | $164,900 |
| Median Household Income | $61,667 | $38 |
| Monthly Housing Costs | $372 | $5 |
| Real Estate Taxes | $708 | $41 |
Property Value by Mortgage Status in Creola
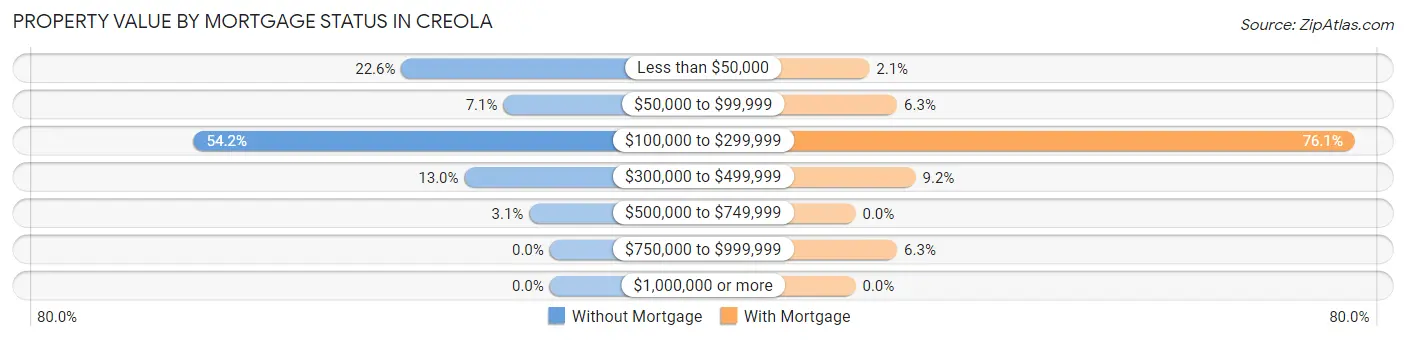
| Property Value | Without Mortgage | With Mortgage |
| Less than $50,000 | 80 (22.6%) | 6 (2.1%) |
| $50,000 to $99,999 | 25 (7.1%) | 18 (6.3%) |
| $100,000 to $299,999 | 192 (54.2%) | 216 (76.1%) |
| $300,000 to $499,999 | 46 (13.0%) | 26 (9.1%) |
| $500,000 to $749,999 | 11 (3.1%) | 0 (0.0%) |
| $750,000 to $999,999 | 0 (0.0%) | 18 (6.3%) |
| $1,000,000 or more | 0 (0.0%) | 0 (0.0%) |
| Total | 354 (100.0%) | 284 (100.0%) |
Household Income by Mortgage Status in Creola
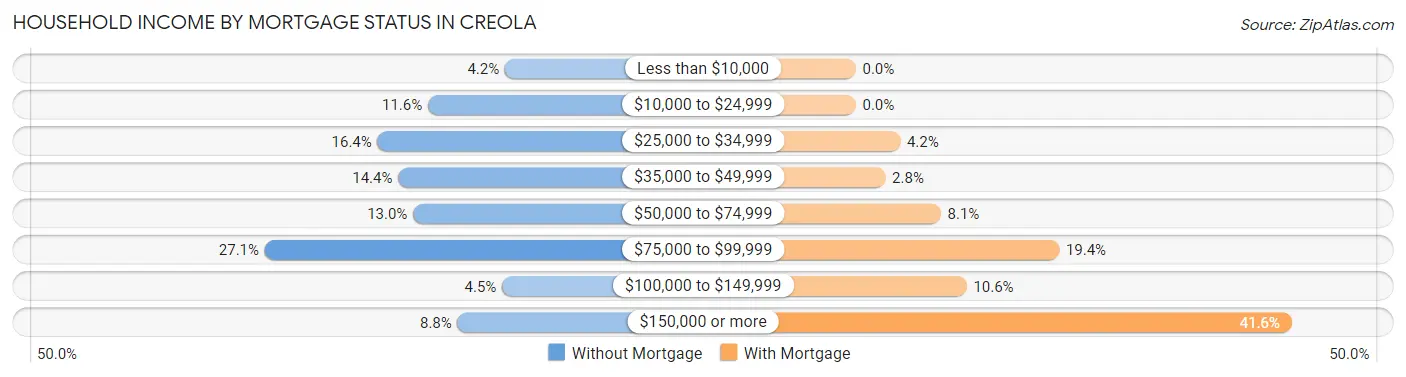
| Household Income | Without Mortgage | With Mortgage |
| Less than $10,000 | 15 (4.2%) | 0 (0.0%) |
| $10,000 to $24,999 | 41 (11.6%) | 0 (0.0%) |
| $25,000 to $34,999 | 58 (16.4%) | 12 (4.2%) |
| $35,000 to $49,999 | 51 (14.4%) | 8 (2.8%) |
| $50,000 to $74,999 | 46 (13.0%) | 23 (8.1%) |
| $75,000 to $99,999 | 96 (27.1%) | 55 (19.4%) |
| $100,000 to $149,999 | 16 (4.5%) | 30 (10.6%) |
| $150,000 or more | 31 (8.8%) | 118 (41.5%) |
| Total | 354 (100.0%) | 284 (100.0%) |
Property Value to Household Income Ratio in Creola
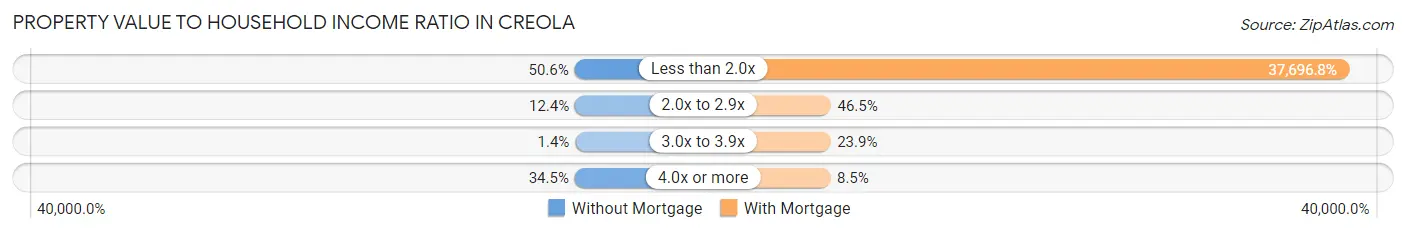
| Value-to-Income Ratio | Without Mortgage | With Mortgage |
| Less than 2.0x | 179 (50.6%) | 107,059 (37,696.8%) |
| 2.0x to 2.9x | 44 (12.4%) | 132 (46.5%) |
| 3.0x to 3.9x | 5 (1.4%) | 68 (23.9%) |
| 4.0x or more | 122 (34.5%) | 24 (8.5%) |
| Total | 354 (100.0%) | 284 (100.0%) |
Real Estate Taxes by Mortgage Status in Creola
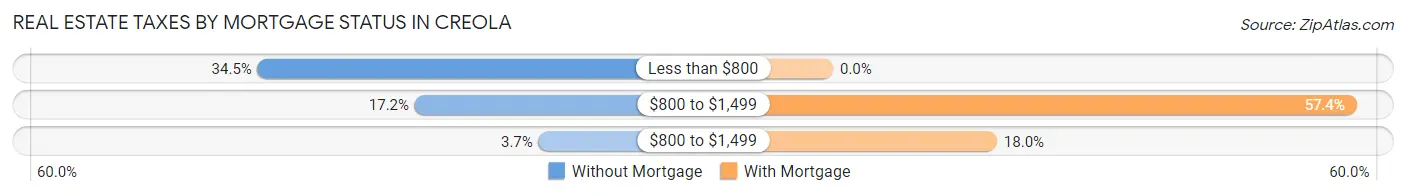
| Property Taxes | Without Mortgage | With Mortgage |
| Less than $800 | 122 (34.5%) | 0 (0.0%) |
| $800 to $1,499 | 61 (17.2%) | 163 (57.4%) |
| $800 to $1,499 | 13 (3.7%) | 51 (18.0%) |
| Total | 354 (100.0%) | 284 (100.0%) |
Health & Disability in Creola
Health Insurance Coverage by Age in Creola
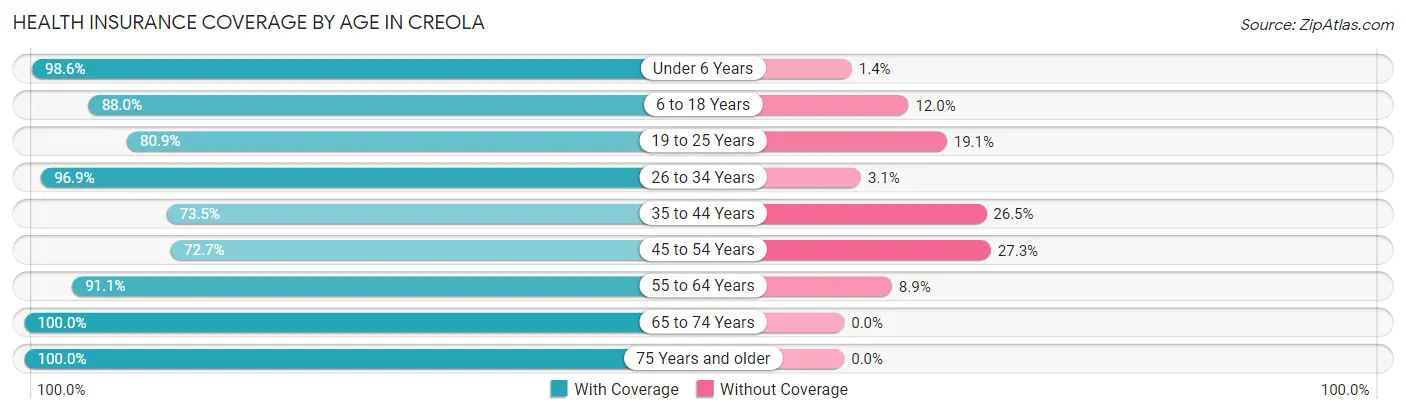
| Age Bracket | With Coverage | Without Coverage |
| Under 6 Years | 279 (98.6%) | 4 (1.4%) |
| 6 to 18 Years | 375 (88.0%) | 51 (12.0%) |
| 19 to 25 Years | 127 (80.9%) | 30 (19.1%) |
| 26 to 34 Years | 280 (96.9%) | 9 (3.1%) |
| 35 to 44 Years | 197 (73.5%) | 71 (26.5%) |
| 45 to 54 Years | 194 (72.7%) | 73 (27.3%) |
| 55 to 64 Years | 318 (91.1%) | 31 (8.9%) |
| 65 to 74 Years | 265 (100.0%) | 0 (0.0%) |
| 75 Years and older | 124 (100.0%) | 0 (0.0%) |
| Total | 2,159 (88.9%) | 269 (11.1%) |
Health Insurance Coverage by Citizenship Status in Creola
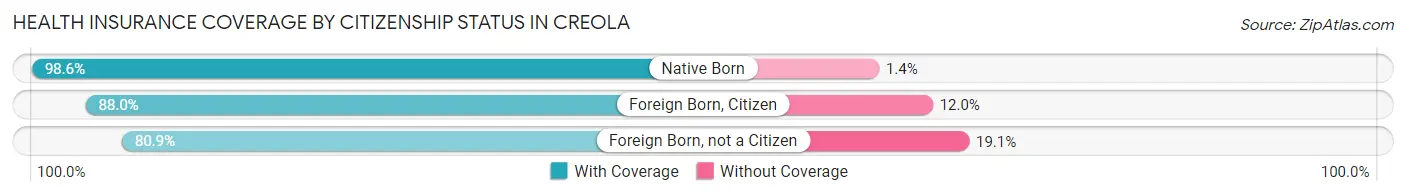
| Citizenship Status | With Coverage | Without Coverage |
| Native Born | 279 (98.6%) | 4 (1.4%) |
| Foreign Born, Citizen | 375 (88.0%) | 51 (12.0%) |
| Foreign Born, not a Citizen | 127 (80.9%) | 30 (19.1%) |
Health Insurance Coverage by Household Income in Creola
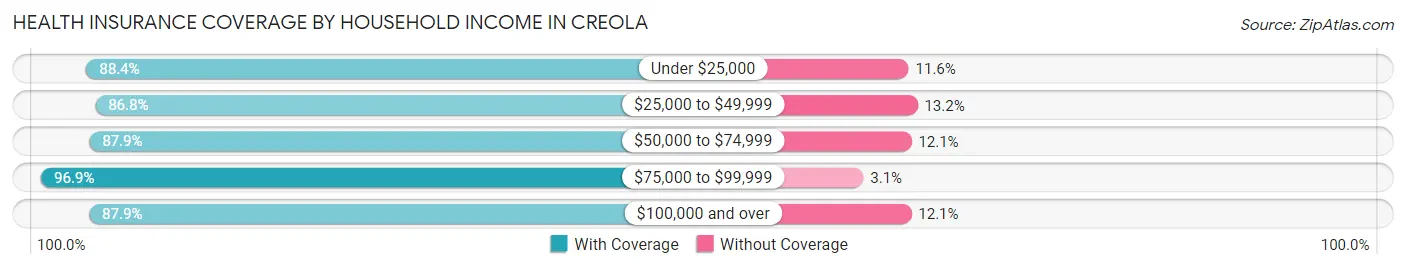
| Household Income | With Coverage | Without Coverage |
| Under $25,000 | 229 (88.4%) | 30 (11.6%) |
| $25,000 to $49,999 | 642 (86.8%) | 98 (13.2%) |
| $50,000 to $74,999 | 225 (87.9%) | 31 (12.1%) |
| $75,000 to $99,999 | 344 (96.9%) | 11 (3.1%) |
| $100,000 and over | 719 (87.9%) | 99 (12.1%) |
Public vs Private Health Insurance Coverage by Age in Creola
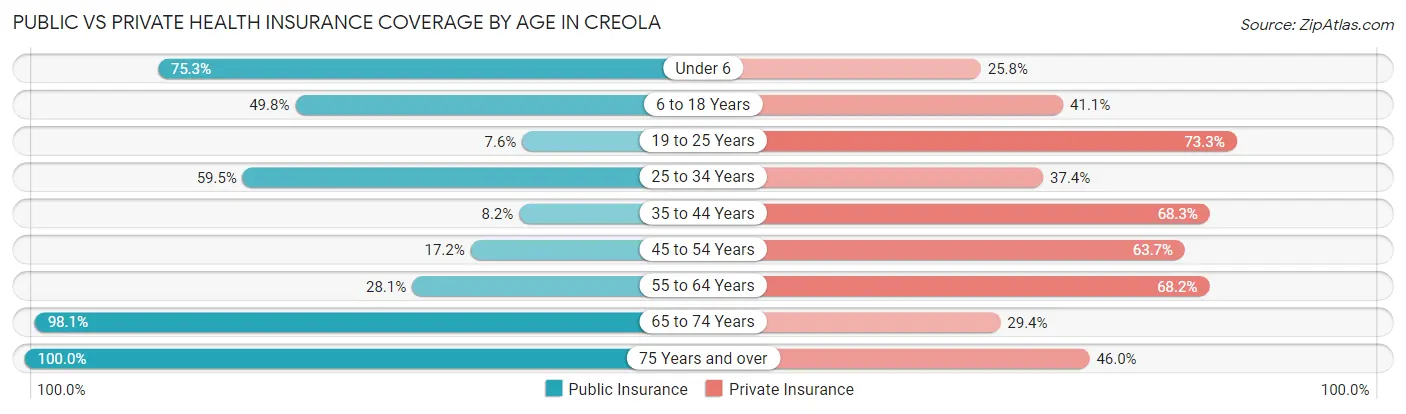
| Age Bracket | Public Insurance | Private Insurance |
| Under 6 | 213 (75.3%) | 73 (25.8%) |
| 6 to 18 Years | 212 (49.8%) | 175 (41.1%) |
| 19 to 25 Years | 12 (7.6%) | 115 (73.3%) |
| 25 to 34 Years | 172 (59.5%) | 108 (37.4%) |
| 35 to 44 Years | 22 (8.2%) | 183 (68.3%) |
| 45 to 54 Years | 46 (17.2%) | 170 (63.7%) |
| 55 to 64 Years | 98 (28.1%) | 238 (68.2%) |
| 65 to 74 Years | 260 (98.1%) | 78 (29.4%) |
| 75 Years and over | 124 (100.0%) | 57 (46.0%) |
| Total | 1,159 (47.7%) | 1,197 (49.3%) |
Disability Status by Sex by Age in Creola
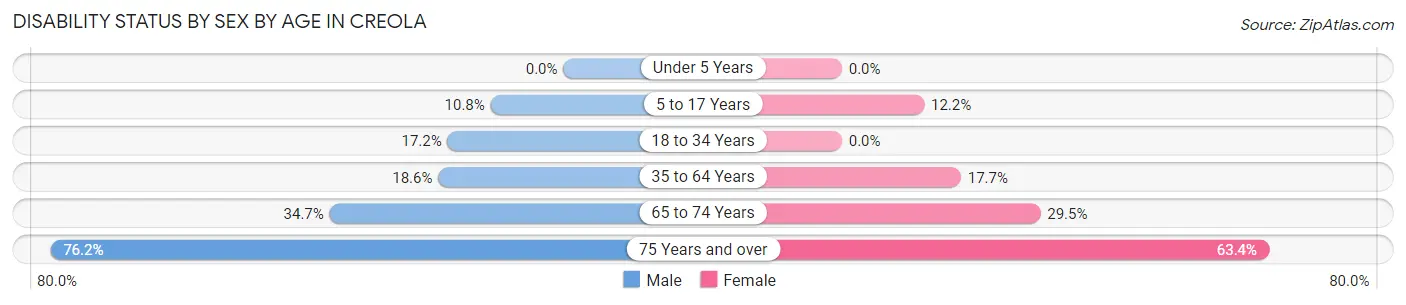
| Age Bracket | Male | Female |
| Under 5 Years | 0 (0.0%) | 0 (0.0%) |
| 5 to 17 Years | 19 (10.8%) | 32 (12.2%) |
| 18 to 34 Years | 33 (17.2%) | 0 (0.0%) |
| 35 to 64 Years | 78 (18.6%) | 82 (17.7%) |
| 65 to 74 Years | 59 (34.7%) | 28 (29.5%) |
| 75 Years and over | 32 (76.2%) | 52 (63.4%) |
Disability Class by Sex by Age in Creola
Disability Class: Hearing Difficulty
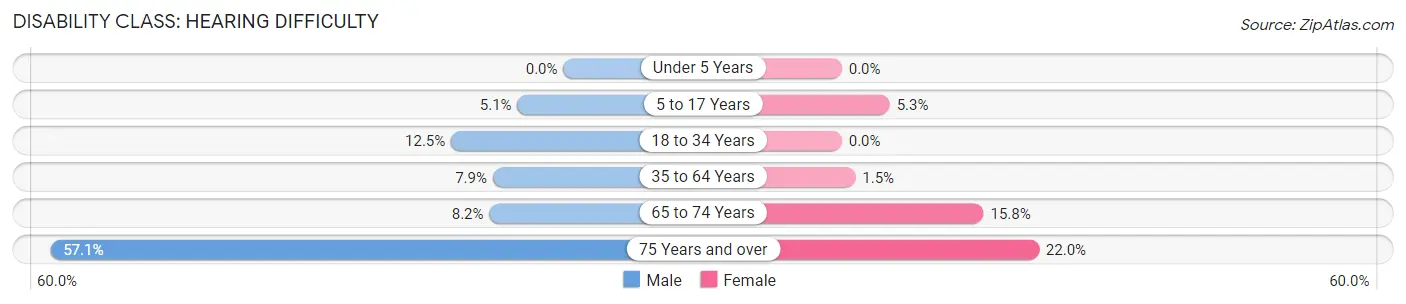
| Age Bracket | Male | Female |
| Under 5 Years | 0 (0.0%) | 0 (0.0%) |
| 5 to 17 Years | 9 (5.1%) | 14 (5.3%) |
| 18 to 34 Years | 24 (12.5%) | 0 (0.0%) |
| 35 to 64 Years | 33 (7.9%) | 7 (1.5%) |
| 65 to 74 Years | 14 (8.2%) | 15 (15.8%) |
| 75 Years and over | 24 (57.1%) | 18 (22.0%) |
Disability Class: Vision Difficulty
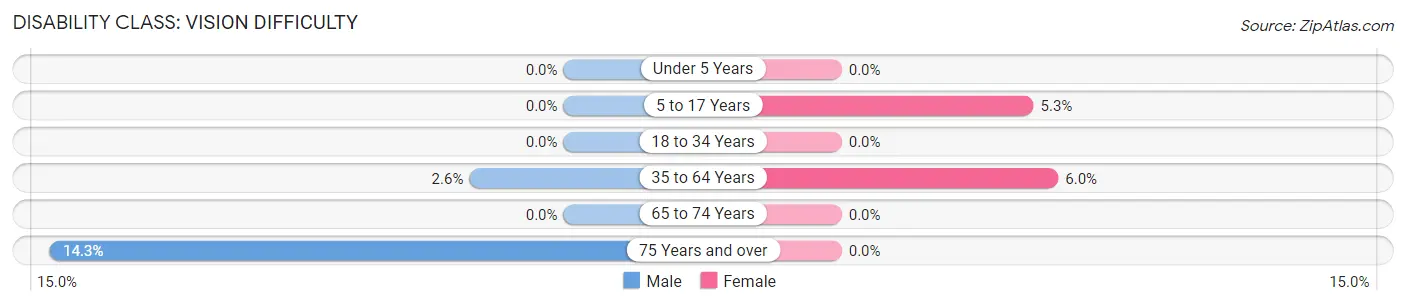
| Age Bracket | Male | Female |
| Under 5 Years | 0 (0.0%) | 0 (0.0%) |
| 5 to 17 Years | 0 (0.0%) | 14 (5.3%) |
| 18 to 34 Years | 0 (0.0%) | 0 (0.0%) |
| 35 to 64 Years | 11 (2.6%) | 28 (6.0%) |
| 65 to 74 Years | 0 (0.0%) | 0 (0.0%) |
| 75 Years and over | 6 (14.3%) | 0 (0.0%) |
Disability Class: Cognitive Difficulty
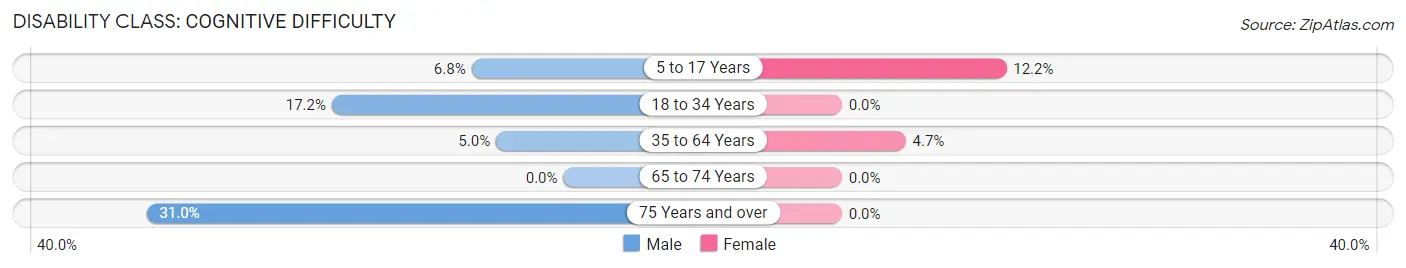
| Age Bracket | Male | Female |
| 5 to 17 Years | 12 (6.8%) | 32 (12.2%) |
| 18 to 34 Years | 33 (17.2%) | 0 (0.0%) |
| 35 to 64 Years | 21 (5.0%) | 22 (4.7%) |
| 65 to 74 Years | 0 (0.0%) | 0 (0.0%) |
| 75 Years and over | 13 (30.9%) | 0 (0.0%) |
Disability Class: Ambulatory Difficulty
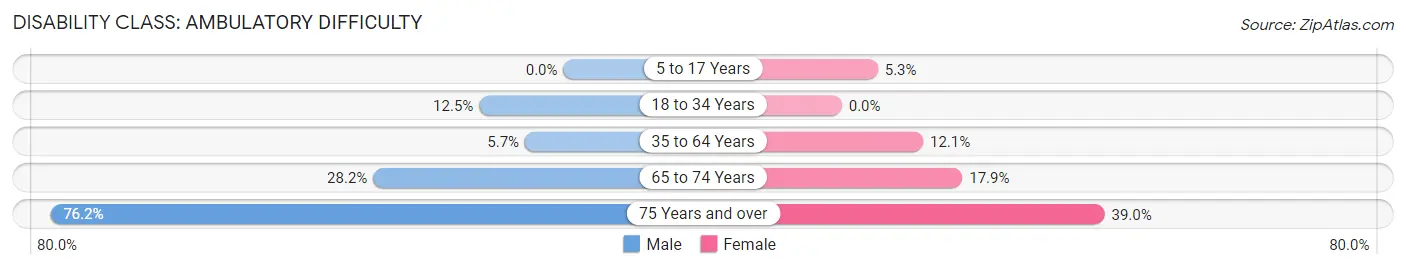
| Age Bracket | Male | Female |
| 5 to 17 Years | 0 (0.0%) | 14 (5.3%) |
| 18 to 34 Years | 24 (12.5%) | 0 (0.0%) |
| 35 to 64 Years | 24 (5.7%) | 56 (12.1%) |
| 65 to 74 Years | 48 (28.2%) | 17 (17.9%) |
| 75 Years and over | 32 (76.2%) | 32 (39.0%) |
Disability Class: Self-Care Difficulty
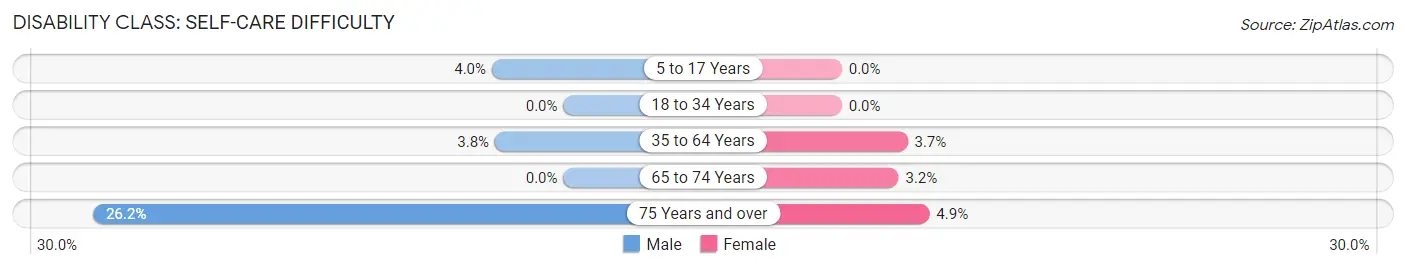
| Age Bracket | Male | Female |
| 5 to 17 Years | 7 (4.0%) | 0 (0.0%) |
| 18 to 34 Years | 0 (0.0%) | 0 (0.0%) |
| 35 to 64 Years | 16 (3.8%) | 17 (3.7%) |
| 65 to 74 Years | 0 (0.0%) | 3 (3.2%) |
| 75 Years and over | 11 (26.2%) | 4 (4.9%) |
Technology Access in Creola
Computing Device Access in Creola
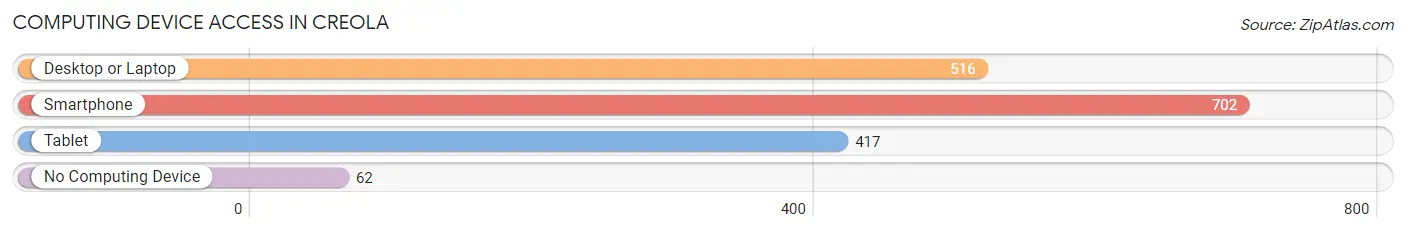
| Device Type | # Households | % Households |
| Desktop or Laptop | 516 | 64.9% |
| Smartphone | 702 | 88.3% |
| Tablet | 417 | 52.4% |
| No Computing Device | 62 | 7.8% |
| Total | 795 | 100.0% |
Internet Access in Creola
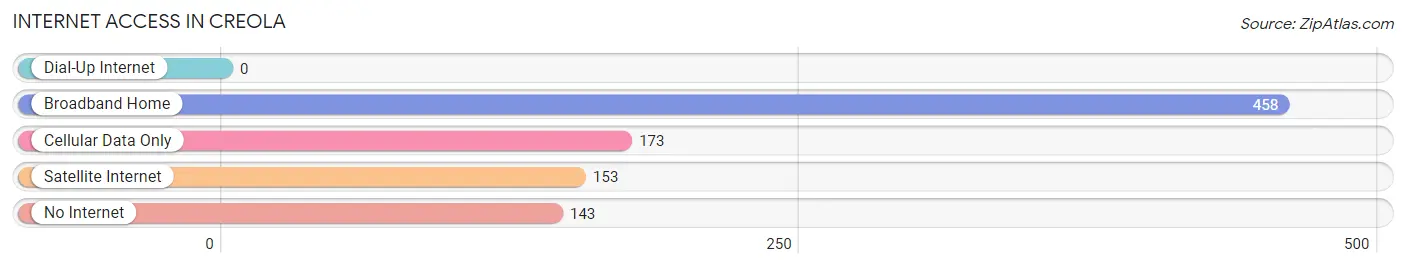
| Internet Type | # Households | % Households |
| Dial-Up Internet | 0 | 0.0% |
| Broadband Home | 458 | 57.6% |
| Cellular Data Only | 173 | 21.8% |
| Satellite Internet | 153 | 19.3% |
| No Internet | 143 | 18.0% |
| Total | 795 | 100.0% |
Creola Summary
Creola is a small city located in Mobile County, Alabama. It is situated on the western shore of Mobile Bay, approximately 20 miles north of Mobile. The city has a population of approximately 2,500 people and covers an area of 2.2 square miles.
History
The area that is now Creola was originally inhabited by Native American tribes, including the Choctaw and Creek. The first European settlers arrived in the area in the early 1800s, and the town was officially founded in 1819. The town was named after a local creek, which was named after a Choctaw chief named Creola.
In the early 1900s, Creola was a thriving agricultural community, with cotton, corn, and other crops being grown in the area. The town also had a thriving lumber industry, with several sawmills located in the area.
In the 1950s, Creola began to experience a population boom, as people moved to the area from other parts of the state. This growth continued into the 1960s and 1970s, and the city was incorporated in 1971.
Geography
Creola is located in Mobile County, Alabama, on the western shore of Mobile Bay. The city is situated at an elevation of approximately 30 feet above sea level. The city is bordered by the cities of Saraland to the north, Satsuma to the east, and Mobile to the south.
The city is located in a humid subtropical climate zone, with hot, humid summers and mild winters. The average annual temperature is around 70 degrees Fahrenheit, with an average high of around 90 degrees in the summer and an average low of around 50 degrees in the winter.
Economy
The economy of Creola is largely based on the service industry. The city is home to several restaurants, retail stores, and other businesses. The city also has a small manufacturing sector, with several small factories located in the area.
The city is also home to several educational institutions, including the University of South Alabama, Bishop State Community College, and the University of Mobile.
Demographics
As of the 2010 census, the population of Creola was 2,500 people. The racial makeup of the city was 79.2% White, 17.2% African American, 0.8% Native American, 0.4% Asian, 0.2% Pacific Islander, and 2.4% from other races. Hispanic or Latino of any race were 2.4% of the population.
The median household income in Creola was $37,500, and the median family income was $45,000. The per capita income was $19,000. Approximately 17.2% of the population was below the poverty line.
Conclusion
Creola is a small city located in Mobile County, Alabama. It is situated on the western shore of Mobile Bay, approximately 20 miles north of Mobile. The city has a population of approximately 2,500 people and covers an area of 2.2 square miles. The economy of Creola is largely based on the service industry, and the city is home to several educational institutions. The racial makeup of the city is 79.2% White, 17.2% African American, 0.8% Native American, 0.4% Asian, 0.2% Pacific Islander, and 2.4% from other races. The median household income in Creola was $37,500, and the median family income was $45,000. Approximately 17.2% of the population was below the poverty line.
Common Questions
What is the Total Population of Creola?
Total Population of Creola is 2,428.
What is the Total Male Population of Creola?
Total Male Population of Creola is 1,098.
What is the Total Female Population of Creola?
Total Female Population of Creola is 1,330.
What is the Ratio of Males per 100 Females in Creola?
There are 82.56 Males per 100 Females in Creola.
What is the Ratio of Females per 100 Males in Creola?
There are 121.13 Females per 100 Males in Creola.
What is the Median Population Age in Creola?
Median Population Age in Creola is 37.8 Years.
What is the Average Family Size in Creola
Average Family Size in Creola is 3.3 People.
What is the Average Household Size in Creola
Average Household Size in Creola is 3.0 People.
What is Per Capita Income in Creola?
Per Capita income in Creola is $27,377.
What is the Median Family Income in Creola?
Median Family Income in Creola is $75,069.
What is the Median Household income in Creola?
Median Household Income in Creola is $63,125.
What is Income or Wage Gap in Creola?
Income or Wage Gap in Creola is 39.6%.
Women in Creola earn 60.4 cents for every dollar earned by a man.
What is Inequality or Gini Index in Creola?
Inequality or Gini Index in Creola is 0.45.
How Large is the Labor Force in Creola?
There are 948 People in the Labor Forcein in Creola.
What is the Percentage of People in the Labor Force in Creola?
52.4% of People are in the Labor Force in Creola.
What is the Unemployment Rate in Creola?
Unemployment Rate in Creola is 7.0%.