Zip Codes with the Highest Percentage of Population Employed in Sales & Related in Birmingham, AL
RELATED REPORTS & OPTIONS
Sales & Related
Birmingham
Compare Zip Codes
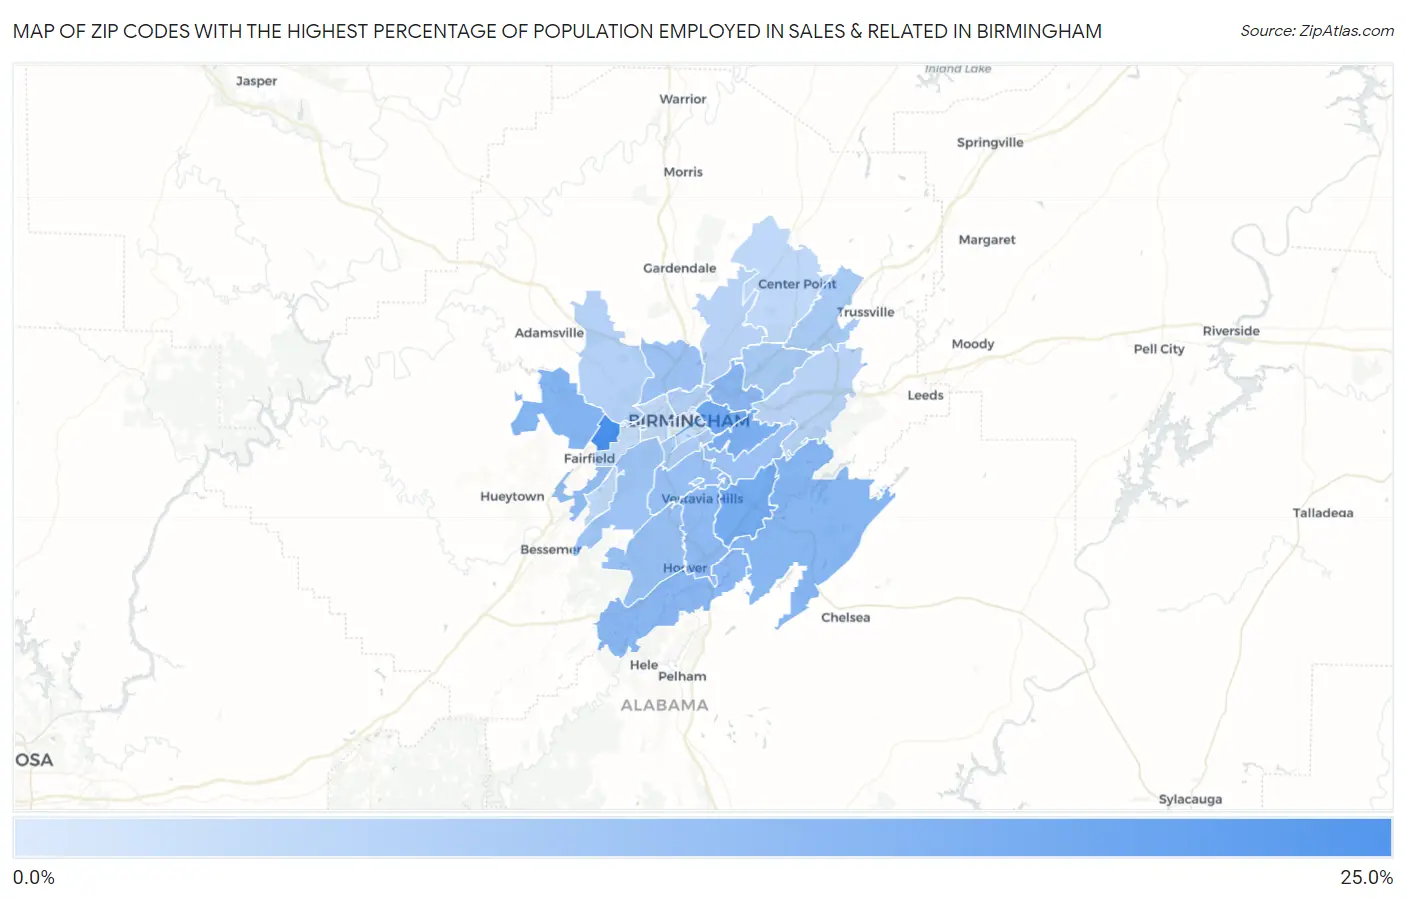
Map of Zip Codes with the Highest Percentage of Population Employed in Sales & Related in Birmingham
2.9%
20.8%
Zip Codes with the Highest Percentage of Population Employed in Sales & Related in Birmingham, AL
| Zip Code | % Employed | vs State | vs National | |
| 1. | 35218 | 20.8% | 10.0%(+10.9)#23 | 9.6%(+11.3)#1,031 |
| 2. | 35222 | 15.6% | 10.0%(+5.66)#61 | 9.6%(+6.03)#2,416 |
| 3. | 35243 | 15.0% | 10.0%(+5.03)#75 | 9.6%(+5.39)#2,739 |
| 4. | 35213 | 13.8% | 10.0%(+3.81)#97 | 9.6%(+4.17)#3,680 |
| 5. | 35224 | 13.2% | 10.0%(+3.29)#105 | 9.6%(+3.65)#4,231 |
| 6. | 35242 | 12.8% | 10.0%(+2.88)#117 | 9.6%(+3.24)#4,696 |
| 7. | 35212 | 12.5% | 10.0%(+2.53)#136 | 9.6%(+2.89)#5,204 |
| 8. | 35244 | 12.4% | 10.0%(+2.48)#140 | 9.6%(+2.84)#5,270 |
| 9. | 35216 | 11.9% | 10.0%(+1.97)#154 | 9.6%(+2.33)#6,172 |
| 10. | 35254 | 11.5% | 10.0%(+1.55)#174 | 9.6%(+1.91)#6,997 |
| 11. | 35228 | 11.4% | 10.0%(+1.48)#178 | 9.6%(+1.85)#7,154 |
| 12. | 35226 | 10.9% | 10.0%(+0.936)#206 | 9.6%(+1.30)#8,468 |
| 13. | 35209 | 10.8% | 10.0%(+0.816)#214 | 9.6%(+1.18)#8,800 |
| 14. | 35207 | 10.5% | 10.0%(+0.496)#229 | 9.6%(+0.857)#9,654 |
| 15. | 35223 | 10.4% | 10.0%(+0.489)#230 | 9.6%(+0.850)#9,674 |
| 16. | 35211 | 10.1% | 10.0%(+0.180)#252 | 9.6%(+0.541)#10,609 |
| 17. | 35235 | 9.1% | 10.0%(-0.900)#315 | 9.6%(-0.538)#14,313 |
| 18. | 35206 | 9.0% | 10.0%(-0.991)#321 | 9.6%(-0.630)#14,640 |
| 19. | 35205 | 8.6% | 10.0%(-1.38)#343 | 9.6%(-1.02)#16,052 |
| 20. | 35229 | 8.2% | 10.0%(-1.76)#371 | 9.6%(-1.40)#17,431 |
| 21. | 35214 | 7.6% | 10.0%(-2.33)#393 | 9.6%(-1.96)#19,231 |
| 22. | 35234 | 7.6% | 10.0%(-2.38)#395 | 9.6%(-2.02)#19,408 |
| 23. | 35210 | 7.2% | 10.0%(-2.76)#423 | 9.6%(-2.40)#20,636 |
| 24. | 35217 | 7.2% | 10.0%(-2.79)#425 | 9.6%(-2.43)#20,740 |
| 25. | 35221 | 6.3% | 10.0%(-3.65)#463 | 9.6%(-3.28)#22,926 |
| 26. | 35215 | 6.3% | 10.0%(-3.67)#466 | 9.6%(-3.31)#22,990 |
| 27. | 35204 | 6.0% | 10.0%(-3.97)#478 | 9.6%(-3.61)#23,694 |
| 28. | 35233 | 5.6% | 10.0%(-4.37)#494 | 9.6%(-4.01)#24,489 |
| 29. | 35208 | 5.4% | 10.0%(-4.54)#500 | 9.6%(-4.18)#24,814 |
| 30. | 35203 | 2.9% | 10.0%(-7.02)#559 | 9.6%(-6.66)#28,216 |
1
Common Questions
What are the Top 10 Zip Codes with the Highest Percentage of Population Employed in Sales & Related in Birmingham, AL?
Top 10 Zip Codes with the Highest Percentage of Population Employed in Sales & Related in Birmingham, AL are:
What zip code has the Highest Percentage of Population Employed in Sales & Related in Birmingham, AL?
35218 has the Highest Percentage of Population Employed in Sales & Related in Birmingham, AL with 20.8%.
What is the Percentage of Population Employed in Sales & Related in Birmingham, AL?
Percentage of Population Employed in Sales & Related in Birmingham is 9.8%.
What is the Percentage of Population Employed in Sales & Related in Alabama?
Percentage of Population Employed in Sales & Related in Alabama is 10.0%.
What is the Percentage of Population Employed in Sales & Related in the United States?
Percentage of Population Employed in Sales & Related in the United States is 9.6%.