Zip Codes with the Highest Percentage of Hispanic or Latino Population in Anniston, AL
RELATED REPORTS & OPTIONS
Hispanic or Latino
Anniston
Compare Zip Codes
Map of Zip Codes with the Highest Percentage of Hispanic or Latino Population in Anniston
2.3%
3.4%
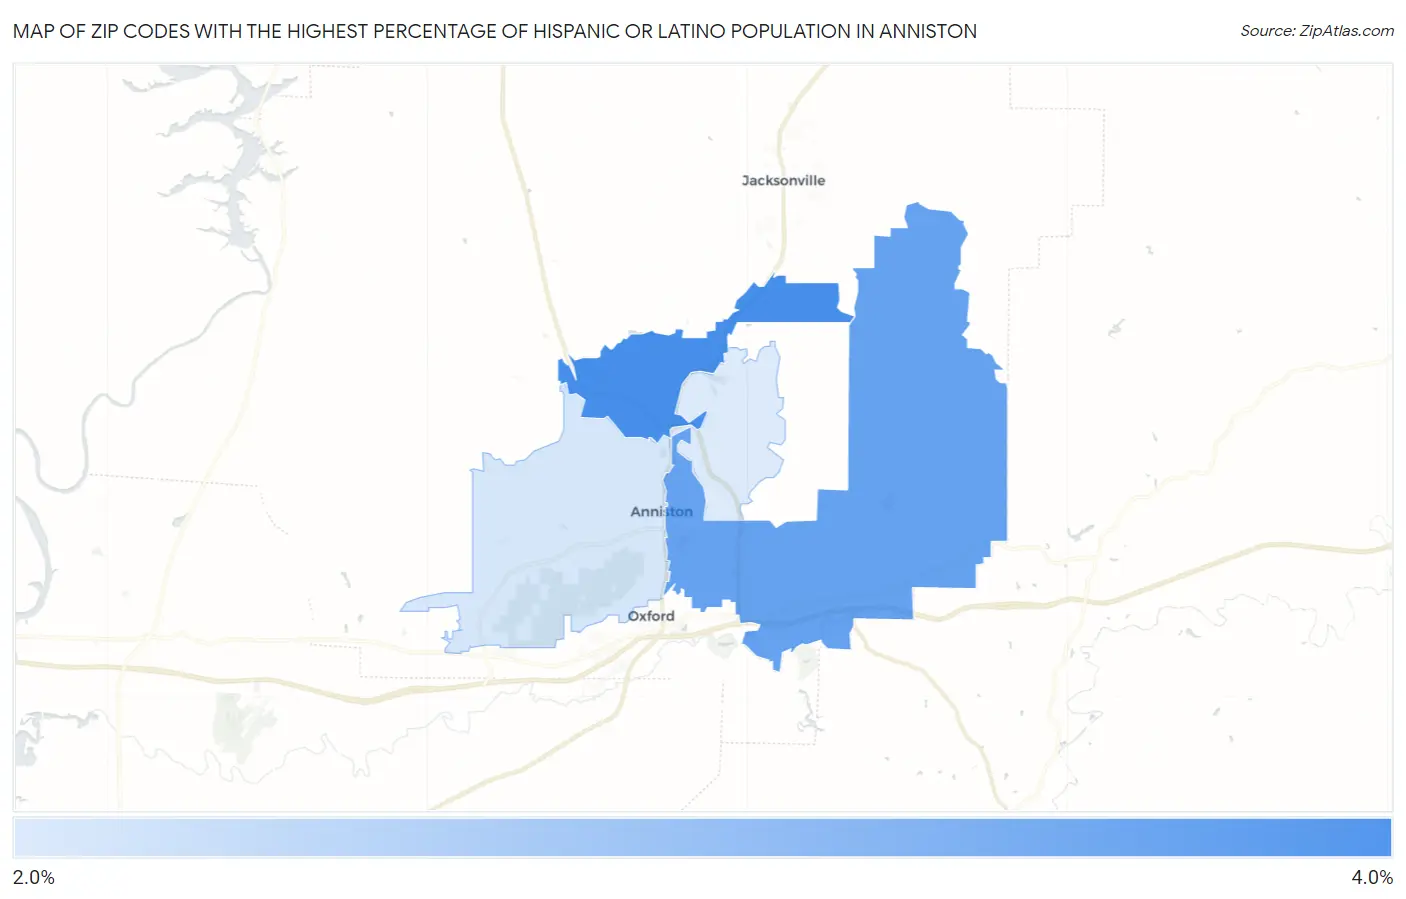
Zip Codes with the Highest Percentage of Hispanic or Latino Population in Anniston, AL
| Zip Code | Hispanic or Latino | vs State | vs National | |
| 1. | 36206 | 3.4% | 4.6%(-1.19)#212 | 18.7%(-15.2)#17,321 |
| 2. | 36207 | 3.2% | 4.6%(-1.41)#223 | 18.7%(-15.4)#17,814 |
| 3. | 36201 | 2.4% | 4.6%(-2.22)#283 | 18.7%(-16.3)#19,932 |
| 4. | 36205 | 2.3% | 4.6%(-2.28)#287 | 18.7%(-16.3)#20,062 |
1
Common Questions
What are the Top 3 Zip Codes with the Highest Percentage of Hispanic or Latino Population in Anniston, AL?
Top 3 Zip Codes with the Highest Percentage of Hispanic or Latino Population in Anniston, AL are:
What zip code has the Highest Percentage of Hispanic or Latino Population in Anniston, AL?
36206 has the Highest Percentage of Hispanic or Latino Population in Anniston, AL with 3.4%.
What is the Percentage of Hispanic or Latino Population in Anniston, AL?
Percentage of Hispanic or Latino Population in Anniston is 3.7%.
What is the Percentage of Hispanic or Latino Population in Alabama?
Percentage of Hispanic or Latino Population in Alabama is 4.6%.
What is the Percentage of Hispanic or Latino Population in the United States?
Percentage of Hispanic or Latino Population in the United States is 18.7%.